Elections to Tower Hamlets London Borough Council were held on 3 May 1990. The whole council was up for election. Turnout was 42.9%.
Tower Hamlets London Borough Council is the local authority for the London Borough of Tower Hamlets in Greater London, England. The council is unusual in that its executive function is controlled by a directly elected mayor of Tower Hamlets, currently John Biggs.
Party | Seats | Gains | Losses | Net gain/loss | Seats % | Votes % | Votes | +/− | |
---|---|---|---|---|---|---|---|---|---|
Liberal Democrat | 30 | 43.3 | |||||||
Labour | 20 | 43.0 | |||||||
Conservative | 0 | 5.3 |
Party | Candidate | Votes | % | ± | |
---|---|---|---|---|---|
Labour | David Lawrence | 1,020ea | |||
Labour | Christine Shawcroft | 1,015 | |||
Liberal Democrat | Peter Lear | 387 | |||
Liberal Democrat | Peter Segura | 365 | |||
Majority | |||||
Turnout | 4,167 | 35.6 | |||
Labour hold | Swing | ||||
Labour gain from Liberal Democrat | Swing | ||||
Party | Candidate | Votes | % | ± | |
---|---|---|---|---|---|
Liberal Democrat | Patricia Catchpole | 1,548 | |||
Liberal Democrat | Ronald Lebar | 1,497 | |||
Liberal Democrat | Patricia Webb | 1,451 | |||
Labour | Belle Harris | 860 | |||
Labour | Rory Moore | 805 | |||
Labour | Benard Richmond | 776 | |||
Majority | |||||
Turnout | 6,128 | 41.3 | |||
Liberal Democrat hold | Swing | ||||
Party | Candidate | Votes | % | ± | |
---|---|---|---|---|---|
Labour | Anne Delargy | 1,634 | |||
Labour | Neil McAree | 1,600 | |||
Labour | William Downes | 1,557 | |||
Liberal Democrat | Beryl Day | 956 | |||
Liberal Democrat | Karen Chambers | 890 | |||
Liberal Democrat | Carolyn Manser | 843 | |||
Conservative | Geoffrey Lenox-Smith | 97 | |||
Conservative | Peter Sayer | 77 | |||
Majority | |||||
Turnout | 6,780 | 41.8 | |||
Labour hold | Swing | ||||
Party | Candidate | Votes | % | ± | |
---|---|---|---|---|---|
Liberal Democrat | Nigel Huxted | 1,166 | |||
Liberal Democrat | Gwendoline Lee | 1,160 | |||
Labour | Patrick Little | 850 | |||
Labour | Stephen Beckett | 845 | |||
Majority | |||||
Turnout | 4,894 | 45.5 | |||
Liberal Democrat gain from Labour | Swing | ||||
Party | Candidate | Votes | % | ± | |
---|---|---|---|---|---|
Liberal Democrat | Eric Flounders | 1,169 | |||
Liberal Democrat | Janet Ludlow | 1,159 | |||
Labour | William Wakefield | 637 | |||
Labour | Emmanuel Penner | 604 | |||
Green | Stephen Petter | 102 | |||
Conservative | Barbara Perrott | 61 | |||
Conservative | Linda Ransom | 51 | |||
Majority | |||||
Turnout | 3,792 | 52.4 | |||
Liberal Democrat hold | Swing | ||||
Party | Candidate | Votes | % | ± | |
---|---|---|---|---|---|
Liberal Democrat | John Nudds | 1,965 | |||
Liberal Democrat | Jonathon Stokes | 1,909 | |||
Liberal Democrat | Akikur Rahman | 1,688 | |||
Labour | Edward Caunter | 975 | |||
Labour | Sunahwar Ali | 958 | |||
Labour | Rosemary Maher | 954 | |||
BNP | Stephen Smith | 290 | |||
Green | Christine Law | 222 | |||
Majority | |||||
Turnout | 6,613 | 49.9 | |||
Liberal Democrat hold | Swing | ||||
Party | Candidate | Votes | % | ± | |
---|---|---|---|---|---|
Liberal Democrat | Gwyneth Deakins | 1,735 | |||
Liberal Democrat | Barry Blandford | 1,702 | |||
Liberal Democrat | Peter Hughes | 1,697 | |||
Labour | Stephen Bowen | 1,240 | |||
Labour | Rhys Johnson | 1,056 | |||
Labour | Sally Witcher | 1,015 | |||
Conservative | Michael Tate | 75 | |||
Majority | |||||
Turnout | 6,374 | 49.5 | |||
Liberal Democrat hold | Swing | ||||
Liberal Democrat gain from Labour | Swing | ||||
Party | Candidate | Votes | % | ± | |
---|---|---|---|---|---|
Liberal Democrat | David Lewis | 1,655 | |||
Liberal Democrat | Maurice Caplan | 1,652 | |||
Liberal Democrat | Stewart Rayment | 1,625 | |||
Labour | Dennis Twomey | 1,033 | |||
Labour | Khan Murshid | 1,005 | |||
Labour | Patrick Seery | 1,004 | |||
Green | Alexander Hopwood | 130 | |||
Majority | |||||
Turnout | 6,110 | 48.2 | |||
Liberal Democrat hold | Swing | ||||
Party | Candidate | Votes | % | ± | |
---|---|---|---|---|---|
Labour | David Chapman | 1,755 | |||
Labour | Yvonne Amor | 1,689 | |||
Labour | Ivan Walker | 1,551 | |||
Liberal Democrat | Rita Bensley | 1,507 | |||
Liberal Democrat | Jonathan Mathews | 1,471 | |||
Liberal Democrat | George Pye | 1,449 | |||
Conservative | David Hughes | 294 | |||
Conservative | Paul Ingham | 284 | |||
Green | Stephen James | 279 | |||
Conservative | David Hoile | 249 | |||
Majority | |||||
Turnout | 9,203 | 41.3 | |||
Labour hold | Swing | ||||
Party | Candidate | Votes | % | ± | |
---|---|---|---|---|---|
Liberal Democrat | Margaret Atkins | 1,434 | |||
Liberal Democrat | Gyles Glover | 1,387 | |||
Labour | Philip Royal | 747 | |||
Labour | Jonathan Sterne | 725 | |||
Green | Michael Foreman | 59 | |||
Conservative | John Livingstone | 46 | |||
Conservative | David Ransom | 39 | |||
Majority | |||||
Turnout | 4,290 | 54.2 | |||
Liberal Democrat hold | Swing | ||||
Party | Candidate | Votes | % | ± | |
---|---|---|---|---|---|
Liberal Democrat | Christopher Birt | 1,606 | |||
Liberal Democrat | Ludlow Smith | 1,558 | |||
Labour | Ashek Ali | 714 | |||
Labour | Chuen Lam | 647 | |||
Tenants, Leaseholders & Residents | Peter Gibson | 106 | |||
Tenants, Leaseholders & Residents | James Langan | 102 | |||
Independent | Abdul Khan | 99 | |||
BNP | Derek Beackon | 93 | |||
Conservative | James Lucy | 51 | |||
Conservative | Zlata Peacock | 39 | |||
Majority | |||||
Turnout | 4,937 | 54.1 | |||
Liberal Democrat hold | Swing | ||||
Party | Candidate | Votes | % | ± | |
---|---|---|---|---|---|
Labour | John Biggs | 1,733 | |||
Labour | Derek Gadd | 1,630 | |||
Labour | Shahab Ahmed | 1,628 | |||
Liberal Democrat | Terence Cowley | 808 | |||
Liberal Democrat | Christine McNair | 751 | |||
Liberal Democrat | James Randall | 673 | |||
Green | Derek England | 190 | |||
Conservative | Robert Ingram | 163 | |||
Conservative | Sarah-Jane Quinlan | 138 | |||
Conservative | Matthew Martyn | 129 | |||
Majority | |||||
Turnout | 6,421 | 45.8 | |||
Labour hold | Swing | ||||
Party | Candidate | Votes | % | ± | |
---|---|---|---|---|---|
Liberal Democrat | Albert Snooks | 1,318 | |||
Liberal Democrat | Jennifer Mitchell | 1,304 | |||
Labour | Albert Jacob | 888 | |||
Labour | Oona Hickson | 818 | |||
Green | Paul Costas | 107 | |||
BNP | David Ettridge | 93 | |||
Conservative | Lillian Ingram | 45 | |||
Conservative | Adrian Thompson | 40 | |||
Majority | |||||
Turnout | 4,735 | 51.5 | |||
Liberal Democrat hold | Swing | ||||
Liberal Democrat gain from Labour | Swing | ||||
Party | Candidate | Votes | % | ± | |
---|---|---|---|---|---|
Labour | Abdul Asad | 2,028 | |||
Labour | Rajan Jalal | 1,951 | |||
Labour | Shirazul Islam | 1,931 | |||
Conservative | Richard Currie | 850 | |||
Conservative | Nicola Dunsford | 846 | |||
Green | John Southworth | 681 | |||
Conservative | Abdul Hamid | 601 | |||
Community Campaign | Ashfaque Ahmed | 301 | |||
Community Campaign | Muhammed Anas | 297 | |||
Majority | |||||
Turnout | 8,987 | 41.4 | |||
Labour hold | Swing | ||||
Party | Candidate | Votes | % | ± | |
---|---|---|---|---|---|
Liberal Democrat | Ronald Osborne | 604 | |||
Liberal Democrat | Justine Ward | 596 | |||
Labour | Barnett Saunders | 592 | |||
Labour | Julia Mainwaring | 588 | |||
Community Campaign | Shah Haque | 219 | |||
Tenants, Leaseholders & Residents | Emmanuel Parris | 174 | |||
Tenants, Leaseholders & Residents | Raymond Warner | 145 | |||
Independent | Abu Hassain | 91 | |||
Conservative | Mohammed Khan | 58 | |||
Conservative | Andrew Smith | 39 | |||
Majority | |||||
Turnout | 3,632 | 45.6 | |||
Liberal Democrat gain from Labour | Swing | ||||
Party | Candidate | Votes | % | ± | |
---|---|---|---|---|---|
Liberal Democrat | Brenda Collins | 2,089 | |||
Liberal Democrat | Abdul Rohim | 1,981 | |||
Liberal Democrat | Betty Wright | 1,933 | |||
Labour | Fanu Miah | 1,232 | |||
Labour | Amanda Owen | 1,202 | |||
Labour | Terence Penton | 1,101 | |||
Green | Harvey Gilbert | 289 | |||
Majority | |||||
Turnout | 7,340 | 48.3 | |||
Liberal Democrat hold | Swing | ||||
Party | Candidate | Votes | % | ± | |
---|---|---|---|---|---|
Labour | Albert Lilley | 1,679 | |||
Labour | John Riley | 1,575 | |||
Labour | Pola Uddin | 1,447 | |||
Conservative | Nicholas Martin | 574 | |||
Conservative | Isobel Taylor | 507 | |||
Conservative | Thomas Taylor | 507 | |||
Majority | |||||
Turnout | 6,241 | 38.1 | |||
Labour hold | Swing | ||||
Party | Candidate | Votes | % | ± | |
---|---|---|---|---|---|
Labour | Philip Maxwell | 1,501 | |||
Labour | Ghulam Mortuza | 1,482 | |||
Labour | Abbas Uddin | 1,451 | |||
Conservative | Abdul Kadir | 372 | |||
Conservative | Jane Emmerson | 266 | |||
Independent Tenant | Michael McGeorge | 248 | |||
Community Campaign | Abdul Khan | 244 | |||
Green | Edward Reddin | 215 | |||
Conservative | Jennifer Tobin | 211 | |||
BNP | Kenneth Walsh | 70 | |||
Majority | |||||
Turnout | 5,609 | 42.9 | |||
Labour hold | Swing | ||||
Party | Candidate | Votes | % | ± | |
---|---|---|---|---|---|
Liberal Democrat | Jeremy Shaw | 2,504 | |||
Liberal Democrat | Sajjad Miah | 2,335 | |||
Liberal Democrat | Kofi Appiah | 2,332 | |||
Labour | Sirajul Islam | 1,177 | |||
Labour | Jil Cove | 1,145 | |||
Labour | Donald Hoyle | 1,121 | |||
Independent Islamic | Mohammed Rakib | 77 | |||
Conservative | Shundor Ali | 66 | |||
Conservative | Shelim Uddin | 41 | |||
Majority | |||||
Turnout | 7,062 | 55.0 | |||
Liberal Democrat hold | Swing | ||||
Local elections took place in many parts of England on 7 May 1998. All London borough council seats were elected as well a third of the seats on each of the Metropolitan Boroughs. Some unitary authorities and District councils also had elections. There were no local elections in Scotland, Wales or Northern Ireland.
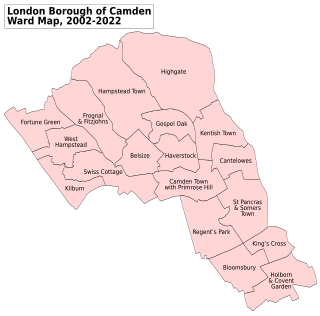
The Camden London Borough Council in London, England is elected every four years. Since the last boundary changes in 2002, 54 councillors have been elected from 18 wards.
Redbridge London Borough Council is elected every four years.
Sutton London Borough Council in London, England is elected every four years.
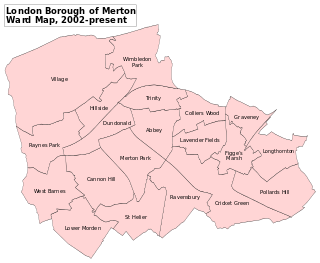
Merton London Borough Council in London, England is elected every four years; it has administrative control over the London Borough of Merton.
Westminster City Council, the local authority of the City of Westminster in London, England, is elected every four years. Since the last boundary changes in 2002, 60 councillors have been elected from 20 wards.
Elections to Lambeth London Borough Council were held in May 1990. The whole council was up for election. Turnout was 42.3%.
Elections to Newham London Borough Council were held in May 1990. The whole council was up for election. Turnout was 33.0%.
Elections to Lewisham London Borough Council were held in May 1990. The whole council was up for election. Turnout was 39.6%.
Elections to Tower Hamlets London Borough Council were held in May 1986. The whole council was up for election. Turnout was 35.0%.
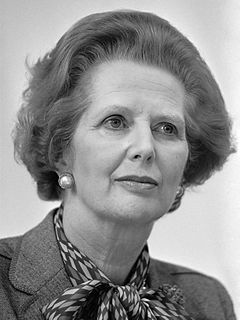
Local elections were held in the United Kingdom on 3 May 1990. They were the last local elections held before the resignation of Prime Minister Margaret Thatcher in November 1990.
Greenwich London Borough Council in London, England is elected every four years. Since the last boundary changes in 2002, 51 councillors have been elected from 17 wards.
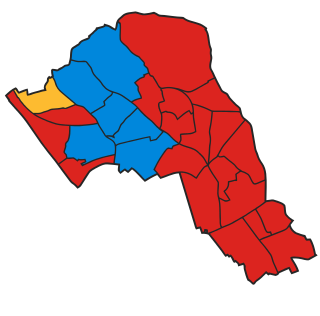
The 1990 Camden Council election took place on 3 May 1990 to elect members of Camden London Borough Council in London, England. The whole council was up for election. Labour comfortably stayed in overall control of the council, despite the Conservatives gaining three seats at their expense in Swiss Cottage. The Green Party came third in vote share with 13% of the vote, but won no seats.
Local government elections took place in London, and some other parts of the United Kingdom on Thursday 5 May 1994. Ward changes took place in Barking and Dagenham and Ealing which increased the total number of councillors by 3 from 1,914 to 1,917.
Local government elections took place in London, and some other parts of the United Kingdom on Thursday 3 May 1990.
Local government elections took place in London, and some other parts of the United Kingdom on Thursday 13 May 1971.
The 1986 Barnet Council election took place on 8 May 1986 to elect members of Barnet London Borough Council in London, England. The whole council was up for election and the Conservative party stayed in overall control of the council.
The 1990 Barnet Council election took place on 3 May 1990 to elect members of Barnet London Borough Council in London, England. The whole council was up for election and the Conservative party stayed in overall control of the council.
Elections for the London Borough of Merton were held on 3 May 1990 to elect members of Merton London Borough Council in London, England. This was on the same day as other local elections in England and Scotland.
Elections for the London Borough of Merton were held on 5 May 1994 to elect members of Merton London Borough Council in London, England. This was on the same day as other local elections in England.