The method of least squares is a standard approach in regression analysis to approximate the solution of overdetermined systems by minimizing the sum of the squares of the residuals made in the results of each individual equation.

The Lotka–Volterra equations, also known as the predator–prey equations, are a pair of first-order nonlinear differential equations, frequently used to describe the dynamics of biological systems in which two species interact, one as a predator and the other as prey. The populations change through time according to the pair of equations:
EconMult is a general fleet model to be used in fisheries modelling. EconMult has been developed since 1991 as a part of the Multispecies management programme by the Norwegian Research Council at the Norwegian College of Fishery Science.

Kleiber's law, named after Max Kleiber for his biology work in the early 1930s, is the observation that, for the vast majority of animals, an animal's metabolic rate scales to the 3⁄4 power of the animal's mass. Symbolically: if is the animal's metabolic rate, and the animal's mass, then Kleiber's law states that . Thus, over the same timespan, a cat having a mass 100 times that of a mouse will consume only about 32 times the energy the mouse uses.

Allometry is the study of the relationship of body size to shape, anatomy, physiology and finally behaviour, first outlined by Otto Snell in 1892, by D'Arcy Thompson in 1917 in On Growth and Form and by Julian Huxley in 1932.

Regression dilution, also known as regression attenuation, is the biasing of the linear regression slope towards zero, caused by errors in the independent variable.
In econometrics, endogeneity broadly refers to situations in which an explanatory variable is correlated with the error term. The distinction between endogenous and exogenous variables originated in simultaneous equations models, where one separates variables whose values are determined by the model from variables which are predetermined; ignoring simultaneity in the estimation leads to biased estimates as it violates the exogeneity assumption of the Gauss–Markov theorem. The problem of endogeneity is often ignored by researchers conducting non-experimental research and doing so precludes making policy recommendations. Instrumental variable techniques are commonly used to address this problem.

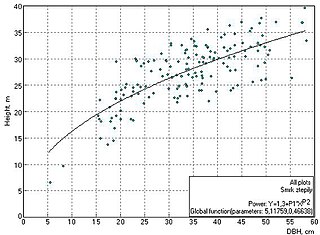
Diameter at breast height, or DBH, is a standard method of expressing the diameter of the trunk or bole of a standing tree. DBH is one of the most common dendrometric measurements.
The following outline is provided as an overview of and guide to forestry:
Basal area is the cross-sectional area of trees at breast height. It is a common way to describe stand density. In forest management, basal area usually refers to merchantable timber and is given on a per hectare or per acre basis. If you cut down all the merchantable trees on an acre at 4 ½ feet off the ground and measured the square inches on the top of each stump (πr*r), added them all together and divided by square feet, that would be the basal area on that acre. In forest ecology, basal area is used as a relatively easily-measured surrogate of total forest biomass and structural complexity, and change in basal area over time is an important indicator of forest recovery during succession .
Site index is a term used in forestry to describe the potential for forest trees to grow at a particular location or "site". Site is defined as "The average age of dominate and/or codominate trees of an even-aged, undisturbed site of intolerant trees at a base age"; furthermore, the word site is used in forestry to refer to a distinct area where trees are found. Site index is used to measure the productivity of the site and the management options for that site and reports the height of dominant and co-dominant trees in a stand at a base age such as 25, 50 and 100 years. For example, a red oak with an age of 50 years and a height of 70 feet (21 m) will have a site index of 70. Site index is species specific. Common methods used to determine site index are based on tree height, plant composition and the use of soil maps.
A diameter tape (D-tape) is a measuring tape used to estimate the diameter of a cylinder object, typically the stem of a tree or pipe. A diameter tape has either metric or imperial measurements reduced by the value of π. This means the tape measures the diameter of the object. It is assumed that the cylinder object is a perfect circle. The diameter tape provides an approximation of diameter; most commonly used in dendrometry.
A Volume table is a chart to aid in the estimation of standing timber volume. These tables are based on volume equations and use correlations between certain aspects of a tree to estimate the volume to a degree of certainty. The diameter at breast height (DBH) and the merchantable height are used to determine the total volume. Difficulties occur when estimating the form class of the tree in question. The Mesavage and Girard form classes used to classify the trees to decide which volume table should be used. These volume tables are also based on different log rules such a Scribner, Doyle, and International ¼” scale. In order to be effective, the proper form class must be selected as well as accurate DBH and height measurements.
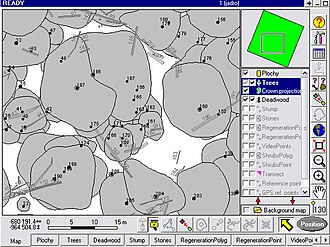
Forest inventory is the systematic collection of data and forest information for assessment or analysis. An estimate of the value and possible uses of timber is an important part of the broader information required to sustain ecosystems. When taking forest inventory the following are important things to measure and note: species, diameter at breast height (DBH), height, site quality, age, and defects. From the data collected one can calculate the number of trees per acre, the basal area, the volume of trees in an area, and the value of the timber. Inventories can be done for other reasons than just calculating the value. A forest can be cruised to visually assess timber and determine potential fire hazards and the risk of fire. The results of this type of inventory can be used in preventive actions and also awareness. Wildlife surveys can be undertaken in conjunction with timber inventory to determine the number and type of wildlife within a forest. The aim of the statistical forest inventory is to provide comprehensive information about the state and dynamics of forests for strategic and management planning. Merely looking at the forest for assessment is called taxation.
Stand density index is a measure of the stocking of a stand of trees based on the number of trees per unit area and diameter at breast height (DBH) of the tree of average basal area, also known as the quadratic mean diameter. It may also be defined as the degree of crowding within stocked areas, using various growing space ratios based on crown length or diameter, tree height or diameter, and spacing. Stand density index is usually well correlated with stand volume and growth, and several variable-density yield tables have been created using it. Basal area, however, is usually satisfactory as a measure of stand density index and because it is easier to calculate it is usually preferred over SDI. Stand density index is also the basis for Stand density management diagrams.
Dendrometry is the branch of botany that is concerned with the measurement of the various dimensions of trees, such as their diameter, size, shape, age, overall volume, thickness of the bark, etc., as well as the statistical properties of tree stands, including measures of central tendency and dispersion of these quantities, wood density, or yearly growth, for instance.
FORECAST is a management-oriented, stand-level, forest-growth and ecosystem-dynamics model. The model was designed to accommodate a wide variety of silvicultural and harvesting systems and natural disturbance events in order to compare and contrast their effect on forest productivity, stand dynamics, and a series of biophysical indicators of non-timber values.
Biomass partitioning is the process by which plants divide their energy among their leaves, stems, roots, and reproductive parts. These four main components of the plant have important morphological roles: leaves take in CO2 and energy from the sun to create carbon compounds, stems grow above competitors to reach sunlight, roots absorb water and mineral nutrients from the soil while anchoring the plant, and reproductive parts facilitate the continuation of species. Plants partition biomass in response to limits or excesses in resources like sunlight, carbon dioxide, mineral nutrients, and water and growth is regulated by a constant balance between the partitioning of biomass between plant parts. An equilibrium between root and shoot growth occurs because roots need carbon compounds from photosynthesis in the shoot and shoots need nitrogen absorbed from the soil by roots. Allocation of biomass is put towards the limit to growth; a limit below ground will focus biomass to the roots and a limit above ground will favor more growth in the shoot.
In statistics, linear regression is a linear approach for modelling the relationship between a scalar response and one or more explanatory variables. The case of one explanatory variable is called simple linear regression; for more than one, the process is called multiple linear regression. This term is distinct from multivariate linear regression, where multiple correlated dependent variables are predicted, rather than a single scalar variable.
Biomass allocation is a concept in plant biology which indicates the relative proportion of plant biomass present in the different organs of a plant. It can also be used for whole plant communities.