Whitehaven | |
---|---|
Former county constituency for the House of Commons | |
![]() Whitehaven in Cumberland, 1974-1983 | |
County | 1832–1974: Cumberland 1974–1983: Cumbria |
Major settlements | Whitehaven |
1832–1983 | |
Seats | One |
Created from | Cumberland |
Replaced by | Copeland |
Whitehaven was a constituency centred on the town of Whitehaven in Cumberland, which returned one Member of Parliament (MP) to the House of Commons of the Parliament of the United Kingdom.
It was created in 1832 and renamed Copeland at the 1983 general election.
The boundaries were unaffected in 1885, under the second Great Reform agreed the previous year, its key limb of The Redistribution of Seats Act 1885 not yet absorbing the bulk of the area of Egremont or 'the Western Division of Cumberland'. [1] The latter mainly rural area, much larger than Whitehaven borough which formed the existing seat, was added to the seat under the Representation of the People Act 1918.
Party | Candidate | Votes | % | ||
---|---|---|---|---|---|
Tory | Matthias Attwood | 210 | 54.7 | ||
Whig | Isaac Littledale | 174 | 45.3 | ||
Majority | 36 | 9.4 | |||
Turnout | 384 | 83.8 | |||
Registered electors | 458 | ||||
Tory win (new seat) |
Party | Candidate | Votes | % | ±% | |
---|---|---|---|---|---|
Conservative | Matthias Attwood | Unopposed | |||
Registered electors | 460 | ||||
Conservative hold |
Party | Candidate | Votes | % | ±% | |
---|---|---|---|---|---|
Conservative | Matthias Attwood | Unopposed | |||
Registered electors | 476 | ||||
Conservative hold |
Party | Candidate | Votes | % | ±% | |
---|---|---|---|---|---|
Conservative | Matthias Attwood | Unopposed | |||
Registered electors | 558 | ||||
Conservative hold |
Party | Candidate | Votes | % | ±% | |
---|---|---|---|---|---|
Conservative | Robert Hildyard | Unopposed | |||
Registered electors | 543 | ||||
Conservative hold |
Party | Candidate | Votes | % | ±% | |
---|---|---|---|---|---|
Conservative | Robert Hildyard | Unopposed | |||
Registered electors | 512 | ||||
Conservative hold |
Party | Candidate | Votes | % | ±% | |
---|---|---|---|---|---|
Conservative | Robert Hildyard | Unopposed | |||
Registered electors | 555 | ||||
Conservative hold |
Hildyard's death caused a by-election.
Party | Candidate | Votes | % | ±% | |
---|---|---|---|---|---|
Conservative | George Lyall | Unopposed | |||
Conservative hold |
Party | Candidate | Votes | % | ±% | |
---|---|---|---|---|---|
Conservative | George Lyall | Unopposed | |||
Registered electors | 571 | ||||
Conservative hold |
Party | Candidate | Votes | % | ±% | |
---|---|---|---|---|---|
Conservative | George Cavendish-Bentinck | Unopposed | |||
Registered electors | 648 | ||||
Conservative hold |
Party | Candidate | Votes | % | ±% | |
---|---|---|---|---|---|
Conservative | George Cavendish-Bentinck | 1,125 | 59.3 | N/A | |
Liberal | Anthony Benn Steward [4] | 771 | 40.7 | New | |
Majority | 354 | 18.6 | N/A | ||
Turnout | 1,896 | 76.0 | N/A | ||
Registered electors | 2,495 | ||||
Conservative hold |
Party | Candidate | Votes | % | ±% | |
---|---|---|---|---|---|
Conservative | George Cavendish-Bentinck | Unopposed | |||
Registered electors | 2,431 | ||||
Conservative hold |
Cavendish-Bentinck was appointed Judge Advocate General of the Armed Forces, causing a by-election.
Party | Candidate | Votes | % | ±% | |
---|---|---|---|---|---|
Conservative | George Cavendish-Bentinck | 1,503 | 82.8 | N/A | |
Liberal | Charles Thompson [5] | 313 | 17.2 | New | |
Majority | 1,190 | 65.6 | N/A | ||
Turnout | 1,816 | 69.9 | N/A | ||
Registered electors | 2,599 | ||||
Conservative hold | Swing | N/A |
Party | Candidate | Votes | % | ±% | |
---|---|---|---|---|---|
Conservative | George Cavendish-Bentinck | 1,204 | 52.9 | N/A | |
Liberal | William Gully | 1,072 | 47.1 | N/A | |
Majority | 132 | 5.8 | N/A | ||
Turnout | 2,276 | 86.8 | N/A | ||
Registered electors | 2,622 | ||||
Conservative hold | Swing | N/A |
Party | Candidate | Votes | % | ±% | |
---|---|---|---|---|---|
Conservative | George Cavendish-Bentinck | 1,336 | 54.3 | +1.4 | |
Liberal | William Gully | 1,125 | 45.7 | −1.4 | |
Majority | 211 | 8.6 | +2.8 | ||
Turnout | 2,461 | 91.6 | +4.8 | ||
Registered electors | 2,687 | ||||
Conservative hold | Swing | +1.4 |
Party | Candidate | Votes | % | ±% | |
---|---|---|---|---|---|
Conservative | George Cavendish-Bentinck | 1,216 | 52.3 | −2.0 | |
Liberal | Henry Gordon Shee | 1,110 | 47.7 | +2.0 | |
Majority | 106 | 4.6 | −4.0 | ||
Turnout | 2,326 | 86.6 | −5.0 | ||
Registered electors | 2,687 | ||||
Conservative hold | Swing | -2.0 |
Cavendish-Bentinck's death caused a by-election.
Party | Candidate | Votes | % | ±% | |
---|---|---|---|---|---|
Conservative | James Bain | 1,338 | 54.8 | +2.5 | |
Liberal | Henry Gordon Shee | 1,105 | 45.2 | −2.5 | |
Majority | 233 | 9.6 | +5.0 | ||
Turnout | 2,443 | 90.0 | +3.4 | ||
Registered electors | 2,713 | ||||
Conservative hold | Swing | +2.5 |
Party | Candidate | Votes | % | ±% | |
---|---|---|---|---|---|
Liberal | Thomas Shepherd Little | 1,306 | 54.6 | +6.9 | |
Conservative | James Bain | 1,088 | 45.4 | −6.9 | |
Majority | 218 | 9.2 | N/A | ||
Turnout | 2,394 | 88.7 | +2.1 | ||
Registered electors | 2,700 | ||||
Liberal gain from Conservative | Swing | +6.9 |
Party | Candidate | Votes | % | ±% | |
---|---|---|---|---|---|
Conservative | Augustus Helder | 1,380 | 55.3 | +9.9 | |
Liberal | Thomas Shepherd Little | 1,114 | 44.7 | −9.9 | |
Majority | 266 | 10.6 | N/A | ||
Turnout | 2,494 | 90.8 | +2.1 | ||
Registered electors | 2,746 | ||||
Conservative gain from Liberal | Swing | +9.9 |
Party | Candidate | Votes | % | ±% | |
---|---|---|---|---|---|
Conservative | Augustus Helder | 1,553 | 63.9 | +8.6 | |
Liberal | W McGowan | 876 | 36.1 | −8.6 | |
Majority | 677 | 27.8 | +17.2 | ||
Turnout | 2,429 | 86.0 | −4.8 | ||
Registered electors | 2,824 | ||||
Conservative hold | Swing | +8.6 |
Party | Candidate | Votes | % | ±% | |
---|---|---|---|---|---|
Liberal | William Burnyeat | 1,507 | 55.8 | +19.7 | |
Conservative | J. Robertson-Walker | 1,194 | 44.2 | −19.7 | |
Majority | 313 | 11.6 | N/A | ||
Turnout | 2,701 | 91.7 | +5.7 | ||
Registered electors | 2,945 | ||||
Liberal gain from Conservative | Swing | +19.7 |
Party | Candidate | Votes | % | ±% | |
---|---|---|---|---|---|
Conservative | John Jackson | 1,188 | 41.5 | −2.7 | |
Liberal | William Hood Wandless | 852 | 29.7 | −26.1 | |
Labour | Andrew Sharp | 825 | 28.8 | New | |
Majority | 336 | 11.8 | N/A | ||
Turnout | 2,865 | 83.9 | +2.2 | ||
Registered electors | 3,050 | ||||
Conservative gain from Liberal | Swing | +11.7 |
Party | Candidate | Votes | % | ±% | |
---|---|---|---|---|---|
Labour | Thomas Richardson | 1,414 | 53.7 | +24.9 | |
Conservative | John Jackson | 1,220 | 46.3 | +4.8 | |
Majority | 194 | 7.4 | N/A | ||
Turnout | 2,634 | 86.4 | −7.5 | ||
Registered electors | 3,050 | ||||
Labour gain from Conservative | Swing | +10.1 |
Party | Candidate | Votes | % | ±% | |
---|---|---|---|---|---|
C | Unionist | James Grant | 10,736 | 54.4 | +8.1 |
Labour | Thomas Gavan-Duffy | 9,016 | 45.6 | −8.1 | |
Majority | 1,720 | 8.8 | N/A | ||
Turnout | 19,752 | 72.0 | −14.4 | ||
Unionist gain from Labour | Swing | +8.1 | |||
Cindicates candidate endorsed by the coalition government. |
Party | Candidate | Votes | % | ±% | |
---|---|---|---|---|---|
Labour | Thomas Gavan-Duffy | 10,935 | 45.3 | −0.3 | |
Unionist | James Grant | 8,956 | 37.2 | −17.2 | |
Liberal | Henry Kenyon Campbell | 4,209 | 17.5 | New | |
Majority | 1,979 | 8.1 | N/A | ||
Turnout | 24,100 | 87.0 | +15.0 | ||
Labour gain from Unionist | Swing | +8.4 |
Party | Candidate | Votes | % | ±% | |
---|---|---|---|---|---|
Labour | Thomas Gavan-Duffy | 12,419 | 53.0 | +7.7 | |
Unionist | Robert Hudson | 11,029 | 47.0 | +9.8 | |
Majority | 1,390 | 6.0 | −2.1 | ||
Turnout | 23,448 | 83.1 | −3.9 | ||
Labour hold | Swing | -1.0 |
Party | Candidate | Votes | % | ±% | |
---|---|---|---|---|---|
Unionist | Robert Hudson | 13,149 | 52.8 | +5.8 | |
Labour | Thomas Gavan-Duffy | 11,741 | 47.2 | −5.8 | |
Majority | 1,408 | 5.6 | N/A | ||
Turnout | 24,890 | 88.2 | −0.9 | ||
Unionist gain from Labour | Swing |
Party | Candidate | Votes | % | ±% | |
---|---|---|---|---|---|
Labour | M. Philips Price | 14,034 | 46.8 | −0.4 | |
Unionist | Robert Hudson | 12,382 | 41.3 | −11.5 | |
Liberal | Henry Naylor | 3,558 | 11.9 | New | |
Majority | 1,652 | 5.5 | N/A | ||
Turnout | 29,974 | 88.1 | −0.1 | ||
Labour gain from Unionist | Swing |
Party | Candidate | Votes | % | ±% | |
---|---|---|---|---|---|
Conservative | William Nunn | 16,286 | 53.3 | +12.0 | |
Labour | M. Philips Price | 14,255 | 46.7 | −0.1 | |
Majority | 2,031 | 6.6 | N/A | ||
Turnout | 30,541 | 89.6 | +1.5 | ||
Conservative gain from Labour | Swing |
Party | Candidate | Votes | % | ±% | |
---|---|---|---|---|---|
Labour | Frank Anderson | 14,794 | 48.9 | +2.2 | |
Conservative | William Nunn | 14,442 | 47.8 | −5.5 | |
Ind. Labour Party | Tom Stephenson | 1,004 | 3.3 | New | |
Majority | 352 | 1.1 | N/A | ||
Turnout | 30,240 | 87.3 | −2.3 | ||
Labour gain from Conservative | Swing |
Party | Candidate | Votes | % | ±% | |
---|---|---|---|---|---|
Labour | Frank Anderson | 18,568 | 61.1 | +12.2 | |
Conservative | W.O. Hill | 11,821 | 38.9 | −8.9 | |
Majority | 6,747 | 22.2 | +21.1 | ||
Turnout | 30,389 | 82.8 | −4.5 | ||
Labour hold | Swing |
Party | Candidate | Votes | % | ±% | |
---|---|---|---|---|---|
Labour | Frank Anderson | 22,850 | 60.00 | ||
Conservative | William Nunn | 15,233 | 40.00 | ||
Majority | 7,617 | 20.00 | |||
Turnout | 38,083 | 87.04 | |||
Labour hold | Swing |
Party | Candidate | Votes | % | ±% | |
---|---|---|---|---|---|
Labour | Frank Anderson | 23,190 | 59.19 | ||
Conservative | Godfrey William Iredell | 15,990 | 40.81 | ||
Majority | 7,200 | 18.38 | |||
Turnout | 39,180 | 85.24 | |||
Labour hold | Swing |
Party | Candidate | Votes | % | ±% | |
---|---|---|---|---|---|
Labour | Frank Anderson | 22,348 | 58.04 | ||
Conservative | Godfrey William Iredell | 16,154 | 41.96 | ||
Majority | 6,194 | 16.08 | |||
Turnout | 38,502 | 83.78 | |||
Labour hold | Swing |
Party | Candidate | Votes | % | ±% | |
---|---|---|---|---|---|
Labour | Joseph Symonds | 21,457 | 58.61 | +0.57 | |
Conservative | Godfrey William Iredell | 15,151 | 41.39 | −0.57 | |
Majority | 6,306 | 17.22 | +1.14 | ||
Turnout | 36,608 | ||||
Labour hold | Swing |
Party | Candidate | Votes | % | ±% | |
---|---|---|---|---|---|
Labour | Joseph Symonds | 22,783 | 57.77 | ||
Conservative | Howard Jardine Pedraza | 16,653 | 42.23 | ||
Majority | 6,130 | 15.54 | |||
Turnout | 39,436 | 84.54 | |||
Labour hold | Swing |
Party | Candidate | Votes | % | ±% | |
---|---|---|---|---|---|
Labour | Joseph Symonds | 23,267 | 60.11 | ||
Conservative | Edmund Brudenell | 15,440 | 39.89 | ||
Majority | 7,827 | 20.22 | |||
Turnout | 38,707 | 82.02 | |||
Labour hold | Swing |
Party | Candidate | Votes | % | ±% | |
---|---|---|---|---|---|
Labour | Joseph Symonds | 22,726 | 61.99 | ||
Conservative | John A Kevill | 13,935 | 38.01 | ||
Majority | 8,791 | 23.98 | |||
Turnout | 36,661 | 78.79 | |||
Labour hold | Swing |
Party | Candidate | Votes | % | ±% | |
---|---|---|---|---|---|
Labour | Jack Cunningham | 22,974 | 58.32 | ||
Conservative | W Graham McKay | 16,418 | 41.68 | ||
Majority | 6,556 | 16.64 | |||
Turnout | 39,392 | 78.27 | |||
Labour hold | Swing |
Party | Candidate | Votes | % | ±% | |
---|---|---|---|---|---|
Labour | Jack Cunningham | 23,229 | 59.42 | ||
Conservative | P.B. Vose | 15,867 | 40.58 | ||
Majority | 7,362 | 18.84 | |||
Turnout | 39,096 | 77.50 | |||
Labour hold | Swing |
Party | Candidate | Votes | % | ±% | |
---|---|---|---|---|---|
Labour | Jack Cunningham | 21,832 | 55.56 | ||
Conservative | P.B. Vose | 11,899 | 30.28 | ||
Liberal | M. Gilbert | 5,563 | 14.16 | New | |
Majority | 9,933 | 25.28 | |||
Turnout | 39,294 | 77.10 | |||
Labour hold | Swing |
Party | Candidate | Votes | % | ±% | |
---|---|---|---|---|---|
Labour | Jack Cunningham | 22,626 | 52.44 | ||
Conservative | John Somers | 17,171 | 39.80 | ||
Liberal | E. Akister | 2,559 | 5.93 | ||
Independent | W. Dixon | 790 | 1.83 | New | |
Majority | 5,455 | 12.64 | |||
Turnout | 43,146 | 81.74 | |||
Labour hold | Swing |
Edinburgh and St Andrews Universities was a university constituency represented in the House of Commons of the Parliament of the United Kingdom from 1868 until 1918. It was merged with the Glasgow and Aberdeen Universities constituency to form the Combined Scottish Universities constituency.
Glasgow and Aberdeen Universities, in Scotland, was a university constituency represented in the House of Commons of the Parliament of the United Kingdom from 1868 until 1918. It was merged with the Edinburgh and St Andrews Universities constituency to form the Combined Scottish Universities constituency.
Dunbartonshire was a county constituency of the House of Commons of Great Britain from 1708 to 1801 and of the House of Commons of the Parliament of the United Kingdom from 1801 to 1950.
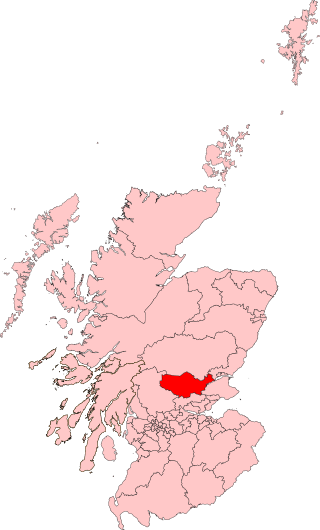
Perth was a constituency of the House of Commons of the Parliament of the United Kingdom from 1832 to 1918, 1918 to 1950, and 1997 to 2005. From 1832 to 1918 it was a burgh constituency. From 1918 to 1950, and 1997 to 2005, it was a county constituency. During each of the three periods it elected one Member of Parliament (MP).
Warrington was a parliamentary constituency in the United Kingdom. From 1832 to 1983 it returned one Member of Parliament (MP) to the House of Commons of the Parliament of the United Kingdom.
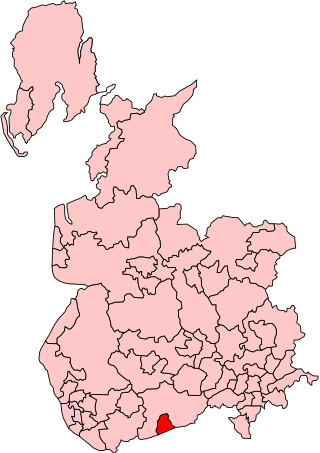
Petersfield was an English Parliamentary constituency centred on the town of Petersfield in Hampshire. It existed for several hundred years until its abolition for the 1983 general election.
Salford North was a parliamentary constituency in the City of Salford in Greater Manchester from 1885 until 1950. It returned one Member of Parliament (MP) to the House of Commons of the Parliament of the United Kingdom.
Salford West was a parliamentary constituency in the City of Salford in Greater Manchester from 1885 until 1983. It returned one Member of Parliament (MP) to the House of Commons of the Parliament of the United Kingdom.
Leek was a parliamentary constituency in Staffordshire which returned one Member of Parliament (MP) to the House of Commons of the Parliament of the United Kingdom.
Hythe was a constituency centred on the town of Hythe in Kent. It returned two Members of Parliament to the House of Commons until 1832, when its representation was reduced to one member. The constituency was abolished for the 1950 general election, and replaced with the new Folkestone and Hythe constituency.
Hackney Central was a borough constituency in what was then the Metropolitan Borough of Hackney, in London. It returned one Member of Parliament (MP) to the House of Commons of the Parliament of the United Kingdom.
Kingston or Kingston-upon-Thames was a parliamentary constituency which covered the emerging southwest, outer London suburb of Kingston upon Thames and which existed between 1885 and 1997 and returned one Member of Parliament (MP) to the House of Commons of the UK Parliament. The Conservative candidate won each election during its 112-year existence.
Skipton was a county constituency centred on the town of Skipton in Yorkshire which returned one Member of Parliament (MP) to the House of Commons of the Parliament of the United Kingdom.
Chatham was a parliamentary constituency in Kent which returned one Member of Parliament (MP) to the House of Commons of the Parliament of the United Kingdom. It was created for the 1832 general election, when the borough of Chatham was enfranchised under the Reform Act 1832.
Holderness was a parliamentary constituency centred on the Holderness area of the East Riding of Yorkshire. It returned one Member of Parliament (MP) to the House of Commons of the Parliament of the United Kingdom.
Woodbridge was a county constituency centred on the town of Woodbridge in Suffolk. It returned one Member of Parliament (MP) to the House of Commons of the Parliament of the United Kingdom.
Bury was a borough constituency centred on the town of Bury in Lancashire. It returned one Member of Parliament (MP) to the House of Commons of the Parliament of the United Kingdom.
Southampton was a parliamentary constituency which was represented in the English and after 1707 British House of Commons. Centred on the town of Southampton, it returned two members of parliament (MPs) from 1295 until it was abolished for the 1950 general election.
East Worcestershire was a county constituency in the county of Worcestershire, represented in the House of Commons of the Parliament of the United Kingdom.
Winston Churchill, who served in a multitude of ministerial positions between 1908 and 1952, including as Prime Minister of the United Kingdom from 1940 to 1945 and again from 1951 to 1955, and as a Member of Parliament (MP) for five different constituencies between 1900 and 1964, except for a break in 1922–24.