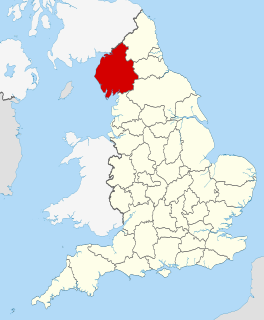
The 2011 Allerdale Borough Council election took place on 5 May 2011 to elect members of Allerdale Borough Council in Cumbria, England. The whole council was up for election and the council stayed under no overall control. [1]
Allerdale is a non-metropolitan district of Cumbria, England, with borough status. Its council is based in Workington and the borough has a population of 93,492 according to the 2001 census, increasing to 96,422 at the 2011 Census.
Borough status in the United Kingdom is granted by royal charter to local government districts in England, Wales and Northern Ireland. The status is purely honorary, and does not give any additional powers to the council or inhabitants of the district. In Scotland, similarly chartered communities were known as royal burghs, although the status is no longer granted.
Cumbria is a ceremonial and non-metropolitan county in North West England. The county and Cumbria County Council, its local government, came into existence in 1974 after the passage of the Local Government Act 1972. Cumbria's county town is Carlisle, in the north of the county, and the only other major urban area is Barrow-in-Furness on the southwestern tip of the county.
The results saw the Labour party make 6 gains to win exactly half of the 56 seats on the council, 1 short of a majority. [2] Labour gains included the former leader of the council, Mark Fryer, who took Stainburn ward from the Conservatives by 2 votes. [2] The Conservatives lost 5 seats to have 12 councillors, including losses in All Saints Cockermouth and Broughton St Bridgets. [2] 16 independents were elected, including gains in Broughton St Bridgets and Netherhall Maryport. [2] No other party won any seats on council, with the Liberal Democrats losing 2 seats in Harrington Workington as the party was wiped out. [2] Overall turnout for the election was 46.19%. [3]
The Labour Party is a centre-left political party in the United Kingdom which has been described as an alliance of social democrats, democratic socialists and trade unionists. The party's platform emphasises greater state intervention, social justice and strengthening workers' rights.
The Conservative Party, officially the Conservative and Unionist Party, is a centre-right political party in the United Kingdom. Presently led by Theresa May, it has been the governing party since 2010. It presently has 314 Members of Parliament in the House of Commons, 249 members of the House of Lords, and 18 members of the European Parliament. It also has 31 Members of the Scottish Parliament, 12 members of the Welsh Assembly, eight members of the London Assembly and 9,008 local councillors. One of the major parties of UK politics, it has formed the government on 45 occasions, more than any other party.
A Councillor is a member of a local government council.
Following the election Labour said it intended to take control of the council as a minority administration replacing the previous alliance between the Conservatives, Liberal Democrats and 7 independents. [3]
Party | Seats | Gains | Losses | Net gain/loss | Seats % | Votes % | Votes | +/− | |
---|---|---|---|---|---|---|---|---|---|
Labour | 28 | 8 | 2 | +6 | 50.0 | 52.3 | 25,637 | +7.0% | |
Independent | 16 | 6 | 2 | +4 | 28.6 | 22.2 | 10,856 | -3.3% | |
Conservative | 12 | 0 | 6 | -6 | 21.4 | 19.2 | 9,406 | -1.9% | |
Liberal Democrat | 0 | 0 | 4 | -4 | 0 | 2.5 | 1,213 | -1.6% | |
Green | 0 | 0 | 0 | 0 | 0 | 2.0 | 985 | +0.9% | |
BNP | 0 | 0 | 0 | 0 | 0 | 1.8 | 893 | -1.1% |
3 Conservative, 3 independent and 1 Labour candidates were unopposed.
Party | Candidate | Votes | % | ± | |
---|---|---|---|---|---|
Labour | Alan Smith | 1,062 | |||
Labour | Len Davies | 884 | |||
Labour | Christine Smith | 848 | |||
Conservative | Alan Tyson | 751 | |||
Conservative | Hilary Hope | 719 | |||
Conservative | Kenneth Scales | 663 | |||
Liberal Democrat | Juliet Henderson | 258 | |||
Turnout | 5,185 | 52.5 | +3 | ||
Labour hold | Swing | ||||
Labour gain from Conservative | Swing | ||||
Party | Candidate | Votes | % | ± | |
---|---|---|---|---|---|
Independent | Bill Finlay | 401 | |||
Independent | David Wilson | 361 | |||
Labour | Laurie Mansfield | 344 | |||
Liberal Democrat | Philip Roberts | 253 | |||
Labour | Billy Pegram | 216 | |||
Turnout | 1,575 | 39 | +1 | ||
Independent hold | Swing | ||||
Independent hold | Swing |
Party | Candidate | Votes | % | ± | |
---|---|---|---|---|---|
Independent | Joe Mumberson | 504 | 66.2 | ||
Conservative | Graham Sadler | 257 | 33.8 | ||
Majority | 247 | 32.5 | |||
Turnout | 761 | 53.6 | |||
Independent hold | Swing |
Party | Candidate | Votes | % | ± | |
---|---|---|---|---|---|
Independent | Nicky Cockburn | 715 | |||
Independent | Tony North | 675 | |||
Labour | John Ardron | 648 | |||
Labour | Brian Campbell | 578 | |||
Turnout | 2,616 | 51.2 | +4 | ||
Independent gain from Conservative | Swing | ||||
Independent gain from Labour | Swing | ||||
Party | Candidate | Votes | % | ± | |
---|---|---|---|---|---|
Conservative | Margaret Jackson | 639 | |||
Conservative | Sam Standage | 583 | |||
Labour | Julie Laidlow | 550 | |||
Labour | Andrew Graham | 543 | |||
Liberal Democrat | Eleanor Snowden | 165 | |||
Green | Michael Baron | 162 | |||
Turnout | 2,642 | 50.7 | +15 | ||
Conservative hold | Swing | ||||
Conservative hold | Swing |
Party | Candidate | Votes | % | ± | |
---|---|---|---|---|---|
Labour | Phillip Tibble | 364 | 64.9 | +16.5 | |
Independent | Heather McIntosh | 197 | 35.1 | +35.1 | |
Majority | 167 | 29.8 | |||
Turnout | 561 | 45.5 | -3 | ||
Labour gain from Liberal Democrat | Swing | ||||
Party | Candidate | Votes | % | ± | |
---|---|---|---|---|---|
Conservative | Eric Nicholson | 491 | 63.0 | -5.3 | |
Labour | Ann Bales | 109 | 14.0 | +14.0 | |
Green | Jill Perry | 95 | 12.2 | -19.5 | |
Liberal Democrat | Roger Peck | 84 | 10.8 | +10.8 | |
Majority | 382 | 49.0 | +12.4 | ||
Turnout | 779 | 62.0 | +9 | ||
Conservative hold | Swing |
Party | Candidate | Votes | % | ± | |
---|---|---|---|---|---|
Independent | Chris Garrard | 456 | 63.3 | ||
Labour | Emma Holding | 167 | 23.2 | ||
Green | Flic Crowley | 97 | 13.5 | ||
Majority | 289 | 40.1 | |||
Turnout | 720 | 50.5 | |||
Independent gain from Conservative | Swing | ||||
Party | Candidate | Votes | % | ± | |
---|---|---|---|---|---|
Conservative | Timothy Heslop | 486 | 74.4 | ||
Labour | Peter Cross | 167 | 25.6 | ||
Majority | 319 | 48.9 | |||
Turnout | 653 | 53.2 | |||
Conservative hold | Swing |
Party | Candidate | Votes | % | ± | |
---|---|---|---|---|---|
Labour | John Colhoun | 484 | |||
Labour | Louise Maguire | 391 | |||
Independent | Jeanette Martin | 356 | |||
Conservative | Mike Johnson | 277 | |||
Green | Geoff Smith | 193 | |||
Turnout | 1,701 | 44.0 | +8 | ||
Labour hold | Swing | ||||
Labour hold | Swing |
Party | Candidate | Votes | % | ± | |
---|---|---|---|---|---|
Labour | Janice Wood | 693 | |||
Labour | Martin Wood | 674 | |||
BNP | Dawn Charlton | 308 | |||
Turnout | 1,675 | 38.3 | +3 | ||
Labour hold | Swing | ||||
Labour hold | Swing |
Party | Candidate | Votes | % | ± | |
---|---|---|---|---|---|
Labour | Carni McCarron-Holmes | 679 | |||
Labour | Ashley Moore | 604 | |||
Maryport 4 Maryport Independent | Mark Hayhurst | 182 | |||
BNP | Jennifer Matthys | 136 | |||
Turnout | 1,601 | 38.7 | +2 | ||
Labour hold | Swing | ||||
Labour hold | Swing |
Party | Candidate | Votes | % | ± | |
---|---|---|---|---|---|
Labour | Peter Kendall | 342 | 71.1 | ||
Conservative | Fiona Buchanan | 83 | 17.3 | ||
BNP | David Wilson | 56 | 11.6 | ||
Majority | 259 | 53.8 | |||
Turnout | 481 | 39.1 | |||
Labour hold | Swing |
Party | Candidate | Votes | % | ± | |
---|---|---|---|---|---|
Labour | Marjorie Rae | 642 | |||
Independent | Hilary Harrington | 412 | |||
Liberal Democrat | Ian Francis | 382 | |||
Labour | Jim Osborn | 345 | |||
Turnout | 1,781 | 45.1 | +5 | ||
Labour gain from Liberal Democrat | Swing | ||||
Independent gain from Liberal Democrat | Swing | ||||
Party | Candidate | Votes | % | ± | |
---|---|---|---|---|---|
Conservative | Tony Markley | unopposed | |||
Conservative hold | Swing |
Party | Candidate | Votes | % | ± | |
---|---|---|---|---|---|
Labour | Denstone Kemp | unopposed | |||
Conservative | Ron Munby | unopposed | |||
Independent | David Robinson | unopposed | |||
Labour hold | Swing | ||||
Conservative hold | Swing | ||||
Independent gain from Liberal Democrat | Swing | ||||
Party | Candidate | Votes | % | ± | |
---|---|---|---|---|---|
Conservative | Derick Hodgson | unopposed | |||
Conservative hold | Swing |
Party | Candidate | Votes | % | ± | |
---|---|---|---|---|---|
Labour | Peter Bales | 719 | |||
Labour | Joan Wright | 629 | |||
Independent | Denis Robertson | 608 | |||
Independent | Stephen Stoddart | 526 | |||
Labour | Neil Schofield | 511 | |||
Turnout | 2,993 | 42.7 | -12 | ||
Labour hold | Swing | ||||
Independent hold | Swing |
Party | Candidate | Votes | % | ± | |
---|---|---|---|---|---|
Labour | Barbara Cannon | 620 | |||
Labour | Carole Armstrong | 596 | |||
Labour | Bill Bacon | 572 | |||
Independent | John Bracken | 395 | |||
Turnout | 2,183 | 34.5 | +8 | ||
Labour hold | Swing | ||||
Labour hold | Swing |
Party | Candidate | Votes | % | ± | |
---|---|---|---|---|---|
Independent | George Kemp | 483 | |||
Labour | Angela Kendall | 422 | |||
Labour | Jeff Gardner | 387 | |||
Independent | Andy Long | 273 | |||
Green | Diane Standen | 88 | |||
BNP | Angus Matthys | 76 | |||
Turnout | 1,729 | 44.2 | |||
Independent gain from Labour | Swing | ||||
Labour hold | Swing |
Party | Candidate | Votes | % | ± | |
---|---|---|---|---|---|
Independent | Trevor Fee | 1,055 | |||
Labour | Celia Tibble | 779 | |||
Independent | Mirriam Gainford | 641 | |||
Labour | Andrew Lawson | 586 | |||
Green | Alistair Grey | 304 | |||
Turnout | 3,365 | 43.2 | +3 | ||
Independent hold | Swing | ||||
Labour gain from Independent | Swing | ||||
Independent hold | Swing |
Party | Candidate | Votes | % | ± | |
---|---|---|---|---|---|
Independent | Bill Jefferson | unopposed | |||
Independent | Margaret Snaith | unopposed | |||
Independent hold | Swing | ||||
Independent hold | Swing |
Party | Candidate | Votes | % | ± | |
---|---|---|---|---|---|
Conservative | Jim Lister | 365 | 61.3 | ||
Labour | Marcus Cosgrove | 230 | 38.7 | ||
Majority | 135 | 22.7 | |||
Turnout | 595 | 46 | |||
Conservative hold | Swing |
Party | Candidate | Votes | % | ± | |
---|---|---|---|---|---|
Labour | Joe Holliday | 1,156 | |||
Labour | Michael Heaslip | 1,019 | |||
Labour | Konrad Hansen | 942 | |||
Conservative | Michael Davidson | 589 | |||
Conservative | Simon Collins | 542 | |||
BNP | Carl Edgar | 122 | |||
Turnout | 4,370 | 56.6 | +20 | ||
Labour hold | Swing | ||||
Labour gain from Conservative | Swing | ||||
Party | Candidate | Votes | % | ± | |
---|---|---|---|---|---|
Labour | Mary Bainbridge | 935 | |||
Labour | Billy Miskelly | 741 | |||
Labour | Carl Holding | 690 | |||
Independent | Elsie Johnsen | 682 | |||
Independent | Grahame Hayton | 444 | |||
Turnout | 3,492 | 41.9 | +18 | ||
Labour hold | Swing | ||||
Labour gain from Independent | Swing | ||||
Party | Candidate | Votes | % | ± | |
---|---|---|---|---|---|
Labour | Mark Fryer | 301 | 47.6 | +22.8 | |
Conservative | Robert Hardon | 299 | 47.2 | -10.4 | |
Liberal Democrat | Margaret Bennett | 33 | 5.2 | -12.4 | |
Majority | 2 | 0.3 | |||
Turnout | 633 | 45.8 | +11 | ||
Labour gain from Conservative | Swing | ||||
Party | Candidate | Votes | % | ± | |
---|---|---|---|---|---|
Conservative | Stuart Moffat | 472 | 75.2 | ||
Labour | Nathan Wilson | 156 | 24.8 | ||
Majority | 316 | 50.3 | |||
Turnout | 628 | 46.6 | |||
Conservative hold | Swing |
Party | Candidate | Votes | % | ± | |
---|---|---|---|---|---|
Conservative | Duncan Fairbairn | 679 | 75.8 | ||
Labour | Eric Wright | 217 | 24.2 | ||
Majority | 462 | 51.6 | |||
Turnout | 896 | 57.4 | |||
Conservative hold | Swing |
Party | Candidate | Votes | % | ± | |
---|---|---|---|---|---|
Conservative | Joe Cowell | 421 | 69.2 | ||
Labour | Lynda Stephenson | 187 | 30.8 | ||
Majority | 234 | 38.5 | |||
Turnout | 608 | 41.9 | |||
Conservative hold | Swing |
Party | Candidate | Votes | % | ± | |
---|---|---|---|---|---|
Conservative | Jacqueline Mounsey | 376 | 56.5 | ||
Labour | Brian Cope | 205 | 30.8 | ||
Green | Helen Graham | 46 | 6.9 | ||
Liberal Democrat | Magrit Scott | 38 | 5.7 | ||
Majority | 171 | 25.7 | |||
Turnout | 665 | 53.2 | |||
Conservative hold | Swing |
Party | Candidate | Votes | % | ± | |
---|---|---|---|---|---|
Labour | John Crouch | 843 | |||
Independent | George Scott | 756 | |||
Independent | Binky Armstrong | 734 | |||
Conservative | Brian Warren | 714 | |||
Labour | Sheelagh Delaney | 458 | |||
Labour | Bill Goldsmith | 402 | |||
BNP | Paul Stafford | 195 | |||
Turnout | 4,102 | 39.9 | +6 | ||
Labour hold | Swing | ||||
Independent hold | Swing | ||||
Independent hold | Swing |
Elections to Broxtowe Borough Council were held on 5 May 2011 to elect all 44 members to the Council.
The 1998 Pendle Borough Council election took place on 7 May 1998 to elect members of Pendle Borough Council in Lancashire, England. One third of the council was up for election and the Liberal Democrats stayed in overall control of the council.
The 1999 Pendle Borough Council election took place on 6 May 1999 to elect members of Pendle Borough Council in Lancashire, England. One third of the council was up for election and the Liberal Democrats lost overall control of the council to no overall control.
The 2007 Pendle Borough Council election took place on 3 May 2007 to elect members of Pendle Borough Council in Lancashire, England. One third of the council was up for election and the Liberal Democrats stayed in overall control of the council.
The 2010 Pendle Borough Council election took place on 6 May 2010 to elect members of Pendle Borough Council in Lancashire, England. One third of the council was up for election and the council stayed under no overall control.
The 2000 Sandwell Metropolitan Borough Council election took place on 4 May 2000 to elect members of Sandwell Metropolitan Borough Council in the West Midlands, England. One third of the council was up for election and the Labour party stayed in overall control of the council.
The 2006 Maidstone Borough Council election took place on 4 May 2006 to elect members of Maidstone Borough Council in Kent, England. One third of the council was up for election and the council stayed under no overall control.
The 2008 Maidstone Borough Council election took place on 1 May 2008 to elect members of Maidstone Borough Council in Kent, England. One third of the council was up for election and the Conservative party gained overall control of the council from no overall control.
The 2002 Basingstoke and Deane Council election took place on 2 May 2002 to elect members of Basingstoke and Deane Borough Council in Hampshire, England. The whole council was up for election with boundary changes since the last election in 2000 increasing the number of seats by 3. The council stayed under no overall control.
The 2006 Basingstoke and Deane Council election took place on 4 May 2006 to elect members of Basingstoke and Deane Borough Council in Hampshire, England. One third of the council was up for election and the council stayed under no overall control.
The 2007 Basingstoke and Deane Council election took place on 3 May 2007 to elect members of Basingstoke and Deane Borough Council in Hampshire, England. One third of the council was up for election and the Conservative party stayed in overall control of the council.
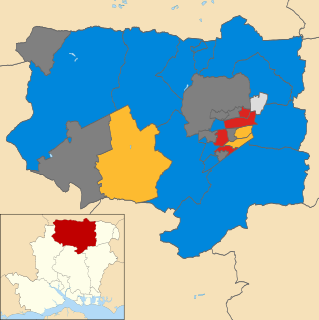
The 2011 Basingstoke and Deane Council election took place on 5 May 2011 to elect members of Basingstoke and Deane Borough Council in Hampshire, England. One third of the council was up for election and the Conservative party stayed in overall control of the council.
The 2011 Gedling Borough Council election took place on 5 May 2011 to elect members of Gedling Borough Council in Nottinghamshire, England. The whole council was up for election and the Labour party gained overall control of the council from the Conservative party.
The 2007 Walsall Metropolitan Borough Council election took place on 3 May 2007 to elect members of Walsall Metropolitan Borough Council in the West Midlands, England. One third of the council was up for election and the Conservative party stayed in overall control of the council.
The 2002 Hertsmere Borough Council election took place on 2 May 2002 to elect members of Hertsmere Borough Council in Hertfordshire, England. One third of the council was up for election and the Conservative party stayed in overall control of the council.
The 2007 Hertsmere Borough Council election took place on 3 May 2007 to elect members of Hertsmere Borough Council in Hertfordshire, England. One third of the council was up for election and the Conservative party stayed in overall control of the council.
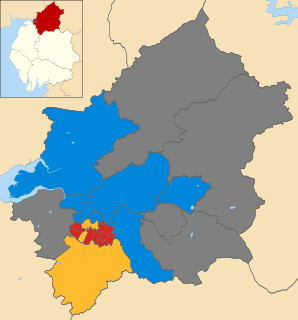
The 2006 Carlisle City Council election took place on 4 May 2006 to elect members of Carlisle District Council in Cumbria, England. One third of the council was up for election and the council stayed under no overall control.
The 2007 Carlisle City Council election took place on 3 May 2007 to elect members of Carlisle District Council in Cumbria, England. One third of the council was up for election and the council stayed under no overall control.
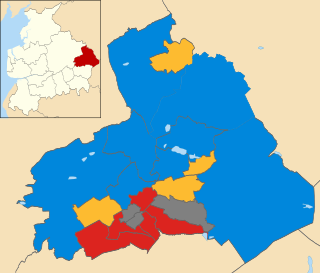
The 2011 Pendle Borough Council election took place on 5 May 2011 to elect members of Pendle Borough Council in Lancashire, England. One third of the council was up for election and the council stayed under no overall control.
The 2011 St Helens Metropolitan Borough Council election took place on 5 May 2011 to elect members of St Helens Metropolitan Borough Council in Merseyside, England. One third of the council was up for election and the Labour party stayed in overall control of the council.