In thermodynamics, the compressibility factor (Z), also known as the compression factor or the gas deviation factor, describes the deviation of a real gas from ideal gas behaviour. It is simply defined as the ratio of the molar volume of a gas to the molar volume of an ideal gas at the same temperature and pressure. It is a useful thermodynamic property for modifying the ideal gas law to account for the real gas behaviour.[1] In general, deviation from ideal behaviour becomes more significant the closer a gas is to a phase change, the lower the temperature or the larger the pressure. Compressibility factor values are usually obtained by calculation from equations of state (EOS), such as the virial equation which take compound-specific empirical constants as input. For a gas that is a mixture of two or more pure gases (air or natural gas, for example), the gas composition must be known before compressibility can be calculated. Alternatively, the compressibility factor for specific gases can be read from generalized compressibility charts[1] that plot as a function of pressure at constant temperature.
For an ideal gas the compressibility factor is per definition. In many real world applications requirements for accuracy demand that deviations from ideal gas behaviour, i.e., real gas behaviour, be taken into account. The value of generally increases with pressure and decreases with temperature. At high pressures molecules are colliding more often. This allows repulsive forces between molecules to have a noticeable effect, making the molar volume of the real gas () greater than the molar volume of the corresponding ideal gas (), which causes to exceed one.[3] When pressures are lower, the molecules are free to move. In this case attractive forces dominate, making . The closer the gas is to its critical point or its boiling point, the more deviates from the ideal case.
Generalized compressibility factor graphs for pure gases
Generalized compressibility factor diagram.
The unique relationship between the compressibility factor and the reduced temperature, , and the reduced pressure, , was first recognized by Johannes Diderik van der Waals in 1873 and is known as the two-parameter principle of corresponding states. The principle of corresponding states expresses the generalization that the properties of a gas which are dependent on intermolecular forces are related to the critical properties of the gas in a universal way. That provides a most important basis for developing correlations of molecular properties.
As for the compressibility of gases, the principle of corresponding states indicates that any pure gas at the same reduced temperature, , and reduced pressure, , should have the same compressibility factor.
The reduced temperature and pressure are defined by
and
Here and are known as the critical temperature and critical pressure of a gas. They are characteristics of each specific gas with being the temperature above which it is not possible to liquify a given gas and is the minimum pressure required to liquify a given gas at its critical temperature. Together they define the critical point of a fluid above which distinct liquid and gas phases of a given fluid do not exist.
The pressure-volume-temperature (PVT) data for real gases varies from one pure gas to another. However, when the compressibility factors of various single-component gases are graphed versus pressure along with temperature isotherms many of the graphs exhibit similar isotherm shapes.
In order to obtain a generalized graph that can be used for many different gases, the reduced pressure and temperature, and , are used to normalize the compressibility factor data. Figure 2 is an example of a generalized compressibility factor graph derived from hundreds of experimental PVT data points of 10 pure gases, namely methane, ethane, ethylene, propane, n-butane, i-pentane, n-hexane, nitrogen, carbon dioxide and steam.
There are more detailed generalized compressibility factor graphs based on as many as 25 or more different pure gases, such as the Nelson-Obert graphs. Such graphs are said to have an accuracy within 1–2 percent for values greater than 0.6 and within 4–6 percent for values of 0.3–0.6.
The generalized compressibility factor graphs may be considerably in error for strongly polar gases which are gases for which the centers of positive and negative charge do not coincide. In such cases the estimate for may be in error by as much as 15–20 percent.
The quantum gases hydrogen, helium, and neon do not conform to the corresponding-states behavior. Rao recommended that the reduced pressure and temperature for those three gases should be redefined in the following manner to improve the accuracy of predicting their compressibility factors when using the generalized graphs:
and
where the temperatures are in kelvins and the pressures are in atmospheres.[4]
Reading a generalized compressibility chart
In order to read a compressibility chart, the reduced pressure and temperature must be known. If either the reduced pressure or temperature is unknown, the reduced specific volume must be found. Unlike the reduced pressure and temperature, the reduced specific volume is not found by using the critical volume. The reduced specific volume is defined by,
Once two of the three reduced properties are found, the compressibility chart can be used. In a compressibility chart, reduced pressure is on the x-axis and Z is on the y-axis. When given the reduced pressure and temperature, find the given pressure on the x-axis. From there, move up on the chart until the given reduced temperature is found. Z is found by looking where those two points intersect. the same process can be followed if reduced specific volume is given with either reduced pressure or temperature.
Observations made from a generalized compressibility chart
There are three observations that can be made when looking at a generalized compressibility chart. These observations are:
Gases behave as an ideal gas regardless of temperature when the reduced pressure is much less than one (PR ≪ 1).
When reduced temperature is greater than two (TR > 2), ideal-gas behavior can be assumed regardless of pressure, unless pressure is much greater than one (PR ≫ 1).
Gases deviate from ideal-gas behavior the most in the vicinity of the critical point.[6]
Theoretical models
The virial equation is especially useful to describe the causes of non-ideality at a molecular level (very few gases are mono-atomic) as it is derived directly from statistical mechanics:
Where the coefficients in the numerator are known as virial coefficients and are functions of temperature.
The virial coefficients account for interactions between successively larger groups of molecules. For example, accounts for interactions between pairs, for interactions between three gas molecules, and so on. Because interactions between large numbers of molecules are rare, the virial equation is usually truncated after the third term.[7]
When this truncation is assumed, the compressibility factor is linked to the intermolecular-force potential φ by:
The Real gas article features more theoretical methods to compute compressibility factors.
Physical mechanism of temperature and pressure dependence
Deviations of the compressibility factor, Z, from unity are due to attractive and repulsive intermolecular forces. At a given temperature and pressure, repulsive forces tend to make the volume larger than for an ideal gas; when these forces dominate Z is greater than unity. When attractive forces dominate, Z is less than unity. The relative importance of attractive forces decreases as temperature increases (see effect on gases).
As seen above, the behavior of Z is qualitatively similar for all gases. Molecular nitrogen, N2, is used here to further describe and understand that behavior. All data used in this section were obtained from the NIST Chemistry WebBook.[8] It is useful to note that for N2 the normal boiling point of the liquid is 77.4 K and the critical point is at 126.2 K and 34.0 bar.
Overview of the temperature and pressure dependence of the compressibility factor for N2.
The figure on the right shows an overview covering a wide temperature range. At low temperature (100 K), the curve has a characteristic check-mark shape, the rising portion of the curve is very nearly directly proportional to pressure. At intermediate temperature (160 K), there is a smooth curve with a broad minimum; although the high pressure portion is again nearly linear, it is no longer directly proportional to pressure. Finally, at high temperature (400 K), Z is above unity at all pressures. For all curves, Z approaches the ideal gas value of unity at low pressure and exceeds that value at very high pressure.
The pressure dependence of the compressibility factor for N2 at low temperatures. The dashed line shows the gas-liquid coexistence curve.
To better understand these curves, a closer look at the behavior for low temperature and pressure is given in the second figure. All of the curves start out with Z equal to unity at zero pressure and Z initially decreases as pressure increases. N2 is a gas under these conditions, so the distance between molecules is large, but becomes smaller as pressure increases. This increases the attractive interactions between molecules, pulling the molecules closer together and causing the volume to be less than for an ideal gas at the same temperature and pressure. Higher temperature reduces the effect of the attractive interactions and the gas behaves in a more nearly ideal manner.
As the pressure increases, the gas eventually reaches the gas-liquid coexistence curve, shown by the dashed line in the figure. When that happens, the attractive interactions have become strong enough to overcome the tendency of thermal motion to cause the molecules to spread out; so the gas condenses to form a liquid. Points on the vertical portions of the curves correspond to N2 being partly gas and partly liquid. On the coexistence curve, there are then two possible values for Z, a larger one corresponding to the gas and a smaller value corresponding to the liquid. Once all the gas has been converted to liquid, the volume decreases only slightly with further increases in pressure; then Z is very nearly proportional to pressure.
As temperature and pressure increase along the coexistence curve, the gas becomes more like a liquid and the liquid becomes more like a gas. At the critical point, the two are the same. So for temperatures above the critical temperature (126.2 K), there is no phase transition; as pressure increases the gas gradually transforms into something more like a liquid. Just above the critical point there is a range of pressure for which Z drops quite rapidly (see the 130 K curve), but at higher temperatures the process is entirely gradual.
The pressure dependence of the compressibility factor for N2 at high temperatures, compared with that for an ideal gas.
The final figures shows the behavior at temperatures well above the critical temperatures. The repulsive interactions are essentially unaffected by temperature, but the attractive interaction have less and less influence. Thus, at sufficiently high temperature, the repulsive interactions dominate at all pressures.
This can be seen in the graph showing the high temperature behavior. As temperature increases, the initial slope becomes less negative, the pressure at which Z is a minimum gets smaller, and the pressure at which repulsive interactions start to dominate, i.e. where Z goes from less than unity to greater than unity, gets smaller. At the Boyle temperature (327 K for N2), the attractive and repulsive effects cancel each other at low pressure. Then Z remains at the ideal gas value of unity up to pressures of several tens of bar. Above the Boyle temperature, the compressibility factor is always greater than unity and increases slowly but steadily as pressure increases.
Experimental values
It is extremely difficult to generalize at what pressures or temperatures the deviation from the ideal gas becomes important. As a rule of thumb, the ideal gas law is reasonably accurate up to a pressure of about 2 atm, and even higher for small non-associating molecules. For example, methyl chloride, a highly polar molecule and therefore with significant intermolecular forces, the experimental value for the compressibility factor is at a pressure of 10atm and temperature of 100°C.[9] For air (small non-polar molecules) at approximately the same conditions, the compressibility factor is only (see table below for 10 bars, 400 K).
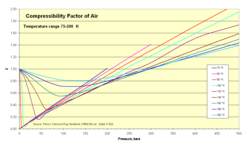
Compressibility of air
Normal air comprises in crude numbers 80 percent nitrogenN 2 and 20 percent oxygenO 2. Both molecules are small and non-polar (and therefore non-associating). We can therefore expect that the behaviour of air within broad temperature and pressure ranges can be approximated as an ideal gas with reasonable accuracy. Experimental values for the compressibility factor confirm this.
Z for air as function of pressure 1–500 bar
75–200K isotherms
250–1000K isotherms
Compressibility factor for air (experimental values)[10]
Temp. (K)
Pressure, absolute (bar)
1
5
10
20
40
60
80
100
150
200
250
300
400
500
75
0.0052
0.0260
0.0519
0.1036
0.2063
0.3082
0.4094
0.5099
0.7581
1.0125
80
0.0250
0.0499
0.0995
0.1981
0.2958
0.3927
0.4887
0.7258
0.9588
1.1931
1.4139
90
0.9764
0.0236
0.0453
0.0940
0.1866
0.2781
0.3686
0.4681
0.6779
0.8929
1.1098
1.3110
1.7161
2.1105
100
0.9797
0.8872
0.0453
0.0900
0.1782
0.2635
0.3498
0.4337
0.6386
0.8377
1.0395
1.2227
1.5937
1.9536
120
0.9880
0.9373
0.8860
0.6730
0.1778
0.2557
0.3371
0.4132
0.5964
0.7720
0.9530
1.1076
1.5091
1.7366
140
0.9927
0.9614
0.9205
0.8297
0.5856
0.3313
0.3737
0.4340
0.5909
0.7699
0.9114
1.0393
1.3202
1.5903
160
0.9951
0.9748
0.9489
0.8954
0.7803
0.6603
0.5696
0.5489
0.6340
0.7564
0.8840
1.0105
1.2585
1.4970
180
0.9967
0.9832
0.9660
0.9314
0.8625
0.7977
0.7432
0.7084
0.7180
0.7986
0.9000
1.0068
1.2232
1.4361
200
0.9978
0.9886
0.9767
0.9539
0.9100
0.8701
0.8374
0.8142
0.8061
0.8549
0.9311
1.0185
1.2054
1.3944
250
0.9992
0.9957
0.9911
0.9822
0.9671
0.9549
0.9463
0.9411
0.9450
0.9713
1.0152
1.0702
1.1990
1.3392
300
0.9999
0.9987
0.9974
0.9950
0.9917
0.9901
0.9903
0.9930
1.0074
1.0326
1.0669
1.1089
1.2073
1.3163
350
1.0000
1.0002
1.0004
1.0014
1.0038
1.0075
1.0121
1.0183
1.0377
1.0635
1.0947
1.1303
1.2116
1.3015
400
1.0002
1.0012
1.0025
1.0046
1.0100
1.0159
1.0229
1.0312
1.0533
1.0795
1.1087
1.1411
1.2117
1.2890
450
1.0003
1.0016
1.0034
1.0063
1.0133
1.0210
1.0287
1.0374
1.0614
1.0913
1.1183
1.1463
1.2090
1.2778
500
1.0003
1.0020
1.0034
1.0074
1.0151
1.0234
1.0323
1.0410
1.0650
1.0913
1.1183
1.1463
1.2051
1.2667
600
1.0004
1.0022
1.0039
1.0081
1.0164
1.0253
1.0340
1.0434
1.0678
1.0920
1.1172
1.1427
1.1947
1.2475
800
1.0004
1.0020
1.0038
1.0077
1.0157
1.0240
1.0321
1.0408
1.0621
1.0844
1.1061
1.1283
1.1720
1.2150
1000
1.0004
1.0018
1.0037
1.0068
1.0142
1.0215
1.0290
1.0365
1.0556
1.0744
1.0948
1.1131
1.1515
1.1889
values are calculated from values of pressure, volume (or density), and temperature in Vasserman, Kazavchinskii, and Rabinovich, "Thermophysical Properties of Air and Air Components;' Moscow, Nauka, 1966, and NBS-NSF Trans. TT 70-50095, 1971: and Vasserman and Rabinovich, "Thermophysical Properties of Liquid Air and Its Component, "Moscow, 1968, and NBS-NSF Trans. 69-55092, 1970.
In physics and chemistry, an equation of state is a thermodynamic equation relating state variables, which describe the state of matter under a given set of physical conditions, such as pressure, volume, temperature, or internal energy. Most modern equations of state are formulated in the Helmholtz free energy. Equations of state are useful in describing the properties of pure substances and mixtures in liquids, gases, and solid states as well as the state of matter in the interior of stars.
An ideal gas is a theoretical gas composed of many randomly moving point particles that are not subject to interparticle interactions. The ideal gas concept is useful because it obeys the ideal gas law, a simplified equation of state, and is amenable to analysis under statistical mechanics. The requirement of zero interaction can often be relaxed if, for example, the interaction is perfectly elastic or regarded as point-like collisions.
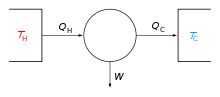
In thermodynamics, the Joule–Thomson effect describes the temperature change of a real gas or liquid when it is expanding; typically caused by the pressure loss from flow through a valve or porous plug while keeping it insulated so that no heat is exchanged with the environment. This procedure is called a throttling process or Joule–Thomson process. The effect is purely an effect due to deviation from ideality, as any ideal gas has no JT effect.
In thermodynamics and fluid mechanics, the compressibility is a measure of the instantaneous relative volume change of a fluid or solid as a response to a pressure change. In its simple form, the compressibility may be expressed as
The van der Waals equation, named for its originator, the Dutch physicist Johannes Diderik van der Waals, is an equation of state that extends the ideal gas law to include the non-zero size of gas molecules and the interactions between them. As a result the equation is able to model the liquid–vapor phase change; it is the first equation that did this, and consequently it had a substantial impact on physics at that time. It also produces simple analytic expressions for the properties of real substances that shed light on their behavior. One way to write this equation is
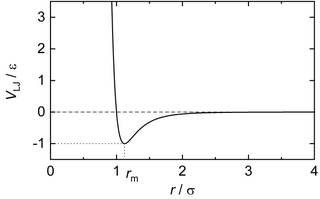
In computational chemistry, molecular physics, and physical chemistry, the Lennard-Jones potential is an intermolecular pair potential. Out of all the intermolecular potentials, the Lennard-Jones potential is probably the one that has been the most extensively studied. It is considered an archetype model for simple yet realistic intermolecular interactions. The Lennard-Jones potential is often used as a building block in molecular models for more complex substances. Many studies of the idealized "Lennard-Jones substance" use the potential to understand the physical nature of matter.
The virial expansion is a model of thermodynamic equations of state. It expresses the pressure P of a gas in local equilibrium as a power series of the density. This equation may be represented in terms of the compressibility factor, Z, as This equation was first proposed by Kamerlingh Onnes. The terms A, B, and C represent the virial coefficients. The leading coefficient A is defined as the constant value of 1, which ensures that the equation reduces to the ideal gas expression as the gas density approaches zero.
Virial coefficients appear as coefficients in the virial expansion of the pressure of a many-particle system in powers of the density, providing systematic corrections to the ideal gas law. They are characteristic of the interaction potential between the particles and in general depend on the temperature. The second virial coefficient depends only on the pair interaction between the particles, the third depends on 2- and non-additive 3-body interactions, and so on.
In thermodynamics, the fugacity of a real gas is an effective partial pressure which replaces the mechanical partial pressure in an accurate computation of chemical equilibrium. It is equal to the pressure of an ideal gas which has the same temperature and molar Gibbs free energy as the real gas.
Real gases are nonideal gases whose molecules occupy space and have interactions; consequently, they do not adhere to the ideal gas law. To understand the behaviour of real gases, the following must be taken into account:
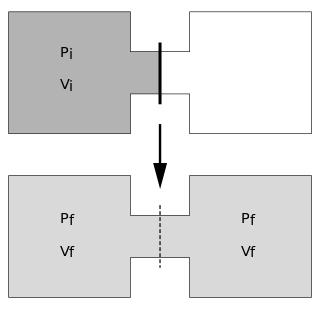
The Joule expansion is an irreversible process in thermodynamics in which a volume of gas is kept in one side of a thermally isolated container, with the other side of the container being evacuated. The partition between the two parts of the container is then opened, and the gas fills the whole container.
In thermodynamics, a critical point is the end point of a phase equilibrium curve. One example is the liquid–vapor critical point, the end point of the pressure–temperature curve that designates conditions under which a liquid and its vapor can coexist. At higher temperatures, the gas comes into a supercritical phase, and so cannot be liquefied by pressure alone. At the critical point, defined by a critical temperatureTc and a critical pressurepc, phase boundaries vanish. Other examples include the liquid–liquid critical points in mixtures, and the ferromagnet–paramagnet transition in the absence of an external magnetic field.
The acentric factorω is a conceptual number introduced by Kenneth Pitzer in 1955, proven to be useful in the description of fluids. It has become a standard for the phase characterization of single and pure components, along with other state description parameters such as molecular weight, critical temperature, critical pressure, and critical volume. The acentric factor is also said to be a measure of the non-sphericity (centricity) of molecules.
In thermodynamics, a departure function is defined for any thermodynamic property as the difference between the property as computed for an ideal gas and the property of the species as it exists in the real world, for a specified temperature T and pressure P. Common departure functions include those for enthalpy, entropy, and internal energy.
According to van der Waals, the theorem of corresponding states indicates that all fluids, when compared at the same reduced temperature and reduced pressure, have approximately the same compressibility factor and all deviate from ideal gas behavior to about the same degree.
The Boyle temperature, named after Robert Boyle, is formally defined as the temperature for which the second virial coefficient, , becomes zero. It is at this temperature that the attractive forces and the repulsive forces acting on the gas particles balance out
Gas is one of the four fundamental states of matter. The others are solid, liquid, and plasma. A pure gas may be made up of individual atoms, elemental molecules made from one type of atom, or compound molecules made from a variety of atoms. A gas mixture, such as air, contains a variety of pure gases. What distinguishes gases from liquids and solids is the vast separation of the individual gas particles. This separation usually makes a colorless gas invisible to the human observer.
In physics and thermodynamics, the Redlich–Kwong equation of state is an empirical, algebraic equation that relates temperature, pressure, and volume of gases. It is generally more accurate than the van der Waals equation and the ideal gas equation at temperatures above the critical temperature. It was formulated by Otto Redlich and Joseph Neng Shun Kwong in 1949. It showed that a two-parameter, cubic equation of state could well reflect reality in many situations, standing alongside the much more complicated Beattie–Bridgeman model and Benedict–Webb–Rubin equation that were used at the time. Although it was initially developed for gases, the Redlich–Kwong equation has been considered the most modified equation of state since those modifications have been aimed to generalize the predictive results obtained from it. Although this equation is not currently employed in practical applications, modifications derived from this mathematical model like the Soave Redlich-Kwong (SWK), and Peng Robinson have been improved and currently used in simulation and research of vapor–liquid equilibria.
In thermodynamics, the reduced properties of a fluid are a set of state variables scaled by the fluid's state properties at its critical point. These dimensionless thermodynamic coordinates, taken together with a substance's compressibility factor, provide the basis for the simplest form of the theorem of corresponding states.
Cubic equations of state are a specific class of thermodynamic models for modeling the pressure of a gas as a function of temperature and density and which can be rewritten as a cubic function of the molar volume.
This page is based on this Wikipedia article Text is available under the CC BY-SA 4.0 license; additional terms may apply. Images, videos and audio are available under their respective licenses.