Elections to Coventry City Council were held in June 2004. Due to boundary changes, the entire council was up for election. The council remained with no overall control, but the Conservatives became the largest party.
Coventry is a city and metropolitan borough in the West Midlands, England.
The Conservative Party, officially the Conservative and Unionist Party, is a centre-right political party in the United Kingdom. Presently led by Theresa May, it has been the governing party since 2010. It presently has 314 Members of Parliament in the House of Commons, 249 members of the House of Lords, and 18 members of the European Parliament. It also has 31 Members of the Scottish Parliament, 12 members of the Welsh Assembly, eight members of the London Assembly and 9,008 local councillors. One of the major parties of UK politics, it has formed the government on 45 occasions, more than any other party.
After the election, the composition of the council was
The Labour Party is a centre-left political party in the United Kingdom which has been described as an alliance of social democrats, democratic socialists and trade unionists. The party's platform emphasises greater state intervention, social justice and strengthening workers' rights.
The Liberal Democrats are a liberal political party in the United Kingdom. They presently have 11 Members of Parliament in the House of Commons, 96 members of the House of Lords, and one member of the European Parliament. They also have five Members of the Scottish Parliament and a member each in the Welsh Assembly and London Assembly. The party reached the height of its influence in the early 2010s, forming a junior partner in a coalition government from 2010 to 2015. It is presently led by Vince Cable.
The Socialist Party is a Trotskyist political party in England and Wales which adopted its current name in 1997 after being formerly known as Militant, an entryist group in the Labour Party from 1964 until it abandoned that tactic in 1991. The party stands under the electoral banner of the Trade Unionist and Socialist Coalition (TUSC).
Party | Seats | Gains | Losses | Net gain/loss | Seats % | Votes % | Votes | +/− | |
---|---|---|---|---|---|---|---|---|---|
Conservative | 27 | 4 | 1 | +4 | 50.00 | ||||
Labour | 22 | 2 | 4 | -2 | 40.74 | ||||
Liberal Democrat | 3 | 1 | 0 | +1 | 5.56 | ||||
Socialist Alternative | 2 | 0 | 1 | -1 | 3.70 | ||||
BNP | 0 | 0 | 0 | 0 | 0.00 | ||||
Independent | 0 | 0 | -2 | -2 | 0.00 | ||||
Note that seat gains and losses are compared with the previous seat of the same name. All eighteen seats had redrawn boundaries.
Party | Candidate | Votes | % | ± | |
---|---|---|---|---|---|
Conservative | John Victor Gazey | 3,035 | |||
Conservative | Brian Kelsey | 2,522 | |||
Conservative | Andrew John Williams | 2,359 | |||
Labour | William Shakespeare | 1,470 | |||
Labour | Pamela June Darville | 1,326 | |||
Labour | Gordon Arthur Wright | 1,184 | |||
Liberal Democrat | Kevin John Weaver | 974 | |||
Majority | |||||
Turnout | |||||
Conservative hold | Swing | ||||
Party | Candidate | Votes | % | ± | |
---|---|---|---|---|---|
Labour | David Chater | 1,722 | |||
Labour | Ram Parkesh Lakha | 1,647 | |||
Labour | John Roderick Mutton | 1,639 | |||
Conservative | Joseph Andrew Featherstone | 1,399 | |||
Conservative | Graham Richard Williams | 1,332 | |||
Conservative | Mimi Francesca Hwangpo | 1,159 | |||
Independent | Craig Deniro | 845 | |||
Liberal Democrat | David Richard Farren | 784 | |||
Socialist Alternative | David Bryan Runnalls | 423 | |||
Majority | |||||
Turnout | |||||
Labour hold | Swing | ||||
Party | Candidate | Votes | % | ± | |
---|---|---|---|---|---|
Conservative | Kevin John Foster | 2,284 | |||
Conservative | Hazel Margaret Noonan | 2,395 | |||
Conservative | Linda Ann Reece | 2,230 | |||
Labour | John Boynton | 1,530 | |||
Labour | Helen Elizabeth Sinclair | 1,385 | |||
Labour | Rois Ali | 1,323 | |||
Liberal Democrat | Terence Kenny | 1,084 | |||
Independent | Irene Elizabeth Rogers | 673 | |||
Majority | |||||
Turnout | |||||
Conservative hold | Swing | ||||
Party | Candidate | Votes | % | ± | |
---|---|---|---|---|---|
Conservative | Catherine Harper | 2,789 | |||
Conservative | Andrew McDonald Matchet | 2,598 | |||
Conservative | Kenneth John Taylor | 2,657 | |||
Labour | Kathleen Mary Fletcher | 1,782 | |||
Labour | Peter Francis Davis | 1,724 | |||
Labour | Baljinder Singh | 1,341 | |||
Liberal Democrat | Vincent John McKee | 1,193 | |||
Independent | Paul Anthony Smith | 703 | |||
Majority | |||||
Turnout | |||||
Conservative hold | Swing | ||||
Party | Candidate | Votes | % | ± | |
---|---|---|---|---|---|
Conservative | Shabbir Ahmed | 2,171 | |||
Conservative | Mohammed Asif | 2,155 | |||
Labour | Malkiat Singh Auluck | 1,923 | |||
Labour | Satnam Singh Gill | 1,899 | |||
Conservative | Harjinder Singh Sehmi | 1,876 | |||
Labour | Marilyn Ann (Mal) Mutton | 1,856 | |||
Liberal Democrat | Geoffrey Brian Sewards | 516 | |||
Socialist Alternative | Lakshman James Hensman | 332 | |||
Majority | |||||
Turnout | |||||
Conservative gain from Labour | Swing | ||||
Labour hold | Swing | ||||
Party | Candidate | Votes | % | ± | |
---|---|---|---|---|---|
Labour | Brian David Patton | 1,643 | |||
Labour | Lynnette Catherine Kelly | 1,431 | |||
Labour | Thomas Patrick Ruddy | 1,380 | |||
Conservative | Jean Margaret Tandy | 1,323 | |||
Conservative | Avril Rosemary Johnson | 1,262 | |||
Conservative | Mary Winifred Lee | 1,222 | |||
Liberal Democrat | Mandeep Singh Jandu | 715 | |||
Socialist Alternative | Paul David Hunt | 527 | |||
Majority | |||||
Turnout | |||||
Labour hold | Swing | ||||
Party | Candidate | Votes | % | ± | |
---|---|---|---|---|---|
Labour | Margaret Lancaster | 1,727 | |||
Labour | Joseph Clifford | 1,652 | |||
Labour | Evelyn Ann (Ann) Lucas | 1,626 | |||
Conservative | Scot Kereck Hatfield | 992 | |||
Conservative | Gareth David Peters | 957 | |||
Conservative | Amrit Pal Kaur Singh | 881 | |||
Liberal Democrat | Dennis Herbert Jeffrey | 794 | |||
Liberal Democrat | David Michael Field | 793 | |||
Liberal Democrat | Alice Rachel Turner | 693 | |||
Socialist Alternative | Michael Jeffrey Holton | 284 | |||
Majority | |||||
Turnout | |||||
Labour hold | Swing | ||||
Party | Candidate | Votes | % | ± | |
---|---|---|---|---|---|
Labour | George Arthur Duggins | 2,052 | |||
Labour | Linda Joyce Bigham | 2,041 | |||
Labour | Jill Valerie (Val) Stone | 1,881 | |||
Conservative | Allan Robert Andrews | 1,226 | |||
Conservative | Harry Maeers | 1,090 | |||
Conservative | Ian Thomas Jamie | 1,070 | |||
Liberal Democrat | Derek Arthur Franklin | 831 | |||
Majority | |||||
Turnout | |||||
Labour hold | Swing | ||||
Labour gain from [[|N/A]] | Swing | ||||
Party | Candidate | Votes | % | ± | |
---|---|---|---|---|---|
Labour | Jack Harrison | 1,975 | |||
Labour | John Douglas McNicholas | 1,852 | |||
Labour | Philip David Townshend | 1,603 | |||
Conservative | Michael Antony Hammon | 1,396 | |||
Conservative | Margaret Veronica Rigby | 1,334 | |||
Conservative | Marcus Edgar Lapsa | 1,163 | |||
Independent | Christine Margaret Oddy | 1,156 | |||
Liberal Democrat | Richard Ian Kay | 765 | |||
Socialist Alternative | Jane Ashwell | 561 | |||
Majority | |||||
Turnout | |||||
Labour hold | Swing | ||||
Party | Candidate | Votes | % | ± | |
---|---|---|---|---|---|
Labour | Kate Hunter | 1,516 | |||
Labour | Anthony Charles Skipper | 1,345 | |||
Labour | Keiran Pascal Mulhall | 1,309 | |||
Conservative | Mary Craggs | 858 | |||
Conservative | Brenda Mary Kelsey | 812 | |||
Conservative | Bruce William Peace | 776 | |||
Liberal Democrat | Peter Simpson | 764 | |||
Liberal Democrat | Sofia Angelica Bridger | 728 | |||
Liberal Democrat | Warwick Michael Dumas | 716 | |||
Independent | John Joseph Ryan | 357 | |||
Marxist Party | David Anderson | 222 | |||
Socialist Alternative | Frances Ann Flint | 220 | |||
Majority | |||||
Turnout | |||||
Labour hold | Swing | ||||
Party | Candidate | Votes | % | ± | |
---|---|---|---|---|---|
Socialist Alternative | David John Nellist | 1,586 | |||
Socialist Alternative | Karen McKay | 1,449 | |||
Labour | Suleman Ismail (Solly) Bhyat | 1,217 | |||
Socialist Alternative | Robert Piers Windsor | 1,201 | |||
Labour | James Matthew O'Boyle | 1,201 | |||
Labour | Steven Peter Thomas | 1,118 | |||
Conservative | Duncan Thomas Flynn | 469 | |||
Conservative | Mary Taylor | 436 | |||
Liberal Democrat | Ian Thomas Holmes | 409 | |||
Liberal Democrat | Faye Langston | 391 | |||
Conservative | Jane Marie Westerman | 361 | |||
Majority | |||||
Turnout | |||||
Socialist Alternative hold | Swing | ||||
Labour gain from Socialist Alternative | Swing | ||||
Party | Candidate | Votes | % | ± | |
---|---|---|---|---|---|
Conservative | Gary Christopher Ridley | 1,787 | |||
Conservative | Heather Rutter | 1,767 | |||
Conservative | David Arrowsmith | 1,727 | |||
Labour | Jayne Elisabeth Innes | 1,395 | |||
Labour | Eric Lloyd Linton | 1,392 | |||
Labour | Patrick Joseph Walsh | 1,316 | |||
Liberal Democrat | William George Haymes | 897 | |||
Socialist Alternative | Jason Arnold Toynbee | 446 | |||
Majority | |||||
Turnout | |||||
Conservative hold | Swing | ||||
Party | Candidate | Votes | % | ± | |
---|---|---|---|---|---|
Liberal Democrat | Derek Stephen Benefield | 2,119 | |||
Liberal Democrat | Russell David Field | 2,047 | |||
Liberal Democrat | Jacqueline Bridget Basu | 1,865 | |||
Labour | Sucha Singh Bains | 1,776 | |||
Labour | Howard Peter Lacy | 1,504 | |||
Labour | David Stuart Welsh | 1,480 | |||
Conservative | Roger Bailey | 526 | |||
Conservative | Sharon Jane Featherstone | 480 | |||
Conservative | Hazel Ann Reece | 457 | |||
Socialist Alternative | Eleanor Griffiths | 251 | |||
Majority | |||||
Turnout | |||||
Liberal Democrat gain from Labour | Swing | ||||
Liberal Democrat hold | Swing | ||||
Party | Candidate | Votes | % | ± | |
---|---|---|---|---|---|
Conservative | John Anthony Blundell | 2,811 | |||
Conservative | Timothy Winspear Sawdon | 2,753 | |||
Conservative | Gary Edward Crookes | 2,736 | |||
Labour | Pamela Phillips | 1,382 | |||
Liberal Democrat | Edward Rhys Williams | 1,356 | |||
Labour | Jaswant Singh Sambi | 1,240 | |||
Labour | Mohammed Saeed | 1,032 | |||
Majority | |||||
Turnout | |||||
Conservative hold | Swing | ||||
Party | Candidate | Votes | % | ± | |
---|---|---|---|---|---|
Labour | David Henry Batten | 1,780 | |||
Conservative | Nigel Charles Lee | 1,699 | |||
Labour | Sheila Lacy | 1,664 | |||
Conservative | David John Skinner | 1,658 | |||
Conservative | Hannah Jane (Jane) O'Neill | 1,647 | |||
Labour | Lindsley Harvard | 1,459 | |||
Liberal Democrat | Conrad George Stephen Benefield | 792 | |||
Independent | Henderson Easton (Harry) Brooks | 585 | |||
Socialist Alternative | James Richard Donnelly | 424 | |||
Majority | |||||
Turnout | |||||
Labour hold | Swing | ||||
Conservative gain from Independent | Swing | ||||
Labour hold | Swing | ||||
Party | Candidate | Votes | % | ± | |
---|---|---|---|---|---|
Conservative | Joan Ann Griffin | 1,951 | |||
Conservative | Kenneth Henry Charley | 1,906 | |||
Conservative | Clifford Leonard Ridge | 1,766 | |||
Labour | Kevin Barry Maton | 1,511 | |||
Labour | Joan Ellen Stanton | 1,437 | |||
Labour | Michael John Rawson | 1,436 | |||
Liberal Democrat | Arthur Hugh Thomas | 1,242 | |||
Socialist Alternative | Mark Edward Power | 563 | |||
Majority | |||||
Turnout | |||||
Conservative hold | Swing | ||||
Party | Candidate | Votes | % | ± | |
---|---|---|---|---|---|
Conservative | Heather Jean Johnson | 2,588 | |||
Conservative | Christian Michael Cliffe | 2,584 | |||
Conservative | Anthony John O'Neill | 2,487 | |||
Labour | Sarah Elizabeth Gold | 1,541 | |||
Labour | Myra Stella | 1,308 | |||
Labour | Joseph Akpati Ijoma | 1,264 | |||
Liberal Democrat | Gilbert Napier Penlington | 982 | |||
BNP | Roderick Malcolm Rowley | 894 | |||
Socialist Alternative | Jonathan Donald Morley | 348 | |||
Majority | |||||
Turnout | |||||
Conservative hold | Swing | ||||
Party | Candidate | Votes | % | ± | |
---|---|---|---|---|---|
Conservative | Susanna Ella Dixon | 1,871 | |||
Conservative | Michael Patrick Noonan | 1,647 | |||
Conservative | Yvette Maskell | 1,617 | |||
Labour | Colleen Margaret Fletcher | 1,469 | |||
Liberal Democrat | Adrian Edward Dyke | 1,278 | |||
Labour | John French | 1,215 | |||
Labour | Terence Rollings | 1,169 | |||
Liberal Democrat | Stephen Howarth | 1,129 | |||
Liberal Democrat | Brian Rees Lewis | 1,018 | |||
Majority | |||||
Turnout | |||||
Conservative hold | Swing | ||||
Conservative gain from Labour | Swing | ||||
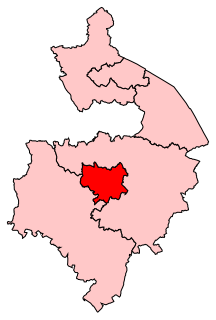
Warwick and Leamington is a constituency represented in the House of Commons of the UK Parliament since the 2017 general election by Matt Western, of the Labour Party.
Birmingham, Edgbaston is a constituency, created in 1885, in the Edgbaston area of Birmingham represented in the House of Commons of the UK Parliament since 2017 by Preet Gill MP of Labour Co-operative.
Cardiff South and Penarth is a constituency created in 1983 represented in the House of Commons of the UK Parliament. It is the largest such entity in Wales, with an electorate of 75,175 and one of the most ethnically diverse. It has been won by the Labour Party candidate since its creation in 1983.
Bristol West is a borough constituency represented in the House of Commons of the Parliament of the United Kingdom. It covers the central and western parts of Bristol.
Stoke-on-Trent Central is a constituency in Staffordshire. It has been represented by Gareth Snell, of the Labour and Co-operative party since a by-election in February 2017.
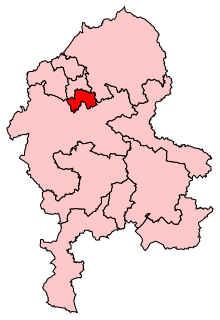
Stoke-on-Trent South is a constituency created in 1950, and represented in the House of Commons of the UK Parliament since 2017 by Jack Brereton, a Conservative. The local electorate returned a Labour MP in every election until 2017, when Jack Brereton became its first Conservative MP. The seat is non-rural and in the upper valley of the Trent covering half of the main city of the Potteries, a major ceramics centre since the 17th century.
Birmingham Hall Green is a parliamentary constituency in the city of Birmingham, which has been represented in the House of Commons of the UK Parliament since 2010 by Roger Godsiff of the Labour Party.
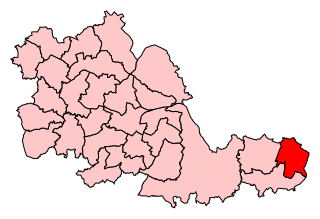
Coventry North East is a constituency represented in the House of Commons of the UK Parliament from the 2015 General Election by Colleen Fletcher of the Labour Party.
Putney is a constituency created in 1918 represented in the House of Commons of the UK Parliament since 2005 by Justine Greening of the Conservative Party.
Bristol North West is a constituency to the north and north-west of Bristol city centre represented in the House of Commons of the UK Parliament since 2017 by Darren Jones of the Labour Party.
Yeovil is a county constituency represented in the House of Commons of the Parliament of the United Kingdom. It elects one Member of Parliament (MP) by the first past the post system of election. It has been represented since 2015 by Marcus Fysh, a Conservative.
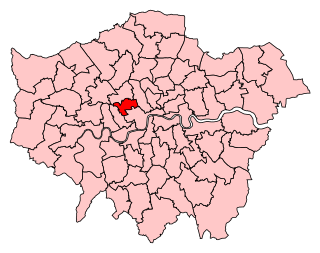
Westminster North is a constituency represented in the House of Commons of the UK Parliament since its 2010 recreation by Karen Buck, a member of the Labour Party. Its previous 1983 to 1997 existence is also covered by this article.
The 2004 St Helens Metropolitan Borough Council election took place on 10 June 2004 to elect members of St Helens Metropolitan Borough Council in Merseyside, England. The whole council was up for election with boundary changes since the last election in 2003 reducing the number of seats by six. The Labour party lost overall control of the council to no overall control.
An election to Slough Borough Council was held on 10 June 2004. The whole council was up for election. This was the 120th Slough general local authority election, since Slough became a local government unit in 1863, including both whole Council elections and elections by thirds.
The 2004 Wyre Forest District Council election took place on 10 June 2004 to elect members of Wyre Forest District Council in Worcestershire, England. The whole council was up for election with boundary changes since the last election in 2003. The council stayed under no overall control, but with the Conservatives taking over as the largest party on the council from the Health Concern party.
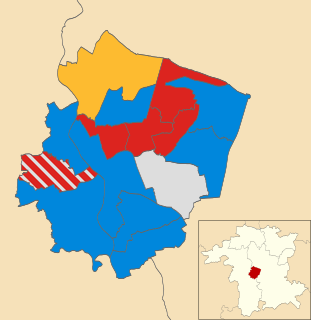
The 2004 Worcester City Council election took place on 10 June 2004 to elect members of Worcester District Council in Worcestershire, England. The whole council was up for election with boundary changes since the last election in 2003 reducing the number of seats by one. The Conservative party stayed in overall control of the council.
The 2003 Stratford-on-Avon District Council election took place on 1 May 2003 to elect members of Stratford-on-Avon District Council in Warwickshire, England. One third of the council was up for election and the Conservative party gained overall control of the council from no overall control.
The 2004 Hertsmere Borough Council election took place on 10 June 2004 to elect members of Hertsmere Borough Council in Hertfordshire, England. One third of the council was up for election and the Conservative party stayed in overall control of the council.
The 2003 Rother District Council election took place on 1 May 2003 to elect members of Rother District Council in East Sussex, England. The whole council was up for election after boundary changes reduced the number of seats by 7. The Conservative party stayed in overall control of the council.
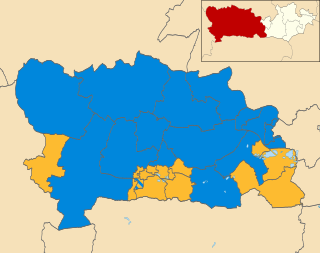
The 2003 West Berkshire Council election took place on 1 May 2003 to elect members of West Berkshire Council in Berkshire, England. The whole council was up for election with boundary changes since the last election in 2000 reducing the number of seats by 2. The Liberal Democrats lost overall control of the council to no overall control.