This article relies largely or entirely on a single source .(February 2022) |
This is a list of electric generation, consumption, exports and imports by country. Data are for the year 2021 and are from the EIA. [1] Figures are in terawatt-hours (TWh). Links for each location go to the relevant electricity market page, when available.
Location | Gen. | Con. | Imports | Exports | Net imports |
---|---|---|---|---|---|
World | 27,295 | 25,343 | 779 | 760 | 19 |
China | 8,152 | 7,806 | 5 | 22 | -18 |
United States | 4,165 | 3,979 | 53 | 14 | 39 |
India | 1,702 | 1,443 | 7 | 9 | -2 |
Russia | 1,110 | 996 | 4 | 22 | -18 |
Japan | 955 | 913 | 0 | 0 | 0 |
Brazil | 663 | 577 | 23 | 0.04 | 23 |
Canada | 626 | 555 | 10 | 48 | -38 |
South Korea | 587 | 568 | 0 | 0 | 0 |
Germany | 557 | 512 | 51 | 70 | -19 |
France | 530 | 447 | 25 | 69 | -45 |
Saudi Arabia | 367 | 329 | 0 | 0.3 | 0 |
Iran | 341 | 302 | 3 | 6 | -4 |
Mexico | 337 | 301 | 8 | 6 | 2 |
Turkey | 317 | 284 | 2 | 4 | -2 |
Indonesia | 307 | 282 | 1 | 0 | 1 |
United Kingdom | 289 | 287 | 29 | 4 | 25 |
Taiwan | 287 | 278 | 0 | 0 | 0 |
Italy | 274 | 300 | 47 | 4 | 43 |
Spain | 259 | 234 | 17 | 17 | 0.9 |
Australia | 247 | 237 | 0 | 0 | 0 |
Vietnam | 244 | 229 | 3 | 2 | 2 |
South Africa | 221 | 191 | 10 | 15 | -4 |
Egypt | 202 | 168 | 0.1 | 0.9 | -1 |
Thailand | 187 | 203 | 31 | 3 | 29 |
Poland | 167 | 158 | 15 | 14 | 0.9 |
Sweden | 165 | 131 | 8 | 34 | -26 |
Malaysia | 165 | 151 | 0.04 | 2 | -2 |
Norway | 158 | 131 | 8 | 26 | -18 |
Pakistan | 150 | 132 | 0.5 | 0 | 0.5 |
Ukraine | 150 | 134 | 3 | 3 | -1 |
Argentina | 147 | 127 | 6 | 4 | 2 |
United Arab Emirates | 136 | 129 | 0.2 | 0.2 | 0 |
Netherlands | 117 | 113 | 21 | 21 | 0.3 |
Philippines | 108 | 98 | 0 | 0 | 0 |
Kazakhstan | 104 | 97 | 2 | 2 | -1 |
Iraq | 97 | 53 | 19 | 0 | 19 |
Belgium | 95 | 83 | 15 | 23 | -8 |
Venezuela | 95 | 71 | 0 | 0.7 | -1 |
Chile | 85 | 81 | 0 | 0 | 0 |
Colombia | 81 | 76 | 0.5 | 0 | 0.5 |
Bangladesh | 81 | 78 | 7 | 0 | 7 |
Algeria | 78 | 69 | 0.5 | 0.6 | 0 |
Czech Republic | 77 | 62 | 15 | 26 | -11 |
Israel | 73 | 63 | 0 | 7 | -7 |
Kuwait | 71 | 65 | 0 | 0 | 0 |
Finland | 70 | 84 | 24 | 7 | 17 |
Austria | 64 | 69 | 26 | 19 | 8 |
Switzerland | 60 | 58 | 32 | 29 | 3 |
Uzbekistan | 59 | 58 | 5 | 3 | 3 |
Peru | 58 | 52 | 0.04 | 0 | 0.04 |
Romania | 55 | 51 | 9 | 6 | 2 |
Singapore | 53 | 53 | 0 | 0 | 0 |
Greece | 52 | 52 | 8 | 4 | 4 |
Qatar | 48 | 45 | 0 | 0 | 0 |
Portugal | 47 | 48 | 10 | 5 | 5 |
Belarus | 44 | 41 | 4 | 5 | 0 |
New Zealand | 43 | 41 | 0 | 0 | 0 |
Bulgaria | 42 | 30 | 2 | 11 | -9 |
Morocco | 41 | 35 | 2 | 0.9 | 1 |
Paraguay | 40 | 8 | 0 | 28 | -28 |
Laos | 40 | 6 | 1 | 33 | -31 |
Oman | 37 | 33 | 0 | 0 | 0 |
Hong Kong | 35 | 46 | 13 | 0 | 13 |
Serbia | 35 | 31 | 7 | 6 | 0.7 |
Hungary | 34 | 44 | 20 | 7 | 13 |
Ireland | 34 | 33 | 2 | 0.9 | 1 |
Denmark | 33 | 38 | 19 | 13 | 6 |
Ecuador | 32 | 27 | 0.3 | 1 | -1 |
Libya | 32 | 27 | 1 | 0 | 1 |
Bahrain | 32 | 31 | 0.7 | 0.4 | 0.2 |
Nigeria | 31 | 27 | 0 | 0 | 0 |
Slovakia | 27 | 26 | 14 | 13 | 0.8 |
Azerbaijan | 26 | 25 | 0.2 | 2 | -2 |
Burma | 22 | 17 | 0 | 1 | -1 |
Jordan | 22 | 20 | 0.3 | 0.2 | 0.1 |
Turkmenistan | 21 | 15 | 0 | 3 | -3 |
Ghana | 21 | 18 | 0.06 | 1 | -1 |
Tunisia | 21 | 16 | 0.4 | 1 | -1 |
Lebanon | 21 | 19 | 0.09 | 0 | 0.09 |
Mozambique | 20 | 13 | 8 | 12 | -4 |
Cuba | 20 | 16 | 0 | 0 | 0 |
Tajikistan | 20 | 16 | 0.4 | 2 | -1 |
Iceland | 19 | 19 | 0 | 0 | 0 |
Puerto Rico | 18 | 17 | 0 | 0 | 0 |
Zambia | 18 | 14 | 0.1 | 1 | -1 |
Dominican Republic | 18 | 15 | 0 | 0 | 0 |
Bosnia and Herzegovina | 17 | 11 | 3 | 8 | -5 |
Syria | 17 | 13 | 0 | 0.3 | 0 |
Sudan | 17 | 13 | 0 | 0 | 0 |
Angola | 16 | 15 | 0 | 0 | 0 |
Sri Lanka | 16 | 15 | 0 | 0 | 0 |
Uruguay | 16 | 14 | 0.5 | 2 | -1 |
Slovenia | 15 | 14 | 8 | 9 | 0 |
Ethiopia | 15 | 10 | 0 | 2 | -2 |
Croatia | 15 | 16 | 11 | 8 | 3 |
Kyrgyzstan | 14 | 12 | 0.4 | 0.3 | 0.05 |
North Korea | 14 | 12 | 0 | 0 | 0 |
Guatemala | 14 | 13 | 1 | 1 | 0 |
Costa Rica | 13 | 11 | 0.01 | 1 | -1 |
Georgia | 13 | 13 | 3 | 2 | 2 |
Honduras | 12 | 8 | 0.3 | 0.5 | 0 |
Kenya | 12 | 9 | 0.2 | 0.02 | 0.1 |
Panama | 11 | 9 | 0.06 | 0.6 | -1 |
DR Congo | 11 | 9 | 0.4 | 0.2 | 0.2 |
Ivory Coast | 11 | 8 | 0.06 | 1 | -1 |
Bolivia | 11 | 10 | 0 | 0 | 0 |
Bhutan | 9 | 3 | 0.1 | 5 | -5 |
Albania | 9 | 7 | 2 | 3 | -1 |
Trinidad and Tobago | 9 | 8 | 0 | 0 | 0 |
Cambodia | 9 | 11 | 4 | 0 | 4 |
Tanzania | 8 | 7 | 0.1 | 0 | 0.1 |
Cameroon | 8 | 6 | 0.02 | 0 | 0.02 |
Zimbabwe | 8 | 8 | 2 | 0.4 | 2 |
Armenia | 7 | 6 | 0.4 | 1 | -1 |
Mongolia | 7 | 8 | 2 | 0.04 | 2 |
Moldova | 7 | 10 | 3 | 0 | 3 |
Estonia | 7 | 9 | 7 | 5 | 3 |
El Salvador | 7 | 6 | 0.8 | 0.1 | 0.7 |
Kosovo | 6 | 6 | 1 | 1 | 0.2 |
Nepal | 6 | 7 | 3 | 0.1 | 3 |
Senegal | 6 | 5 | 0.4 | 0 | 0.4 |
Latvia | 6 | 7 | 5 | 3 | 2 |
North Macedonia | 5 | 7 | 3 | 0.4 | 2 |
Cyprus | 5 | 5 | 0 | 0 | 0 |
Papua New Guinea | 5 | 5 | 0 | 0 | 0 |
Brunei | 5 | 4 | 0 | 0 | 0 |
Nicaragua | 5 | 5 | 1 | 0 | 1 |
Uganda | 4 | 3 | 0.02 | 0.2 | 0 |
Jamaica | 4 | 3 | 0 | 0 | 0 |
Congo | 4 | 2 | 0.02 | 0.02 | 0.002 |
Lithuania | 4 | 12 | 12 | 3 | 9 |
Yemen | 4 | 3 | 0 | 0 | 0 |
Mali | 3 | 3 | 0.2 | 0.6 | 0 |
New Caledonia | 3 | 3 | 0 | 0 | 0 |
Montenegro | 3 | 3 | 6 | 6 | 0.08 |
Mauritius | 3 | 3 | 0 | 0 | 0 |
Guinea | 3 | 2 | 0 | 0 | 0 |
Gabon | 2 | 2 | 0.5 | 0 | 0.5 |
Botswana | 2 | 3 | 2 | 0 | 2 |
Bahamas | 2 | 2 | 0 | 0 | 0 |
Malta | 2 | 2 | 0.5 | 0.04 | 0.5 |
Madagascar | 2 | 2 | 0 | 0 | 0 |
Suriname | 2 | 2 | 0.8 | 0 | 0.8 |
Mauritania | 2 | 2 | 0.2 | 0 | 0.2 |
Guam | 2 | 2 | 0 | 0 | 0 |
Burkina Faso | 2 | 3 | 1 | 0 | 1 |
Namibia | 2 | 3 | 3 | 0.6 | 2 |
Malawi | 1 | 1 | 0 | 0 | 0 |
Equatorial Guinea | 1 | 1 | 0 | 0 | 0 |
Guyana | 1 | 1 | 0 | 0 | 0 |
Fiji | 1 | 1 | 0 | 0 | 0 |
Barbados | 1 | 1 | 0 | 0 | 0 |
Haiti | 1 | 0.4 | 0 | 0 | 0 |
Aruba | 0.9 | 1 | 0 | 0 | 0 |
Luxembourg | 0.9 | 6 | 7 | 1 | 6 |
Liberia | 0.9 | 1 | 0 | 0 | 0 |
Caribbean Netherlands | 0.9 | 1 | 0 | 0 | 0 |
Palestine | 0.9 | 6 | 6 | 0 | 6 |
Rwanda | 0.9 | 1 | 0.04 | 0.01 | 0.03 |
Afghanistan | 0.8 | 6 | 5 | 0 | 5 |
Eswatini | 0.7 | 1 | 0.9 | 0 | 0.9 |
Cayman Islands | 0.7 | 1 | 0 | 0 | 0 |
U.S. Virgin Islands | 0.7 | 1 | 0 | 0 | 0 |
French Polynesia | 0.7 | 1 | 0 | 0 | 0 |
Maldives | 0.7 | 1 | 0 | 0 | 0 |
Belize | 0.6 | 1 | 0.4 | 0 | 0.4 |
Seychelles | 0.6 | 1 | 0 | 0 | 0 |
Togo | 0.6 | 1 | 0.8 | 0 | 0.8 |
Greenland | 0.6 | 1 | 0 | 0 | 0 |
Macau | 0.6 | 6 | 5 | 0 | 5 |
Bermuda | 0.6 | 1 | 0 | 0 | 0 |
South Sudan | 0.6 | 1 | 0 | 0 | 0 |
East Timor | 0.5 | 0.4 | 0 | 0 | 0 |
Lesotho | 0.5 | 1 | 0.5 | 0 | 0.5 |
Cape Verde | 0.5 | 0.3 | 0 | 0 | 0 |
Eritrea | 0.5 | 0.4 | 0 | 0 | 0 |
Niger | 0.5 | 1 | 1 | 0 | 1 |
Faroe Islands | 0.4 | 0.4 | 0 | 0 | 0 |
Somalia | 0.4 | 0.4 | 0 | 0 | 0 |
Burundi | 0.4 | 0.4 | 0.1 | 0 | 0.1 |
Saint Lucia | 0.4 | 0.3 | 0 | 0 | 0 |
Antigua and Barbuda | 0.4 | 0.3 | 0 | 0 | 0 |
Chad | 0.3 | 0.3 | 0 | 0 | 0 |
Gambia | 0.3 | 0.2 | 0 | 0 | 0 |
Turks and Caicos Islands | 0.3 | 0.3 | 0 | 0 | 0 |
Benin | 0.2 | 1 | 0.6 | 0.002 | 0.6 |
Grenada | 0.2 | 0.2 | 0 | 0 | 0 |
Saint Kitts and Nevis | 0.2 | 0.2 | 0 | 0 | 0 |
Gibraltar | 0.2 | 0.2 | 0 | 0 | 0 |
Sierra Leone | 0.2 | 0.1 | 0 | 0 | 0 |
Samoa | 0.2 | 0.2 | 0 | 0 | 0 |
Dominica | 0.2 | 0.2 | 0 | 0 | 0 |
American Samoa | 0.2 | 0.2 | 0 | 0 | 0 |
Saint Vincent and the Grenadines | 0.2 | 0.2 | 0 | 0 | 0 |
Central African Republic | 0.2 | 0.1 | 0 | 0 | 0 |
British Virgin Islands | 0.1 | 0.1 | 0 | 0 | 0 |
Comoros | 0.1 | 0.1 | 0 | 0 | 0 |
Solomon Islands | 0.1 | 0.1 | 0 | 0 | 0 |
São Tomé and Príncipe | 0.1 | 0.09 | 0 | 0 | 0 |
Guinea-Bissau | 0.08 | 0.08 | 0 | 0 | 0 |
Tonga | 0.08 | 0.07 | 0 | 0 | 0 |
Vanuatu | 0.07 | 0.07 | 0 | 0 | 0 |
Djibouti | 0.06 | 0.5 | 0.5 | 0 | 0.5 |
Saint Pierre and Miquelon | 0.05 | 0.05 | 0 | 0 | 0 |
Cook Islands | 0.04 | 0.04 | 0 | 0 | 0 |
Nauru | 0.04 | 0.04 | 0 | 0 | 0 |
Kiribati | 0.03 | 0.03 | 0 | 0 | 0 |
Falkland Islands | 0.02 | 0.02 | 0 | 0 | 0 |
Montserrat | 0.01 | 0.01 | 0 | 0 | 0 |
Saint Helena | 0.01 | 0.01 | 0 | 0 | 0 |
Niue | 0.004 | 0.003 | 0 | 0 | 0 |
Japan is a major consumer of energy, ranking fifth in the world by primary energy use. Fossil fuels accounted for 88% of Japan's primary energy in 2019. Japan imports most of its energy due to scarce domestic resources. As of 2022, the country imports 97% of its oil and is the larger LNG importer globally.
The energy policy of the United States is determined by federal, state, and local entities. It addresses issues of energy production, distribution, consumption, and modes of use, such as building codes, mileage standards, and commuting policies. Energy policy may be addressed via legislation, regulation, court decisions, public participation, and other techniques.
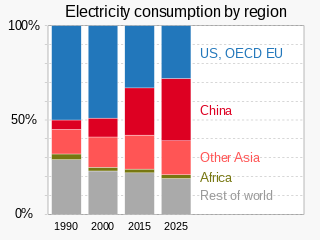
Electric energy consumption is energy consumption in the form of electrical energy. About a fifth of global energy is consumed as electricity: for residential, industrial, commercial, transportation and other purposes. Quickly increasing this share by further electrification is extremely important to limit climate change, because most other energy is consumed by burning fossil fuels thus emitting greenhouse gases which trap heat.
Energy in the United States is obtained from a diverse portfolio of sources, although the majority came from fossil fuels in 2021, as 36% of the nation's energy originated from petroleum, 32% from natural gas, and 11% from coal. Electricity from nuclear power supplied 8% and renewable energy supplied 12%, which includes biomass, wind, hydro, solar and geothermal.
Iran possesses significant energy reserves, holding the position of the world's third-largest in proved oil reserves and the second-largest in natural gas reserves as of 2021. At the conclusion of the same year, Iran's share comprised 24% of the oil reserves in the Middle East and 12% of the worldwide total.
Domestic energy consumption refers to the total energy consumption of a single household. Globally, the amount of energy used per household may vary significantly, depending on factors such as the standard of living of the country, the climate, the age of the occupant of the home, and type of residence. Households in different parts of the world will have differing levels of consumption, based on latitude and technology.
Coal generated about 19.5% of the electricity at utility-scale facilities in the United States in 2022, down from 38.6% in 2014 and 51% in 2001. In 2021, coal supplied 9.5 quadrillion British thermal units (2,800 TWh) of primary energy to electric power plants, which made up 90% of coal's contribution to U.S. energy supply. Utilities buy more than 90% of the coal consumed in the United States. There were over 200 coal powered units across the United States in 2022. Coal plants have been closing since the 2010s due to cheaper and cleaner natural gas and renewables. Due to measures such as scrubbers air pollution from the plants kills far fewer people nowadays, but deaths in 2020 from PM 2.5 have been estimated at 1600. Environmentalists say that political action is needed to close them faster, to also reduce greenhouse gas emissions by the United States and better limit climate change.
South Korea is a major energy importer, importing nearly all of its oil needs and ranking as the second-largest importer of liquefied natural gas in the world. Electricity generation in the country mainly comes from conventional thermal power, which accounts for more than two thirds of production, and from nuclear power.
The United States has the second largest electricity sector in the world, with 4,178 Terawatt-hours of generation in 2023. In 2023 the industry earned $491b in revenue at an average price of $0.127/kWh.
Ultra-high-voltage electricity transmission has been used in China since 2009 to transmit both alternating current (AC) and direct current (DC) electricity over long distances separating China's energy resources and consumers. Expansion of both AC and DC capacity continues in order to match generation to consumption demands while minimizing transmission losses. Decarbonization improvements will result from the replacement of lower efficiency generation, located near the coast, by more modern high-efficiency generation with less pollution near the energy resources.
Energy in Algeria encompasses the production, consumption, and import of energy. As of 2009, the primary energy use in Algeria was 462 TWh, with a per capita consumption of 13 TWh. Algeria is a significant producer and exporter of oil and gas and has been a member of the Organization of the Petroleum Exporting Countries (OPEC) since 1969. It also participates in the OPEC+ agreement, collaborating with non-OPEC oil-producing nations. Historically, the country has relied heavily on fossil fuels, which are heavily subsidized and constitute the majority of its energy consumption. In response to global energy trends, Algeria updated its Renewable Energy and Energy Efficiency Development Plan in 2015, aiming for significant advancements by 2030. This plan promotes the deployment of large-scale renewable technologies, such as solar photovoltaic systems and onshore wind installations, supported by various incentive measures.
Solar power in Texas, a portion of total energy in Texas, includes utility-scale solar power plants as well as local distributed generation, mostly from rooftop photovoltaics. The western portion of the state especially has abundant open land areas, with some of the greatest solar and wind potential in the country. Development activities there are also encouraged by relatively simple permitting and significant available transmission capacity.
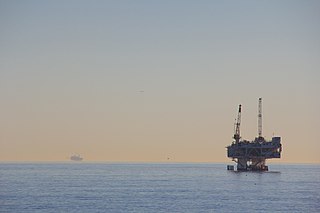
Energy is a major area of the economy of California. California is the state with the largest population and the largest economy in the United States. It is second in energy consumption after Texas. As of 2018, per capita consumption was the fourth-lowest in the United States partially because of the mild climate and energy efficiency programs.