Charter of the County of Orange, with amendments through June 2016.
Orange County is a charter county of California; its seat is Santa Ana. The government of Orange County is defined and authorized under the Constitution of California, California law, and the Charter of the County of Orange.[3] Much of the government of California is in practice the responsibility of county governments such as the government of Orange County. The County government provides countywide services such as elections and voter registration, law enforcement, jails, vital records, property records, tax collection, public health, and social services. In addition, the County serves as the local government for all unincorporated areas.
The county government is composed of the elected five-member Board of Supervisors, several other elected offices and officers including the Sheriff, District Attorney, Assessor/Recorder/County Clerk, and Treasurer/Tax Collector, and numerous county departments and entities under the supervision of the Chief Administrative Officer.
Several chartered municipalities in the county provide their own law enforcement, public safety, libraries, parks and recreation, zoning, and similar services. Other incorporated cities have some or all of these services provided by the County under a contract arrangement. In addition, several entities of the government of California have jurisdiction conterminous with Orange County, such as the Orange County Superior Court.
The county's mission statement is "Making Orange County a safe, healthy, and fulfilling place to live, work, and play, today and for generations to come, by providing outstanding, cost-effective regional public services." Many county government offices are part of the Orange County Civic Center Complex in downtown Santa Ana.
Each of the five members of the board of supervisors is elected from a regional district, and together, the board oversees the activities of the county's agencies and departments and sets policy on development, public improvements, and county services. At the beginning of each calendar year, the Supervisors select a chair and Vice Chair amongst themselves. The chair presides over board meetings, and the Vice Chair presides when the chair is not present. The Board appoints the Clerk of the Board of Supervisors, the County Counsel, the Performance Audit Director, and the Director of the Office of Independent Review. The Board also appoints the County Executive Officer to act as the chief administrative officer of the county and the manager of all agencies and departments not under the sole jurisdiction of an elected county official nor the sole jurisdiction of one of the four aforementioned officers appointed by the Board.[7]
In October 2024, Supervisor Andrew Do submitted a guilty plea to conspiracy to commit bribery as a result of taking more than $550,000 in bribes for directing and voting in favor of more than $10 million in COVID funds to his daughter's charity. His plea deal included paying back bribes that he and his daughters had received. He was sentenced to 5 years in federal prison.[8]
On July 12, 2010, it was revealed that former Sheriff Mike Carona received over $215,000 in pension checks in 2009, despite his felony conviction for attempting to obstruct a grand jury investigation.[9][10] A 2005 state law denied a public pension to public officials convicted of wrongdoing in office, however, that law only applied to benefits accrued after December 2005. Carona became eligible for his pension at age 50, and is also entitled, by law, to medical and dental benefits.[11][12] The county pension program continues to pay out his pension through 2023.[13]
The county made international news with its multi-billion dollar default on December 6, 1994.[14] The loss was blamed on interest rate fluctuations causing margin calls for derivative investments by the county Treasurer's office.[14] The Chapter 9 bankruptcy ended when it emerged on June 12, 1996.[15] The Orange County bankruptcy was at the time the largest municipal bankruptcy in U.S. history.[14]
The investment fund meltdown led to the criminal prosecution of treasurer Robert Citron who pled guilty to misappropriating public funds, and falsifying documents related to securities.[16] The county lost at least $1.5billion through high-risk investments in bonds.
Other governments
Department of Education
The County Department of Education is wholly separate from the County government and is jointly overseen by the elected County Superintendent of Schools and the five-member Orange County Board of Education, whose trustees are popularly elected from five separate trustee areas.[6]
As of January2023[update], the six elected officials overseeing the Orange County Department of Education are:[5][17][18]
Joint Powers Agreements are contracts between two government entities to deliver a service jointly, often saving administrative overhead through scale efficiencies. Among the approximately 77 in Orange County are Orange County Fire Authority, the San Joaquin Hills Transportation Corridor Agency , Fullerton School District Financing Authority and the Orange County Council of Governments.[20]
During most of the 20th century and up until 2016, Orange County was known for its political conservatism and for being a bastion for the Republican Party, with a 2005 academic study listing three Orange County cities as among America's 25 most conservative.[22] However, the county's changing demographics have coincided with a shift in political alignments, making it far more competitive in recent years. In 2016, Hillary Clinton became the first Democrat since 1936 to carry Orange County in a presidential election and in the 2018 midterm elections the Democratic Party gained control of every Congressional seat in the county.[23][24][25][26]
Although Democrats controlled all congressional districts in Orange County at the time, Republicans maintained a lead in voter registration numbers (although it shrunk to less than a percentage point as of February 10, 2019,[27] as compared with over 10% on February 10, 2013).[28] The number of registered Democrats surpassed the number of registered Republicans in the county in August 2019. As the number of Democrats increased, the number of voters not aligned with a political party increased to comprise 27.4% of the county's voters in 2019.[29] Republicans held a majority on the county Board of Supervisors until 2022, when Democrats established a 3–2 control of the body. Seven out of the 12 state legislators from Orange County are also Republicans.
Political history
From the mid-20th century until the 2010s, Orange County was known as a Republican stronghold and consistently sent Republican representatives to the state and federal legislatures—so strongly that Ronald Reagan described it as the place that "all the good Republicans go to die."[23] Republican majorities in Orange County helped deliver California's electoral votes to Republican nominees Richard Nixon in 1960, 1968, and 1972; Gerald Ford in 1976; Reagan in 1980 and 1984; and George H. W. Bush in 1988. It was one of five counties in the state that voted for Barry Goldwater in 1964.
In 1936, Orange County gave Franklin D. Roosevelt a majority of its presidential vote. The Republican nominee won Orange County by double digits in the next seventeen presidential elections. Orange County's Republican registration reached its apex in 1991, 55.6% of registered voters.[30] But with the 2008 election it began trending Democratic until Hillary Clinton won the county with an eight-point majority in 2016.[31][32] In 2020, Joe Biden further improved slightly on Clinton's 2016 margin of victory.[33][34] In 2023, the Republican party's registration was 33%, while the Democratic party's registration was 37.5%.[30] In 2024, Orange County again voted for the Democratic nominee and California native Kamala Harris, though Harris only won a plurality by a smaller margin than Biden or Hillary Clinton.
Orange County is one of six "reverse pivot counties", counties that voted Republican in 2008 and 2012 before voting Democratic in 2016 onward.[35]
United States presidential election results for Orange County, California[36]
The Republican margin began to narrow in the 1990s and 2000s as the state trended Democratic until the mid- to late-2010s when it voted for the Democratic Party in 2016 and in 2018, when the Democratic party won every United States House District anchored in the county, including four that had previously been held by Republicans.[38] This prompted media outlets to declare Orange County's Republican leanings "dead", with the Los Angeles Times running an op-ed titled, "An obituary to old Orange County, dead at age 129."[23][24][25][26][39] While Republicans were able to recapture two of the seven U.S. House seats in Orange County in 2020, Democrats continued to hold the other five, Biden won the county by a slightly greater margin than Clinton had, and Democrats received a majority of the votes in each of the seven congressional districts.[34] Republicans still carry more weight at the local level, and in 2020 for the State Assembly elections, they won 50.2% of the vote and four out of seven seats of the county.[40] In the 2022 midterm elections, no congressional districts flipped, though Republicans performed strongly in Orange County, with every statewide GOP candidate carrying it.
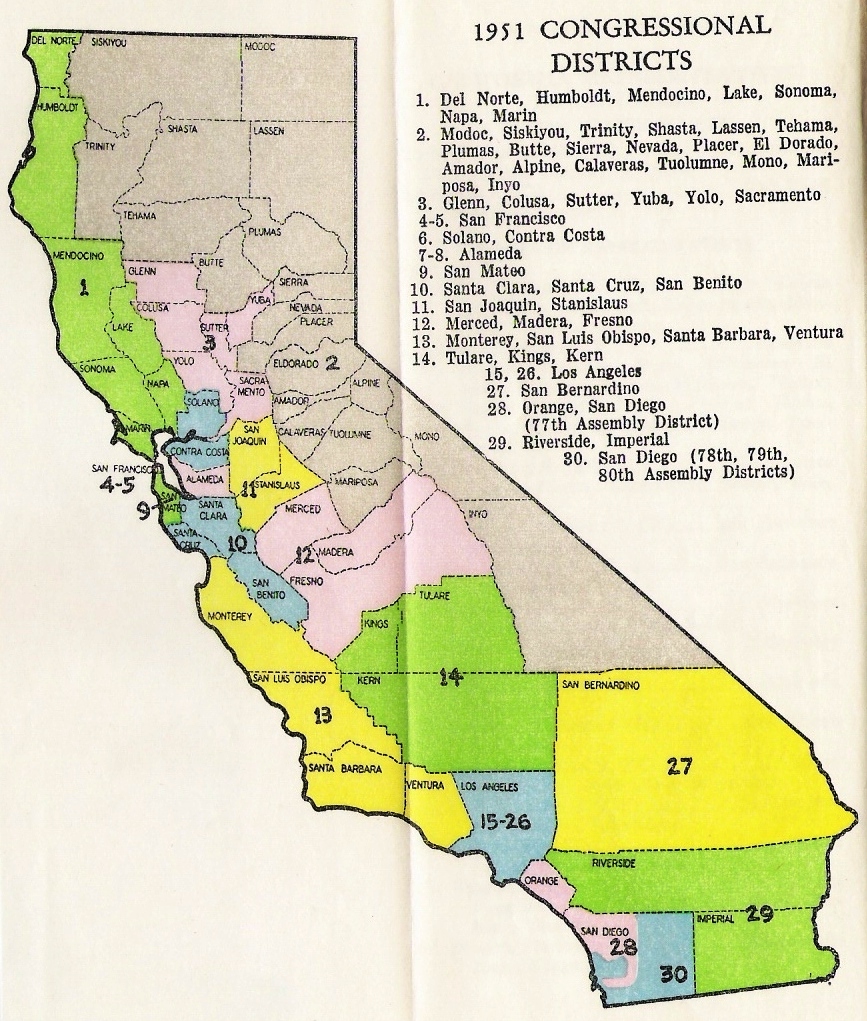
The 40th, 45th, 46th, and 47th districts are all centered in Orange County. The 38th has its population center in Los Angeles County, while the 49th is primarily San Diego County-based. 132, 154, 188 In the California State Senate, Orange County is split into 7 districts:[41]
According to the California Secretary of State, as of February 10, 2019, Orange County has 1,591,543 registered voters. Of these, 34% (541,711) are registered Republicans, and 33.3% (529,651) are registered Democrats. An additional 28.5% (453,343) declined to state a political party.[27]
While the growth of the county's Hispanic and Asian populations in recent decades has significantly influenced Orange County's culture, its conservative reputation has remained largely intact. Partisan voter registration patterns of Hispanics, Asians and other ethnic minorities in the county have tended to reflect the surrounding demographics, with resultant Republican majorities in all but the central portion of the county. When Loretta Sanchez, a Blue Dog Democrat, defeated veteran Republican Bob Dornan in 1996, she was continuing a trend of Democratic representation of that district that had been interrupted by Dornan's 1984 upset of former Congressman Jerry Patterson. Until 1992, Sanchez herself was a moderate Republican, and she is viewed as somewhat more moderate than other Democrats from Southern California.
In 2004, George W. Bush captured 60% of the county's vote, up from 56% in 2000 despite a higher Democratic popular vote statewide. Although Barbara Boxer won statewide in the simultaneously held senate election and fared better in Orange County than she did in 1998, Republican Bill Jones defeated her in the county, 51% to 43%. While the 39% that John Kerry received is higher than the percentage Bill Clinton won in 1992 or 1996, the percentage of the vote George W. Bush received in 2004 is the highest any presidential candidate has received since 1988, showing a still-dominant GOP presence in the county. In 2006, Senator Dianne Feinstein won 45% of the vote in the county, the best showing of a Democrat in a Senate race in over four decades, but Orange was nevertheless the only Coastal California county to vote for her Republican opponent, Dick Mountjoy.
The county is featured prominently in Lisa McGirr's book Suburban Warriors: The Origins of the New American Right. She argues that its conservative political orientation in the 20th century owed much to its settlement by farmers from the Great Plains, who reacted strongly to communist sympathies, the civil rights movement, and the turmoil of the 1960s in nearby Los Angeles — across the "Orange Curtain".
In the 1970s and 1980s, Orange County was one of California's leading Republican voting blocs and a subculture of residents with "Middle American" values that emphasized capitalist religious morality[clarification needed] in contrast to West coast liberalism.
Orange County has many Republican voters from culturally conservative Asian-American, Middle Eastern and Latino immigrant groups. The large Vietnamese-American communities in Garden Grove and Westminster are predominantly Republican; Vietnamese Americans registered Republicans outnumber those registered as Democrats, 55% to 22% as of 2007, while as of 2017 that figure is 42% to 36%. Republican Assemblyman Van Tran was the first Vietnamese-American elected to a state legislature and joined with Texan Hubert Vo as the highest-ranking elected Vietnamese-American in the United States until the 2008 election of Joseph Cao in Louisiana's 2nd congressional district. In the 2007 special election for the vacant county supervisor seat following Democrat Lou Correa's election to the state senate, two Vietnamese-American Republican candidates topped the list of 10 candidates, separated from each other by only seven votes, making the Orange County Board of Supervisors entirely Republican; Correa is first of only two Democrats to have served on the Board since 1987 and only the fifth since 1963.
Even with the Democratic sweep of Orange County's congressional seats in 2018, as well as a steady trend of Democratic gains in voter registration, the county remains very Republican downballot. Generally, larger cities–those with a population over 100,000, such as Anaheim, Santa Ana, and Irvine – feature a registration advantage for Democrats, while the other municipalities still have a Republican voter registration advantage. This is especially true in Newport Beach, Yorba Linda, and Villa Park, the three cities where the Republican advantage is largest. As of February 10, 2019, the only exceptions to the former are Huntington Beach and Orange, while exceptions to the latter include Buena Park, Laguna Beach and Stanton.[27]
Similarly, despite Orange county supporting Democratic candidates for president in 2016, and 2020, there are still several smaller municipalities in the county that have continued to vote Republican for president. In addition to the aforementioned Newport Beach, Yorba Linda, and Villa Park, the cities of Huntington Beach, Dana Point, San Juan Capistrano, and San Clemente also supported Republican nominee Donald Trump for president twice.[42]
This page is based on this Wikipedia article Text is available under the CC BY-SA 4.0 license; additional terms may apply. Images, videos and audio are available under their respective licenses.
