Italian local elections, 1985

Last updated
Italy-Emblem.svg
This article is part of a series on the
politics and government of
Italy
Constitution
Foreign relations

The 1985 Italian local elections were held on 12 and 13 May. [1] In Italy, direct elections were held in 5,772 comuni: in each comune were chosen mayor and members of the City Council.

Italy republic in Southern Europe

Italy, officially the Italian Republic, is a country in Southern Europe. Located in the middle of the Mediterranean Sea, Italy shares open land borders with France, Switzerland, Austria, Slovenia and the enclaved microstates San Marino and Vatican City. Italy covers an area of 301,340 km2 (116,350 sq mi) and has a largely temperate seasonal and Mediterranean climate. With around 61 million inhabitants, it is the fourth-most populous EU member state and the most populous country in Southern Europe.

<i>Comune</i> third-level administrative divisions of the Italian Republic

The comune is a basic administrative division in Italy, roughly equivalent to a township or municipality.

Contents

The elections were won by the Christian Democracy, led by Ciriaco De Mita. The election was also characterized by a strong result of the Italian Social Movement, which became the most voted party in the city of Bolzano in South Tyrol.

Christian Democracy (Italy) Italian political party, founded in 1943 and dissolved in 1994

Christian Democracy was a Christian democratic political party in Italy.

Ciriaco De Mita Prime Minister of Italy

Ciriaco Luigi De Mita is an Italian politician. He served as the 47th Prime Minister of Italy from 1988 to 1989 and as Member of the European Parliament from 2009 to 2013.

Italian Social Movement neo-fascist and post-fascist political party in Italy

The Italian Social Movement, renamed in 1972 Italian Social Movement – National Right, was a neo-fascist and post-fascist political party in Italy.

Municipal elections in the main cities

Turin

Party votes % seats
Italian Communist Party (PCI)259,19635.430
Christian Democracy (DC)171,90223.520
Italian Socialist Party (PSI)84,04311.59
Italian Republican Party (PRI)52,2267.16
Italian Liberal Party (PLI)43,8316.05
Italian Social Movement (MSI)43,2735.95
Italian Democratic Socialist Party (PSDI)24,5253.42
Green Civic List13,2131.81
Green List 11,9621.61
Proletarian Democracy (DP)11,2331.51
Piedmontese Union 6,0630.8-
Others11,4871.5-
Total732,954100.0080

Trento

Party votes % seats
Christian Democracy (DC)27,04939.920
Italian Communist Party (PCI)8,52412.66
Italian Socialist Party (PSI)7,94211.76
Green List 5,4578.04
Italian Republican Party (PRI)3,9705.93
Italian Democratic Socialist Party (PSDI)2,3463.52
Trentino Tyrolean People's Party (PPTT)2,2893.42
Italian Social Movement (MSI)2,2773.42
Proletarian Democracy (DP)2,1443.21
Trentino Tyrolean Autonomist Union (UATT)2.91
Italian Liberal Party (PLI)1,3582.31
Others3.42
Total71,672100.0050

Venice

Party votes % seats
Italian Communist Party (PCI)73,65230.519
Christian Democracy (DC)66,07127.317
Italian Socialist Party (PSI)41,81917.311
Italian Republican Party (PRI)11,8894.93
Italian Social Movement (MSI)11,7044.93
Green List 10,7294.42
Italian Democratic Socialist Party (PSDI)10,4044.32
Proletarian Democracy (DP)6,0202.51
Italian Liberal Party (PLI)4,9642.11
Venetian League (LV)4,4101.81
Total241,662100.0060

Udine

Party votes % seats
Christian Democracy (DC)25,82335.920
Italian Communist Party (PCI)11,15815.58
Italian Socialist Party (PSI)11,03215.38
Italian Democratic Socialist Party (PSDI)6,1868.64
Italian Social Movement (MSI)4,8776.83
Italian Republican Party (PRI)4,2055.93
Italian Liberal Party (PLI)2,3213.21
Green List 1,9072.71
Proletarian Democracy (DP)1,2921.81
Others3,1004.31
Total71,901100.0050

Genoa

Party votes % seats
Italian Communist Party (PCI)186,39636.531
Christian Democracy (DC)128,41725.121
Italian Socialist Party (PSI)73,51214.412
Italian Social Movement (MSI)25,5585.04
Italian Republican Party (PRI)22.5734,43
Italian Liberal Party (PLI)19,4133.83
Italian Democratic Socialist Party (PSDI)17,7553.52
Green List 15,2373.02
Pensioners' Party 7,9051.61
Proletarian Democracy (DP)7,8251.51
Others6,0561.2-
Total510,647100.0080

Bologna

Party votes % seats
Italian Communist Party (PCI)151,11344.529
Christian Democracy (DC)77,19922.715
Italian Socialist Party (PSI)40,96912.17
Italian Social Movement (MSI)17,9765.33
Italian Republican Party (PRI)15,3724.52
Italian Democratic Socialist Party (PSDI)10,4693.12
Italian Liberal Party (PLI)10,0093.01
Proletarian Democracy (DP)8,9692.61
Others7,4402.2-
Total339,516100.0060

Florence

Party votes % seats
Italian Communist Party (PCI)125,44239.925
Christian Democracy (DC)83,25826.517
Italian Socialist Party (PSI)38,56512.37
Italian Republican Party (PRI)17,7385.63
Italian Social Movement (MSI)15,8555.13
Green List 9,8793.12
Italian Liberal Party (PLI)7,3162.31
Italian Democratic Socialist Party (PSDI)6,4332.11
Proletarian Democracy (DP)5,9711.91
Others3,7701.2-
Total314,227100.0060

Perugia

Party votes % seats
Italian Communist Party (PCI)41,38340.722
Christian Democracy (DC)25,74525.314
Italian Socialist Party (PSI)19,14818.810
Italian Social Movement (MSI)5,9415.93
Italian Republican Party (PRI)3,6103.61
Italian Democratic Socialist Party (PSDI)1,8371.8-
Proletarian Democracy (DP)1,6351.6-
Italian Liberal Party (PLI)1,5551.5-
Others8440.8-
Total101,698100.0050

Rome

Party votes % seats
Christian Democracy (DC)629,95233.128
Italian Communist Party (PCI)586,03630.826
Italian Socialist Party (PSI)195,90510.38
Italian Social Movement (MSI)177,1989.37
Italian Republican Party (PRI)74,9163.93
Italian Socialist Democratic Party (PSDI)67,7753.63
Green List 51,2912.72
Italian Liberal Party (PLI)48,4232.62
Proletarian Democracy (DP)26,7051.41
Others43,7642.3-
Total1,901,965100.0080

L'Aquila

Party votes % seats
Christian Democracy (DC)17,58140.217
Italian Socialist Party (PSI)8,51219.58
Italian Communist Party (PCI)8,25018.98
Italian Social Movement (MSI)3,2257.43
Italian Republican Party (PRI)2,7946.42
Italian Socialist Democratic Party (PSDI)1,9984.61
Italian Liberal Party (PLI)1,0132.31
Proletarian Democracy (DP)3140.7-
Total43,687100.0040

Campobasso

Party votes % seats
Christian Democracy (DC)10,84351.322
Italian Communist Party (PCI)4,85714.86
Italian Socialist Party (PSI)4,41413.55
Italian Republican Party (PRI)2,2276.82
Italian Liberal Party (PLI)1,7755.42
Italian Social Movement (MSI)1,4904.52
Italian Socialist Democratic Party (PSDI)8692.71
Proletarian Democracy (DP)3341.0-
Total100.0040

Potenza

Party votes % seats
Christian Democracy (DC)22,37953.223
Italian Communist Party (PCI)6,37815.26
Italian Socialist Party (PSI)5,37812.85
Italian Socialist Democratic Party (PSDI)3,6698.73
Italian Social Movement (MSI)1,9624.72
Italian Liberal Party (PLI)1,0282.41
Proletarian Democracy (DP)6421.5-
Italian Republican Party (PRI)6091.5-
Total42,045100.0040

Bari

Party votes % seats
Christian Democracy (DC)74.32932,720
Italian Socialist Party (PSI)50.45222,214
Italian Communist Party (PCI)35.85515,810
Italian Social Movement (MSI)21.4639,46
Italian Socialist Democratic Party (PSDI)20.4589,05
Italian Republican Party (PRI)12.8595,73
Italian Liberal Party (PLI)5.7072,51
Green List 3.5891,61
Proletarian Democracy (DP)2.6171,1-
Total227.329100,0060

Catanzaro

Party votes % seats
Christian Democracy (DC)25,07743.623
Italian Communist Party (PCI)9,97017.49
Italian Socialist Party (PSI)9,78217.09
Italian Republican Party (PRI)4,1927.34
Italian Social Movement (MSI)3,4406.03
Italian Socialist Democratic Party (PSDI)3,1365.52
Proletarian Democracy (DP)4830.8-
Italian Liberal Party (PLI)3800.7-
Others1,0021.7-
Total57,462100.0050

Palermo

Party votes % seats
Christian Democracy (DC)148,63237.332
Italian Communist Party (PCI)58,74914.712
Italian Socialist Party (PSI)53,36513.411
Italian Social Movement (MSI)36,2819.17
Italian Republican Party (PRI)23,7316.05
Italian Socialist Democratic Party (PSDI)21,2725.44
Italian Liberal Party (PLI)16,7504.23
Green List 1.81
Proletarian Democracy (DP)4,6241.21
Others6.94
Totale398,226100.0080

Cagliari

Party votes % seats
Christian Democracy (DC)49,64935.419
Italian Communist Party (PCI)26,45918.810
Sardinian Action Party (PSd'Az)23,67316.99
Italian Socialist Party (PSI)14,10710.05
Italian Social Movement (MSI)7,8415.63
Italian Socialist Democratic Party (PSDI)6,2094.42
Italian Republican Party (PRI)5,2133.71
Italian Liberal Party (PLI)3,5972.61
Proletarian Democracy (DP)2,0871.5-
Green List 1,6051.1-
Total140,440100.0050

Related Research Articles

Seborga Comune in Liguria, Italy

Seborga is a small town in the region of Liguria in northwest Italy, near the French border. Administratively, it is a comune of the Italian province of Imperia. The main economic activities are horticulture and tourism.

1934 Italian general election

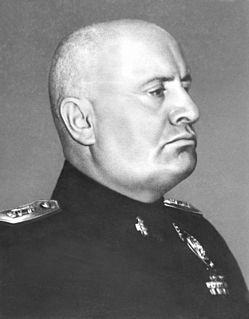
General elections were held in Italy on 26 March 1934. At the time, the country was a single-party state with the National Fascist Party (PNF) as the only legally permitted party.

2011 Italian local elections

The 2011 Italian local elections were held on 15–16 May, with a second round on 29–30 May. In Italy, direct elections were held in all 1,177 comuni and 11 provinces: in each comune were chosen mayor and members of the City Council, in each province were chosen president and members of the Provincial Council. Of the 1,177 comuni, 30 were capoluoghi and only 105 had a population higher than 15,000 inhabitants.

2010 Italian local elections

The 2010 Italian local elections were held on different dates; most on 29–30 March oncurrently with the Regional elections.

2012 Italian local elections

The 2012 Italian local elections were held on 6–7 May, with a second round on 20–21 May. In Italy, direct elections were held in 948 comuni: in each comune were chosen mayor and members of the City Council. Of the 948 comuni, 28 were capoluoghi and only 176 had a population higher than 15,000 inhabitants.

2013 Italian local elections

The 2013 Italian local elections were held on different dates; most on 25–26 May, with a second round on 8–9 June. In Italy, direct elections were held in 720 comuni: in each comune were chosen mayor and members of the City Council. Of the 720 comuni, 20 were capoluoghi and only 171 had a population higher than 15,000 inhabitants.

2014 Italian local elections

The 2014 Italian local elections were held on 25 May, with a second round on 8 June. In Italy, direct elections were held in 4086 comuni: in each comune were chosen mayor and members of the City Council. Of the 4086 comuni, 29 were capoluoghi and 243 had a population higher than 15,000 inhabitants.

2015 Italian local elections

The 2015 Italian local elections were to be held on 31 May, with a second round on 14 June, concurrently with the Regional elections. In Italy, direct elections were held in 1063 comuni: in each comune were chosen mayor and members of the City Council. Of the 1603 comuni, 15 were capoluoghi and 120 had a population higher than 15,000 inhabitants.

1946 Italian local elections

The 1946 Italian local elections were held on 10–17–24–31 March and 17 April. In Italy, direct elections were held in 5,772 comuni: in each comune were chosen mayor and members of the City Council.

1951 Italian local elections

The 1951 Italian local elections were held on 10–17–24–31 March and 17 April. In Italy, direct elections were held in 5,772 comuni: in each comune were chosen mayor and members of the City Council.

1956 Italian local elections

The 1956 Italian local elections were held on 27 May. In Italy, direct elections were held in 5,772 comuni: in each comune were chosen mayor and members of the City Council.

1960 Italian local elections

The 1960 Italian local elections were held on 6 November. In Italy, direct elections were held in 5,772 comuni: in each comune were chosen mayor and members of the City Council.

1964 Italian local elections

The 1964 Italian local elections were held on 22 November. In Italy, direct elections were held in 5,772 comuni: in each comune were chosen mayor and members of the City Council.

1970 Italian local elections

The 1970 Italian local elections were held on 7 and 8 June. In Italy, direct elections were held in 5,772 comuni: in each comune were chosen mayor and members of the City Council.

1975 Italian local elections

The 1975 Italian local elections were held on 15 and 16 June. In Italy, direct elections were held in 5,772 comuni: in each comune were chosen mayor and members of the City Council.

1980 Italian local elections

The 1980 Italian local elections were held on 8 June. In Italy, direct elections were held in 5,772 comuni: in each comune were chosen mayor and members of the City Council.

1990 Italian local elections

The 1990 Italian local elections were held on 6 and 7 May. In Italy, direct elections were held in 5,772 comuni: in each comune were chosen mayor and members of the City Council.

1993 Italian local elections

The 1993 Italian local elections were held on 6 and 20 June, on 21 November and 5 December. It was the first time where citizens could vote both for the mayor and the city council.

1994 Italian local elections

The 1994 Italian local elections were held on 12 and 26 June, on 20 November and 4 December. It was the first time where citizens could vote both for the mayor and the city council.

2018 Italian local elections

The 2018 Italian local elections were held on different dates; most on 10 June, with a second round on 24 June. In Italy, direct elections were held in 720 comuni: in each comune were chosen mayor and members of the City Council. Of the 783 comuni, 21 were capoluoghi and only 112 had a population higher than 15,000 inhabitants.

References