Low signal for fat in standard Spine Echo (SE),[4] though not with Fast Spin Echo/Turbo Spin Echo (FSE/TSE). FSE/TSE is the standard of care in modern medicine because it is faster. With FSE/TSE, fat has high signal due to disruption of hyperfineJ-coupling between adjacent fat protons.[6]
Magnetic labeling of arterial blood below the imaging slab, which subsequently enters the region of interest.[25] It does not need gadolinium contrast.[26]
Effects of TR and TE on MR signalExamples of T1-weighted, T2-weighted, and PD-weighted MRI scans
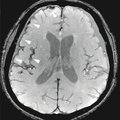
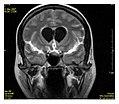
T1 and T2
Each tissue returns to its equilibrium state after excitation by the independent relaxation processes of T1 (spin-lattice; that is, magnetization in the same direction as the static magnetic field) and T2 (spin-spin; transverse to the static magnetic field). To create a T1-weighted image, magnetization is allowed to recover before measuring the MR signal by changing the repetition time (TR). This image weighting is useful for assessing the cerebral cortex, identifying fatty tissue, characterizing focal liver lesions, and in general, obtaining morphological information, as well as for post-contrast imaging. To create a T2-weighted image, magnetization is allowed to decay before measuring the MR signal by changing the echo time (TE). This image weighting is useful for detecting edema and inflammation, revealing white matter lesions, and assessing zonal anatomy in the prostate and uterus.
The standard display of MRI images is to represent fluid characteristics in black and white images, where different tissues turn out as follows:
Proton density (PD)- weighted images are created by having a long repetition time (TR) and a short echo time (TE).[36] On images of the brain, this sequence has a more pronounced distinction between grey matter (bright) and white matter (darker grey), but with little contrast between brain and CSF.[36] It is very useful for the detection of arthropathy and injury.[37]
A gradient echo sequence does not use a 180 degrees RF pulse to make the spins of particles coherent. Instead, it uses magnetic gradients to manipulate the spins, allowing the spins to dephase and rephase when required. After an excitation pulse, the spins are dephased, no signal is produced because the spins are not coherent. When the spins are rephased, they become coherent, and thus signal (or "echo") is generated to form images. Unlike spin echo, gradient echo does not need to wait for transverse magnetisation to decay completely before initiating another sequence, thus it requires very short repetition times (TR), and therefore to acquire images in a short time. After echo is formed, some transverse magnetisations remains. Manipulating gradients during this time will produce images with different contrast. There are three main methods of manipulating contrast at this stage, namely steady-state free-precession (SSFP) that does not spoil the remaining transverse magnetisation, but attempts to recover them (thus producing T2-weighted images); the sequence with spoiler gradient that averages the transverse magnetisations (thus producing mixed T1 and T2-weighted images), and RF spoiler that vary the phases of RF pulse to eliminates the transverse magnetisation, thus producing pure T1-weighted images.[39]
For comparison purposes, the repetition time of a gradient echo sequence is of the order of 3 milliseconds, versus about 30 ms of a spin echo sequence.[citation needed]
Inversion recovery is an MRI sequence that provides high contrast between tissue and lesion. It can be used to provide high T1 weighted image, high T2 weighted image, and to suppress the signals from fat, blood, or cerebrospinal fluid (CSF).[40]
Diffusion MRI measures the diffusion of water molecules in biological tissues.[41] Clinically, diffusion MRI is useful for the diagnoses of conditions (e.g., stroke) or neurological disorders (e.g., multiple sclerosis), and helps better understand the connectivity of white matter axons in the central nervous system.[42] In an isotropic medium (inside a glass of water for example), water molecules naturally move randomly according to turbulence and Brownian motion. In biological tissues however, where the Reynolds number is low enough for laminar flow, the diffusion may be anisotropic. For example, a molecule inside the axon of a neuron has a low probability of crossing the myelin membrane. Therefore, the molecule moves principally along the axis of the neural fiber. If it is known that molecules in a particular voxel diffuse principally in one direction, the assumption can be made that the majority of the fibers in this area are parallel to that direction.
The recent development of diffusion tensor imaging (DTI)[43] enables diffusion to be measured in multiple directions, and the fractional anisotropy in each direction to be calculated for each voxel. This enables researchers to make brain maps of fiber directions to examine the connectivity of different regions in the brain (using tractography) or to examine areas of neural degeneration and demyelination in diseases like multiple sclerosis.
Another application of diffusion MRI is diffusion-weighted imaging (DWI). Following an ischemic stroke, DWI is highly sensitive to the changes occurring in the lesion.[44] It is speculated that increases in restriction (barriers) to water diffusion, as a result of cytotoxic edema (cellular swelling), is responsible for the increase in signal on a DWI scan. The DWI enhancement appears within 5–10 minutes of the onset of stroke symptoms (as compared to computed tomography, which often does not detect changes of acute infarct for up to 4–6 hours) and remains for up to two weeks. Coupled with imaging of cerebral perfusion, researchers can highlight regions of "perfusion/diffusion mismatch" that may indicate regions capable of salvage by reperfusion therapy.
Like many other specialized applications, this technique is usually coupled with a fast image acquisition sequence, such as echo planar imaging sequence.
Perfusion weighted
MRI perfusion showing a delayed time-to-maximum flow (Tmax) in the penumbra in a case of occlusion of the left middle cerebral artery.
Arterial spin labelling (ASL): Magnetic labeling of arterial blood below the imaging slab, without the need of gadolinium contrast.[47]
The acquired data is then postprocessed to obtain perfusion maps with different parameters, such as BV (blood volume), BF (blood flow), MTT (mean transit time) and TTP (time to peak).
In cerebral infarction, the penumbra has decreased perfusion.[24] Another MRI sequence, diffusion-weighted MRI, estimates the amount of tissue that is already necrotic, and the combination of those sequences can therefore be used to estimate the amount of brain tissue that is salvageable by thrombolysis and/or thrombectomy.
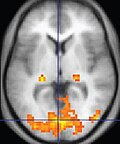
A fMRI scan showing regions of activation in orange, including the primary visual cortex (V1, BA17)
Functional MRI (fMRI) measures signal changes in the brain that are due to changing neural activity. It is used to understand how different parts of the brain respond to external stimuli or passive activity in a resting state, and has applications in behavioral and cognitive research, and in planning neurosurgery of eloquent brain areas.[48][49] Researchers use statistical methods to construct a 3-D parametric map of the brain indicating the regions of the cortex that demonstrate a significant change in activity in response to the task. Compared to anatomical T1W imaging, the brain is scanned at lower spatial resolution but at a higher temporal resolution (typically once every 2–3 seconds). Increases in neural activity cause changes in the MR signal via T* 2 changes;[50] this mechanism is referred to as the BOLD (blood-oxygen-level dependent) effect. Increased neural activity causes an increased demand for oxygen, and the vascular system actually overcompensates for this, increasing the amount of oxygenated hemoglobin relative to deoxygenated hemoglobin. Because deoxygenated hemoglobin attenuates the MR signal, the vascular response leads to a signal increase that is related to the neural activity. The precise nature of the relationship between neural activity and the BOLD signal is a subject of current research. The BOLD effect also allows for the generation of high resolution 3D maps of the venous vasculature within neural tissue.
While BOLD signal analysis is the most common method employed for neuroscience studies in human subjects, the flexible nature of MR imaging provides means to sensitize the signal to other aspects of the blood supply. Alternative techniques employ arterial spin labeling (ASL) or weighting the MRI signal by cerebral blood flow (CBF) and cerebral blood volume (CBV). The CBV method requires injection of a class of MRI contrast agents that are now in human clinical trials. Because this method has been shown to be far more sensitive than the BOLD technique in preclinical studies, it may potentially expand the role of fMRI in clinical applications. The CBF method provides more quantitative information than the BOLD signal, albeit at a significant loss of detection sensitivity.[citation needed]
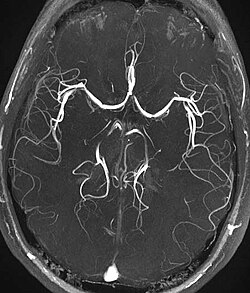
Magnetic resonance angiography (MRA) is a group of techniques based to image blood vessels. Magnetic resonance angiography is used to generate images of arteries (and less commonly veins) in order to evaluate them for stenosis (abnormal narrowing), occlusions, aneurysms (vessel wall dilatations, at risk of rupture) or other abnormalities. MRA is often used to evaluate the arteries of the neck and brain, the thoracic and abdominal aorta, the renal arteries, and the legs (the latter exam is often referred to as a "run-off").
Phase contrast MRI (PC-MRI) is used to measure flow velocities in the body. It is used mainly to measure blood flow in the heart and throughout the body. PC-MRI may be considered a method of magnetic resonance velocimetry. Since modern PC-MRI typically is time-resolved, it also may be referred to as 4-D imaging (three spatial dimensions plus time).[51]
Susceptibility-weighted imaging (SWI) is a new type of contrast in MRI different from spin density, T1, or T2 imaging. This method exploits the susceptibility differences between tissues and uses a fully velocity-compensated, three-dimensional, RF-spoiled, high-resolution, 3D-gradient echo scan. This special data acquisition and image processing produces an enhanced contrast magnitude image very sensitive to venous blood, hemorrhage and iron storage. It is used to enhance the detection and diagnosis of tumors, vascular and neurovascular diseases (stroke and hemorrhage), multiple sclerosis,[52] Alzheimer's, and also detects traumatic brain injuries that may not be diagnosed using other methods.[53]
Magnetization transfer (MT) is a technique to enhance image contrast in certain applications of MRI.
Bound protons are associated with proteins and as they have a very short T2 decay they do not normally contribute to image contrast. However, because these protons have a broad resonance peak they can be excited by a radiofrequency pulse that has no effect on free protons. Their excitation increases image contrast by transfer of saturatedspins from the bound pool into the free pool, thereby reducing the signal of free water. This homonuclear magnetization transfer provides an indirect measurement of macromolecular content in tissue. Implementation of homonuclear magnetization transfer involves choosing suitable frequency offsets and pulse shapes to saturate the bound spins sufficiently strongly, within the safety limits of specific absorption rate for MRI.[54]
The most common use of this technique is for suppression of background signal in time of flight MR angiography.[55] There are also applications in neuroimaging particularly in the characterization of white matter lesions in multiple sclerosis.[56]
Fat suppression is useful for example to distinguish active inflammation in the intestines from fat deposition such as can be caused by long-standing (but possibly inactive) inflammatory bowel disease, but also obesity, chemotherapy and celiac disease.[57] Without fat suppression techniques, fat and fluid will have similar signal intensities on fast spin-echo sequences.[58]
Techniques to suppress fat on MRI mainly include:[59]
Identifying fat by the chemical shift of its atoms, causing different time-dependent phase shifts compared to water.
Frequency-selective saturation of the spectral peak of fat by a "fat sat" pulse before imaging.
Short tau inversion recovery (STIR), a T1-dependent method
Spectral presaturation with inversion recovery (SPIR)
The following sequences are not commonly used clinically, and/or are at an experimental stage.
T1 rho (T1ρ)
T1 rho (T1ρ) is an experimental MRI sequence that may be used in musculoskeletal imaging. It does not yet have widespread use.[61]
Molecules have a kinetic energy that is a function of the temperature and is expressed as translational and rotational motions, and by collisions between molecules. The moving dipoles disturb the magnetic field but are often extremely rapid so that the average effect over a long time-scale may be zero. However, depending on the time-scale, the interactions between the dipoles do not always average away. At the slowest extreme the interaction time is effectively infinite and occurs where there are large, stationary field disturbances (e.g., a metallic implant). In this case the loss of coherence is described as a "static dephasing". T2* is a measure of the loss of coherence in an ensemble of spins that includes all interactions (including static dephasing). T2 is a measure of the loss of coherence that excludes static dephasing, using an RF pulse to reverse the slowest types of dipolar interaction. There is in fact a continuum of interaction time-scales in a given biological sample, and the properties of the refocusing RF pulse can be tuned to refocus more than just static dephasing. In general, the rate of decay of an ensemble of spins is a function of the interaction times and also the power of the RF pulse. This type of decay, occurring under the influence of RF, is known as T1ρ. It is similar to T2 decay but with some slower dipolar interactions refocused, as well as static interactions, hence T1ρ≥T2.[62]
Others
Saturation recovery sequences are rarely used, but can measure spin-lattice relaxation time (T1) more quickly than an inversion recovery pulse sequence.[63]
Double-oscillating-diffusion-encoding (DODE) and double diffusion encoding (DDE) imaging are specific forms of MRI diffusion imaging, which can be used to measure diameters and lengths of axon pores.[64]
↑ Henkelman, RM; Hardy, PA; Bishop, JE; Poon, CS; Plewes, DB (September 1992). "Why fat is bright in RARE and fast spin-echo imaging". Journal of magnetic resonance imaging: JMRI. 2 (5): 533–40. doi:10.1002/jmri.1880020511. PMID1392246.
↑ Graham D, Cloke P, Vosper M (2011-05-31). Principles and Applications of Radiological Physics E-Book (6ed.). Elsevier Health Sciences. p.292. ISBN978-0-7020-4614-8.}
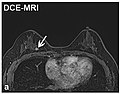
↑ Turnbull LW (January 2009). "Dynamic contrast-enhanced MRI in the diagnosis and management of breast cancer". NMR in Biomedicine. 22 (1): 28–39. doi:10.1002/nbm.1273. PMID18654999. S2CID5305422.
↑ Le Bihan D, Breton E, Lallemand D, Grenier P, Cabanis E, Laval-Jeantet M (November 1986). "MR imaging of intravoxel incoherent motions: application to diffusion and perfusion in neurologic disorders". Radiology. 161 (2): 401–407. doi:10.1148/radiology.161.2.3763909. PMID3763909. S2CID14420005.
↑ Giussani C, Roux FE, Ojemann J, Sganzerla EP, Pirillo D, Papagno C (January 2010). "Is preoperative functional magnetic resonance imaging reliable for language areas mapping in brain tumor surgery? Review of language functional magnetic resonance imaging and direct cortical stimulation correlation studies". Neurosurgery. 66 (1): 113–120. doi:10.1227/01.NEU.0000360392.15450.C9. PMID19935438. S2CID207142804.
↑ Thulborn KR, Waterton JC, Matthews PM, Radda GK (February 1982). "Oxygenation dependence of the transverse relaxation time of water protons in whole blood at high field". Biochimica et Biophysica Acta (BBA) - General Subjects. 714 (2): 265–270. doi:10.1016/0304-4165(82)90333-6. PMID6275909.
↑ Reichenbach JR, Venkatesan R, Schillinger DJ, Kido DK, Haacke EM (July 1997). "Small vessels in the human brain: MR venography with deoxyhemoglobin as an intrinsic contrast agent". Radiology. 204 (1): 272–277. doi:10.1148/radiology.204.1.9205259. PMID9205259.[permanent dead link]
↑ McRobbie DW (2007). MRI from picture to proton. Cambridge, UK; New York: Cambridge University Press. ISBN978-0-521-68384-5.
↑ Weishaupt D, Koechli VD, Marincek B (2008). "Chapter 9: Fast Suppression Techniques". How does MRI work?: An Introduction to the Physics and Function of Magnetic Resonance Imaging (2nded.). Springer Science & Business Media. p.70. ISBN978-3-540-37845-7.
↑ Sasaki M, Shibata E, Tohyama K, Takahashi J, Otsuka K, Tsuchiya K, etal. (July 2006). "Neuromelanin magnetic resonance imaging of locus ceruleus and substantia nigra in Parkinson's disease". NeuroReport. 17 (11): 1215–1218. doi:10.1097/01.wnr.0000227984.84927.a7. PMID16837857. S2CID24597825.
This page is based on this Wikipedia article Text is available under the CC BY-SA 4.0 license; additional terms may apply. Images, videos and audio are available under their respective licenses.