Perth—Wellington

Last updated • a couple of secsFrom Wikipedia, The Free Encyclopedia

Perth—Wellington
Flag of Ontario.svg Ontario electoral district
Perth-Wellington.png
Perth—Wellington in relation to other southern Ontario ridings (2013 boundaries)
Federal electoral district
Legislature House of Commons
MP


John Nater
Conservative
District created2003
First contested 2004
Last contested 2021
District webpage profile, map
Demographics
Population (2011) [1] 104,912
Electors (2015)75,217
Area (km²) [2] 3,580.14
Pop. density (per km²)29.3
Census division(s) Perth, Wellington
Census subdivision(s) Minto, Wellington North, North Perth, Mapleton, West Perth, Perth East, Stratford, Perth South, St. Marys

Perth—Wellington is a federal electoral district in southwestern Ontario, Canada, that has been represented in the House of Commons of Canada since 2004. The riding consists of:

Contents

  • Perth County including the City of Stratford and the Town of St Marys, and
  • the Town of Minto, the Townships of Mapleton and Wellington North in the County of Wellington. [3]

Demographics

Canada census – Perth—Wellington community profile
2021 2016 2011
Population113,910 (5.6% from 2016)107,908 (2.9% from 2011)104,912 (1.0% from 2006)
Land area3,580.35 km2 (1,382.38 sq mi)3,580.29 km2 (1,382.36 sq mi)3,580.14 km2 (1,382.30 sq mi)
Population density31.8/km2 (82/sq mi)30.1/km2 (78/sq mi)29.3/km2 (76/sq mi)
Median age41.2 (M: 39.6, F: 42.8)41.4 (M: 40.1, F: 42.7)40.5 (M: 39.1, F: 41.8)
Total private dwellings46,56243,51242,111
Median household income$70,567$63,182
Notes: NHS Profile, Statistics Canada
References: 2021 [4] 2016 [5] 2011 [6] earlier [7] [8]
Visible Minorities and Aboriginals [9]
Group2016 Census2011 Census2006 Census
Population % of totalPopulation % of totalPopulation % of total
Aboriginal1,4501.41,8951.96950.7
Visible Minority3,2603.12,0702.02,0852.0
All other100,81595.598,80096.1101,09597.3
Total105,525100.0102,765100.0103,875100.0
Population by mother tongue [10]
Group2016 Census2011 Census2006 Census
Population % of totalPopulation % of totalPopulation % of total
English91,72586.389,95086.988,62086.4
French5650.56450.66150.6
English and French1000.11000.1450.1
All other13,91013.112,85012.413,24512.9
Total106,300100.0103,545100.0102,525100.0

(Other languages, 2016: 7.8% German, 1.9% Dutch)

Mobility over previous five years
Group2016 Census2011 Census2006 Census
Population % of totalPopulation % of totalPopulation % of total
At the same address68,03068.867,29069.964,01066.7
In the same constituency14,72514.914,62015.215,52516.2
In the same province14,29514.512,88013.314,21514.8
From another province7500.86050.69050.9
From another country1,0001.09101.01,3301.4
Total aged 5 or over98,800100.096,305100.095,980100.0

History

The riding was created in 2003 from parts of Perth—Middlesex (76%), Waterloo—Wellington (17%) and Dufferin—Peel—Wellington—Grey (7%) ridings. It did not undergo any boundary changes in the 2012 electoral redistribution. [11]

Members of Parliament

ParliamentYearsMemberParty
Perth—Wellington
Riding created from Dufferin—Peel—Wellington—Grey,
Perth—Middlesex and Waterloo—Wellington
38th  2004–2006   Gary Schellenberger Conservative
39th  2006–2008
40th  2008–2011
41st  2011–2015
42nd  2015–2019 John Nater
43rd  2019–2021
44th  2021–present

Election results

Graph of election results in Perth—Wellington (minor parties that never got 2% of the vote or didn't run consistently are omitted)
2021 Canadian federal election
PartyCandidateVotes%±%
Conservative John Nater 26,98448.6+2.3
Liberal Brendan Knight13,68424.7-2.4
New Democratic Kevin Kruchkywich9,55217.2+2.6
People's Wayne Baker5,3579.5+7.9
Total valid votes55,57799.3
Total rejected ballots3800.7
Turnout55,95765.8
Eligible voters85,049
Conservative hold Swing +2.4
Source: Elections Canada [12]
2019 Canadian federal election
PartyCandidateVotes%±%Expenditures
Conservative John Nater 25,62246.34+3.42$73,230.45
Liberal Pirie Mitchell15,00227.13-10.44$48,553.60
New Democratic Geoff Krauter8,09414.64-0.32$19,103.41
Green Collan Simmons4,9498.95+6.35none listed
People's Roger Fuhr8941.62+1.19$583.54
Christian Heritage Irma DeVries7331.33-0.21$9,547.05
Total valid votes55,29499.32 
Total rejected ballots3810.68+0.33
Turnout55,67566.68-1.35
Eligible voters83,501
Conservative hold Swing +6.93
Source: Elections Canada [13]
2015 Canadian federal election
PartyCandidateVotes%±%Expenditures
Conservative John Nater 22,25542.92-11.56$125,945.50
Liberal Stephen McCotter19,48037.57+19.59$54,799.08
New Democratic Ethan Rabidoux7,75614.96-6.29$39,763.84
Green Nicole Ramsdale1,3472.60-1.95
Christian Heritage Irma DeVries7941.53-0.21$11,543.38
No AffiliationRoger Fuhr2190.42$28.00
Total valid votes/Expense limit51,85199.61 $208,635.42
Total rejected ballots1860.36-0.03
Turnout52,03768.03+4.56
Eligible voters76,496
Conservative hold Swing -15.58
Source: Elections Canada [14] [15]
2011 Canadian federal election
PartyCandidateVotes%±%Expenditures
Conservative Gary Schellenberger 25,28154.5+6.5$82,570
New Democratic Ellen Papenburg9,86121.3+4.3$17,764
Liberal Bob McTavish8,34118.0-5.7$40,957
Green John Cowling2,1124.6-4.5$4.790
Christian Heritage Irma DeVries8061.7-0.4$8,010
Total valid votes/Expense limit46,401 100.00 $84,700
Total rejected ballots179 
Turnout46,58063.5% 
Eligible voters73,391
Conservative hold Swing +1.1%
2008 Canadian federal election
PartyCandidateVotes%±%Expenditures
Conservative Gary Schellenberger 20,70948.0+1.9$68,139
Liberal Sandra Gardiner10,22523.7-1.9$29,238
New Democratic Kerry McManus7,23417.0-1.8$23,081
Green John Cowling3,8849.0+2.5$13,365
Christian Heritage Irma DeVries8982.1-0.8$8,662
Marxist–Leninist Julian Ichim980.2
Total valid votes/Expense limit43,048100.0  $82,152
Conservative hold Swing +1.9%
2006 Canadian federal election
PartyCandidateVotes%±%
Conservative Gary Schellenberger 22,00446.1+4.1
Liberal David Cunningham12,30125.8-7.6
New Democratic Keith Dinicol8,87618.6+3.0
Green John Cowling3,1176.5+0.3
Christian Heritage Irma DeVries1,3962.9+0.1
Total valid votes 47,694100.0
Conservative hold Swing +5.9%
2004 Canadian federal election
PartyCandidateVotes%
Conservative Gary Schellenberger 18,87942.0
Liberal Brian Innes15,03233.4
New Democratic Robert Roth7,02715.6
Green John Cowling2,7706.2
Christian Heritage Irma Nicolette Devries1,2732.8
Total valid votes44,981 100.0

See also

Related Research Articles

<span class="mw-page-title-main">Abbotsford (electoral district)</span> Federal electoral district in British Columbia, Canada

Abbotsford is a federal electoral district in British Columbia, Canada, that has been represented in the House of Commons of Canada since 2004.

<span class="mw-page-title-main">London West</span> Federal electoral district in Ontario, Canada

London West is a federal electoral district in London, Ontario, Canada, that has been represented in the House of Commons of Canada since 1968.

<span class="mw-page-title-main">Lac-Saint-Louis</span> Federal electoral district in Quebec, Canada

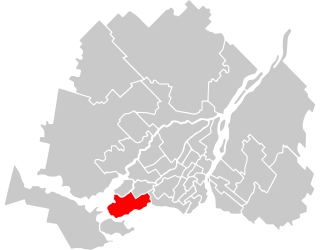
Lac-Saint-Louis is a federal electoral district in Quebec, Canada, that has been represented in the House of Commons of Canada since 1997. Its population was 108,579 at the 2016 Canadian Census.

<span class="mw-page-title-main">Cambridge (federal electoral district)</span> Federal electoral district in Ontario, Canada

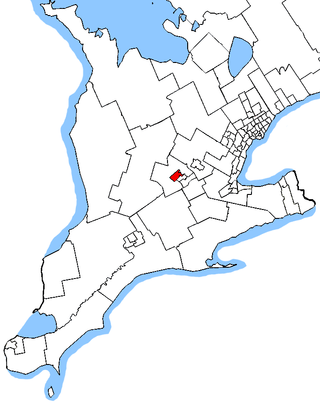
Cambridge is a federal electoral district in Ontario, Canada, that has been represented in the House of Commons of Canada since 1979.

Vancouver South is a federal electoral district in British Columbia, Canada, that has been represented in the House of Commons of Canada from 1917 to 1997, and since 2004. It covers the southern portion of the city of Vancouver, British Columbia.

<span class="mw-page-title-main">Portneuf—Jacques-Cartier</span> Federal electoral district in Quebec, Canada

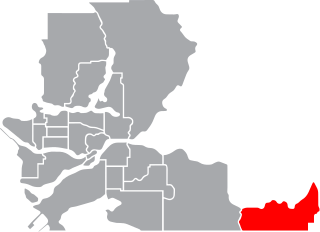
Portneuf—Jacques-Cartier is a federal electoral district in Quebec, Canada, that has been represented in the House of Commons of Canada since 1867. Its population in 2001 was 87,141. It is currently represented by Joël Godin of the Conservative Party of Canada.

North Vancouver is a federal electoral district in the province of British Columbia, Canada, that has been represented in the House of Commons of Canada since 1988.

<span class="mw-page-title-main">Simcoe—Grey</span> Federal electoral district in Ontario, Canada

Simcoe—Grey is a federal electoral district in Ontario, Canada, that has been represented in the House of Commons of Canada since 1997.

<span class="mw-page-title-main">Brantford—Brant</span> Federal electoral district in Ontario, Canada

Brantford—Brant is a federal electoral district in Ontario, Canada, that has been represented in the House of Commons of Canada from 1904 to 1949 and since 1968.

<span class="mw-page-title-main">Scarborough—Agincourt</span> Federal electoral district in Ontario, Canada

Scarborough—Agincourt is a federal electoral district in Toronto, Ontario, Canada that has been represented in the House of Commons of Canada since 1988. It covers the area of the City of Toronto bounded by Steeles Avenue East to the north, Highway 401 to the south, Victoria Park Avenue to the west, and Midland Avenue to the east.

<span class="mw-page-title-main">Burlington (federal electoral district)</span> Federal electoral district in Ontario, Canada

Burlington is a federal electoral district in Halton Region, Ontario, Canada, that has been represented in the House of Commons of Canada since 1979.

<span class="mw-page-title-main">Manicouagan (electoral district)</span> Federal electoral district in Quebec, Canada

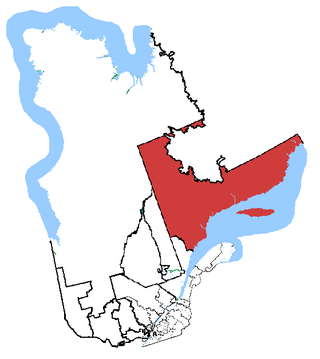
Manicouagan is a federal electoral district in Quebec, Canada, that has been represented in the House of Commons of Canada since 1968.

<span class="mw-page-title-main">Guelph (federal electoral district)</span> Federal electoral district in Ontario, Canada

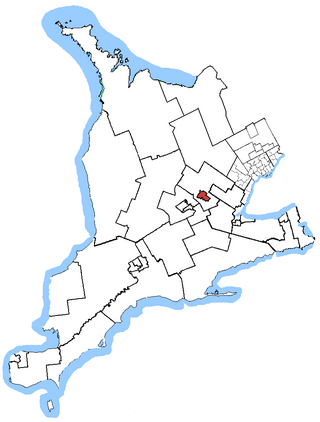
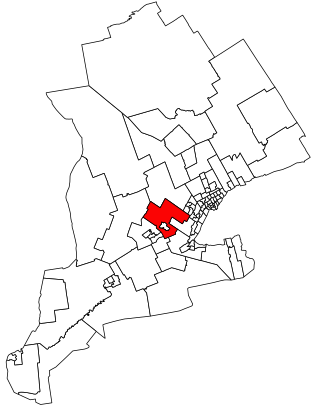
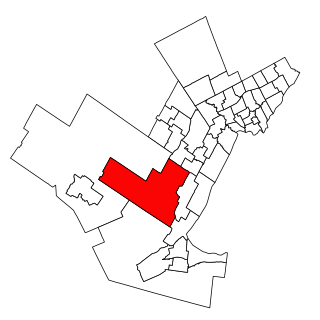
Guelph is a federal electoral district in Ontario, Canada, that has been represented in the House of Commons of Canada since 1979. This riding has had a Liberal MP since 1993.

<span class="mw-page-title-main">Huron—Bruce</span> Federal electoral district in Ontario, Canada

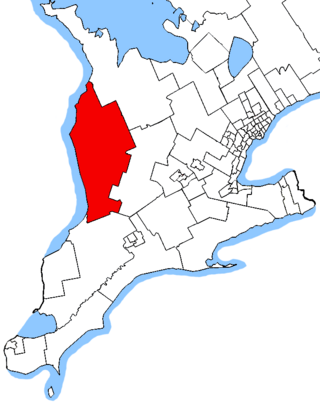
Huron—Bruce is a federal electoral district in Ontario, Canada, that has been represented in the House of Commons of Canada since 1953.

<span class="mw-page-title-main">Wellington—Halton Hills</span> Federal electoral district in Ontario, Canada

Wellington—Halton Hills is a federal electoral district in Ontario, Canada, that has been represented in the House of Commons of Canada since 2004.

<span class="mw-page-title-main">Waterloo (federal electoral district)</span> Federal electoral district in Ontario, Canada

Waterloo is the name of a federal electoral district in the Waterloo Region of Ontario, Canada, that has been used in the House of Commons of Canada from since 1968. Between 1997 and 2015, the riding was known as Kitchener—Waterloo.

<span class="mw-page-title-main">Markham—Stouffville</span> Federal electoral district in Ontario, Canada

Markham—Stouffville is a federal electoral district in Ontario, Canada. It encompasses a portion of Ontario previously included in the electoral districts of Markham—Unionville and Oak Ridges—Markham.

<span class="mw-page-title-main">Perth—Wellington (provincial electoral district)</span> Provincial electoral district in Ontario, Canada

Perth—Wellington is a provincial electoral district in Ontario, Canada, that has been represented in the Legislative Assembly of Ontario since the 2007 provincial election.

<span class="mw-page-title-main">Milton (federal electoral district)</span> Federal electoral district in Ontario, Canada

Milton is a federal electoral district in Ontario, Canada, that consists of the town of Milton and part of Burlington which has a population growing much faster than the Ontario average. It was created by the 2012 federal redistribution and previously part of Halton. Redistributed results showed that Conservative Lisa Raitt won the area easily in 2011, although her vote share dropped in the 2015 election and the Liberals took the riding in 2019. Since 2019 it has been represented by Liberal Adam van Koeverden.

<span class="mw-page-title-main">Mississauga—Erin Mills</span> Federal electoral district in Ontario, Canada

Mississauga—Erin Mills is a federal electoral district in Ontario. It encompasses a portion of Ontario formerly included in the electoral district of Mississauga—Erindale.

References

  1. Statistics Canada: 2011
  2. Statistics Canada: 2011
  3. "Perth–Wellington | Maps Corner | Elections Canada Online". elections.ca. Retrieved 17 August 2015.
  4. "2021 Community Profiles". 2021 Canadian Census . Statistics Canada. 4 February 2022. Retrieved 13 May 2022.
  5. "2016 Community Profiles". 2016 Canadian Census . Statistics Canada. 12 August 2021. Retrieved 22 August 2021.
  6. "2011 Community Profiles". 2011 Canadian Census . Statistics Canada. 21 March 2019. Retrieved 8 September 2015.
  7. "2006 Community Profiles". 2006 Canadian Census . Statistics Canada. 20 August 2019.
  8. "2001 Community Profiles". 2001 Canadian Census . Statistics Canada. 18 July 2021.
  9. in private households
  10. excluding institutional residents
  11. "Perth - Wellington". CBC News. CBC. 2008. Retrieved 8 March 2017.
  12. "List of confirmed candidates – September 20, 2021 Federal Election". Elections Canada . Retrieved 2 September 2021.
  13. "Official Voting Results". Elections Canada. Retrieved 10 August 2021.
  14. Elections Canada – Confirmed candidates for Perth—Wellington, 30 September 2015
  15. Elections Canada – Preliminary Election Expenses Limits for Candidates

43°48′04″N80°56′20″W / 43.801°N 80.939°W / 43.801; -80.939