Quercus kelloggii, the California black oak, also known as simply black oak, or Kellogg oak, is an oak in the red oak section, native to western North America. It is a close relative of the black oak found in eastern and central North America.

The snowshoe hare, also called the varying hare, or snowshoe rabbit, is a species of hare found in North America. It has the name "snowshoe" because of the large size of its hind feet. The animal's feet prevent it from sinking into the snow when it hops and walks. Its feet also have fur on the soles to protect it from freezing temperatures.

The eastern towhee is a large New World sparrow. The taxonomy of the towhees has been under debate in recent decades, and formerly this bird and the spotted towhee were considered a single species, the rufous-sided towhee.
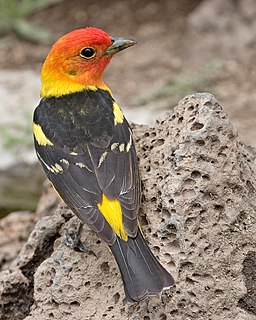
The western tanager, is a medium-sized American songbird. Formerly placed in the tanager family (Thraupidae), it and other members of its genus are now classified in the cardinal family (Cardinalidae). The species's plumage and vocalizations are similar to other members of the cardinal family.

Thinning is a term used in agricultural sciences to mean the removal of some plants, or parts of plants, to make room for the growth of others. Selective removal of parts of a plant such as branches, buds, or roots is typically known as pruning.

Silviculture is the practice of controlling the growth, composition, health, and quality of forests to meet diverse needs and values.

An old-growth forest — also termed primary forest, virgin forest, primeval forest, late seral forest, or forest primeval — is a forest that has attained great age without significant disturbance and thereby exhibits unique ecological features and might be classified as a climax community. Old-growth features include diverse tree-related structures that provide diverse wildlife habitat that increases the biodiversity of the forested ecosystem. The concept of diverse tree structure includes multi-layered canopies and canopy gaps, greatly varying tree heights and diameters, and diverse tree species and classes and sizes of woody debris.
This article is the index of forestry topics.
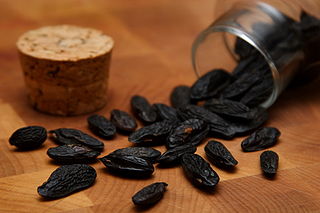
Dipteryx odorata is a species of flowering tree in the pea family, Fabaceae. The tree is native to Central America and northern South America. Its seeds are known as tonka beans. They are black and wrinkled and have a smooth, brown interior. They have a strong fragrance similar to sweet woodruff due to their high content of coumarin.
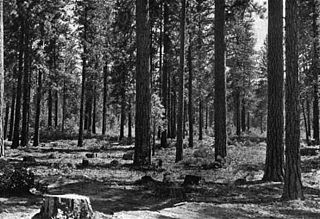
Selection cutting is the silvicultural practice of harvesting trees in a way that moves a forest stand towards an uneven-aged or all-aged condition, or 'structure'. Using stocking models derived from the study of old growth forests, '"Selection cutting"', also known as 'selection system', or 'selection silviculture', manages the establishment, continued growth and final harvest of multiple age classes of trees within a stand. A closely related approach to forest management is Continuous Cover Forestry (CCF), which makes use of selection systems to achieve a permanently irregular stand structure.
The following outline is provided as an overview of and guide to forestry:
Basal area is the area of a given section of land that is occupied by the cross-section of tree trunks and stems at the base. The term is used in forest management and forest ecology.
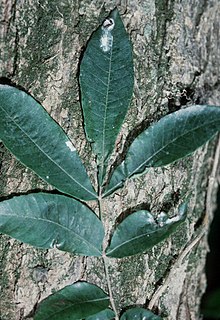
Carya aquatica, the bitter pecan or water hickory, is a large tree, that can grow over 30 metres (98 ft) tall of the Juglandaceae or walnut family. In the American South it is a dominant plant species found on clay flats and backwater areas near streams and rivers. The species reproduces aggressively both by seed and sprouts from roots and from stumps of cut trees. Water hickory is a major component of wetland forests now in the south eastern US, because of the selective cutting of more desirable tree species for the lumber industry. It is considered important in cleansing drainage waters since the plants slow water flow during flooding, allowing sediments to fall out of the water column. This tree species is tolerant of wet soils but grows best on well draining soils near rivers and other water ways.
Site index is a term used in forestry to describe the potential for forest trees to grow at a particular location or "site." Site is defined as “The average age of dominate and/or codominate trees of an even-aged, undisturbed site of intolerant trees at a base age”; furthermore, the word site is used in forestry to refer to a distinct area where trees are found. Site index is used to measure the productivity of the site and the management options for that site and reports the height of dominant and co-dominant trees in a stand at a base age such as 25, 50 and 100 years. For example, a red oak with an age of 50 years and a height of 70 feet (21 m) will have a site index of 70. Site index is species specific. Common methods used to determine site index are based on tree height, plant composition and the use of soil maps.
Forest inventory is the systematic collection of data and forest information for assessment or analysis. An estimate of the value and possible uses of timber is an important part of the broader information required to sustain ecosystems. When taking forest inventory the following are important things to measure and note: species, diameter at breast height (DBH), height, site quality, age, and defects. From the data collected one can calculate the number of trees per acre, the basal area, the volume of trees in an area, and the value of the timber. Inventories can be done for other reasons than just calculating the value. A forest can be cruised to visually assess timber and determine potential fire hazards and the risk of fire. The results of this type of inventory can be used in preventive actions and also awareness. Wildlife surveys can be undertaken in conjunction with timber inventory to determine the number and type of wildlife within a forest. The aim of the statistical forest inventory is to provide comprehensive information about the state and dynamics of forests for strategic and management planning. Merely looking at the forest for assessment is called taxation.
Stand density index is a measure of the stocking of a stand of trees based on the number of trees per unit area and diameter at breast height (DBH) of the tree of average basal area, also known as the quadratic mean diameter. It may also be defined as the degree of crowding within stocked areas, using various growing space ratios based on crown length or diameter, tree height or diameter, and spacing. Stand density index is usually well correlated with stand volume and growth, and several variable-density yield tables have been created using it. Basal area, however, is usually satisfactory as a measure of stand density index and because it is easier to calculate it is usually preferred over SDI. Stand density index is also the basis for Stand density management diagrams.

A plot is a graphical technique for representing a data set, usually as a graph showing the relationship between two or more variables. The plot can be drawn by hand or by a mechanical or electronic plotter. Graphs are a visual representation of the relationship between variables, very useful for humans who can quickly derive an understanding which would not come from lists of values. Graphs can also be used to read off the value of an unknown variable plotted as a function of a known one. Graphs of functions are used in mathematics, sciences, engineering, technology, finance, and other areas.

Belt Woods is a nature reserve in Prince George's County, Maryland, U.S., containing the "South Woods", a 43-acre (170,000 m2) woodland which constitutes one of the last stands of old growth hardwood forest on the Atlantic coastal plain. It is a mere 8 miles (13 km) east of Washington, D.C. Many of its white oaks and tulip poplars are more than three feet in diameter and soar more than 100 feet (30 m) before branching. The "South Woods" were designated a National Natural Landmark in 1974.
In forestry, stocking is a quantitative measure of the area occupied by trees, usually measured in terms of well-spaced trees or basal area per hectare, relative to an optimum or desired level of density. A desirable level of stocking is often considered that which maximizes timber production, or other management objectives.
Forest growth models are mathematical or computer models to project the future state and yields of forest stands or forest trees, over a time scale of from a few years to many decades.


