Elections to Watford Borough Council were held on 10 June 2004. One third of the council was up for election and the Liberal Democrat party kept overall control of the council. Overall turnout was 39.3%.
Watford is a town and borough in Hertfordshire, England, 15 miles (24 km) northwest of central London.
The Liberal Democrats are a liberal political party in the United Kingdom. It is currently led by Vince Cable. They have 11 Members of Parliament in the House of Commons, 96 members of the House of Lords, one member of the European Parliament, five Members of the Scottish Parliament and one member in the Welsh Assembly and London Assembly. At the height of its influence, the party formed a coalition government with the Conservative Party from 2010 to 2015 with its leader Nick Clegg serving as Deputy Prime Minister.
After the election, the composition of the council was
The Labour Party is a centre-left political party in the United Kingdom that has been described as an alliance of social democrats, democratic socialists and trade unionists. The party's platform emphasises greater state intervention, social justice and strengthening workers' rights.
The Conservative Party, officially the Conservative and Unionist Party, is a centre-right political party in the United Kingdom. The governing party since 2010, it is the largest in the House of Commons, with 313 Members of Parliament, and also has 249 members of the House of Lords, 18 members of the European Parliament, 31 Members of the Scottish Parliament, 12 members of the Welsh Assembly, eight members of the London Assembly and 8,916 local councillors.
The Green Party of England and Wales is a green, left-wing political party in England and Wales. Headquartered in London, since September 2018, its co-leaders are Siân Berry and Jonathan Bartley. The Green Party has one representative in the House of Commons, one in the House of Lords, and three in the European Parliament. In addition, it has various councillors in UK local government and two members of the London Assembly.
Party | Seats | Gains | Losses | Net gain/loss | Seats % | Votes % | Votes | +/− | |
---|---|---|---|---|---|---|---|---|---|
Liberal Democrat | 10 | +6 | 83.3 | 44.5 | 10,514 | -4.7% | |||
Conservative | 1 | -3 | 8.3 | 25.9 | 6,118 | +4.5% | |||
Green | 1 | +1 | 8.3 | 10.5 | 2,473 | +2.0% | |||
Labour | 0 | -4 | 0 | 19.1 | 4,516 | -0.9% | |||
Party | Candidate | Votes | % | ± | |
---|---|---|---|---|---|
Green | Kenneth Brodhurst | 1,034 | 57.3 | +3.9 | |
Labour | Richard Short | 309 | 17.1 | +4.8 | |
Liberal Democrat | Paul Salter | 256 | 14.2 | -15.0 | |
Conservative | Jonathan Cordell | 207 | 11.5 | +6.4 | |
Majority | 725 | 40.2 | +16.0 | ||
Turnout | 1,806 | 36.6 | |||
Party | Candidate | Votes | % | ± | |
---|---|---|---|---|---|
Liberal Democrat | Rabi Martins | 820 | 50.1 | -4.4 | |
Labour | Nnagbogu Akubue | 323 | 19.7 | -6.2 | |
Conservative | Geoffrey Greenstreet | 293 | 17.9 | +5.9 | |
Green | Ruth Atkin | 200 | 12.2 | +7.4 | |
Majority | 497 | 30.4 | +1.8 | ||
Turnout | 1,636 | 32.7 | |||
Party | Candidate | Votes | % | ± | |
---|---|---|---|---|---|
Liberal Democrat | Jennifer McGovern | 770 | 42.1 | -8.7 | |
Labour | Nigel Bell | 750 | 41.0 | +0.9 | |
Conservative | Carole Bamford | 203 | 11.1 | +4.8 | |
Green | Martin Wiesner | 106 | 5.8 | +4.5 | |
Majority | 20 | 1.1 | -9.6 | ||
Turnout | 1,829 | 35.9 | |||
Party | Candidate | Votes | % | ± | |
---|---|---|---|---|---|
Liberal Democrat | Khalid Mahmood | 838 | 42.5 | -3.5 | |
Conservative | Stephen O'Brien | 654 | 33.1 | +1.9 | |
Labour | Andrew Head | 320 | 16.2 | -0.7 | |
Green | Christine Stockwell | 162 | 8.2 | +2.3 | |
Majority | 184 | 9.4 | -5.4 | ||
Turnout | 1,974 | 38.0 | |||
Party | Candidate | Votes | % | ± | |
---|---|---|---|---|---|
Liberal Democrat | Janice Brown | 790 | 41.8 | -9.5 | |
Labour | Linda Smith | 580 | 30.7 | +0.7 | |
Conservative | Richard Southern | 382 | 20.2 | +9.8 | |
Green | Jenny Woods | 138 | 7.3 | +5.3 | |
Majority | 210 | 11.1 | -10.2 | ||
Turnout | 1,890 | 36.3 | |||
Party | Candidate | Votes | % | ± | |
---|---|---|---|---|---|
Conservative | Andrew Mortimer | 1,285 | 54.4 | +5.0 | |
Liberal Democrat | Mark Watkin | 660 | 28.0 | -8.0 | |
Labour | Thomas Meldrum | 273 | 11.6 | +1.9 | |
Green | Carole Skinner | 143 | 6.1 | +1.2 | |
Majority | 625 | 26.4 | +13.0 | ||
Turnout | 2,361 | 44.2 | |||
Party | Candidate | Votes | % | ± | |
---|---|---|---|---|---|
Liberal Democrat | Anthony Poole | 1,269 | 64.1 | -4.3 | |
Conservative | David Ealey | 433 | 21.9 | +3.4 | |
Labour | Michael Jones | 180 | 9.1 | -0.3 | |
Green | Clive Skinner | 99 | 5.0 | +1.2 | |
Majority | 839 | 42.2 | -7.7 | ||
Turnout | 1,981 | 41.2 | |||
Party | Candidate | Votes | % | ± | |
---|---|---|---|---|---|
Liberal Democrat | George Derbyshire | 1,358 | 51.7 | +4.2 | |
Conservative | David Wright | 1,025 | 39.0 | -3.6 | |
Labour | Mavis Tyrwhitt | 153 | 5.8 | -0.4 | |
Green | Elaine Edwards | 93 | 3.5 | -0.2 | |
Majority | 333 | 12.7 | +7.8 | ||
Turnout | 2,629 | 53.2 | |||
Party | Candidate | Votes | % | ± | |
---|---|---|---|---|---|
Liberal Democrat | Andrew Wylie | 1,023 | 55.4 | -10.3 | |
Conservative | Roger Frost | 454 | 24.6 | +7.7 | |
Labour | Geoffrey Cullen | 257 | 13.9 | -1.1 | |
Green | Kevin Pettifer | 112 | 6.1 | +3.7 | |
Majority | 569 | 30.8 | -18.0 | ||
Turnout | 1,846 | 36.8 | |||
Party | Candidate | Votes | % | ± | |
---|---|---|---|---|---|
Liberal Democrat | Hugh O'Hanlon | 999 | 50.4 | +12.1 | |
Conservative | Richard Bamford | 586 | 29.6 | -4.5 | |
Labour | Frances Hince | 276 | 13.9 | -9.8 | |
Green | Anna Rackett | 121 | 6.1 | +2.2 | |
Majority | 413 | 20.8 | +16.6 | ||
Turnout | 1,982 | 43.6 | |||
Party | Candidate | Votes | % | ± | |
---|---|---|---|---|---|
Liberal Democrat | Mohammed Ajab | 848 | 40.6 | -10.4 | |
Labour | Jagtar Dhindsa | 786 | 37.7 | +5.0 | |
Conservative | Mark Bunn | 286 | 13.7 | +5.0 | |
Green | David Degen | 167 | 8.0 | +0.5 | |
Majority | 62 | 2.9 | -15.4 | ||
Turnout | 2,087 | 41.0 | |||
Party | Candidate | Votes | % | ± | |
---|---|---|---|---|---|
Liberal Democrat | Ian Brown | 883 | 55.2 | -5.1 | |
Conservative | William Hodnett | 310 | 19.4 | +8.1 | |
Labour | Marion Chambers | 309 | 19.3 | -5.5 | |
Green | Sally Ivins | 98 | 6.1 | +2.6 | |
Majority | 573 | 35.8 | +0.3 | ||
Turnout | 1,600 | 32.2 | |||
Elections to Watford Borough Council were held on 7 May 1998. One third of the council was up for election and the Labour party stayed in overall control of the council.
Elections to Watford Borough Council were held on 4 May 2000. One third of the council was up for election and the Labour party lost overall control of the council to no overall control.
Elections to Watford Borough Council were held on 2 May 2002. One third of the council was up for election and the council stayed under no overall control. At the same time an election for a directly elected mayor was held, which was won by the Liberal Democrat Dorothy Thornhill.
Elections to Watford Borough Council were held on 1 May 2003. One third of the council was up for election and the Liberal Democrats gained overall control of the council from no overall control. Overall turnout was 32.05%.
Elections to Watford Borough Council were held on 4 May 2006. One third of the council was up for election and the Liberal Democrat party kept overall control of the council. At the same time in the election for Watford's directly elected mayor the Liberal Democrat Dorothy Thornhill was re-elected.
Elections to Watford Borough Council were held on 3 May 2007. One third of the council was up for election and the Liberal Democrat party kept overall control of the council.
Elections to Watford Council were held on 1 May 2008. One third of the council was up for election and the Liberal Democrat party stayed in overall control of the council.
Elections to Three Rivers District Council were held on 1 May 2008. One-third of the council was up for election. The Liberal Democrats won the most seats, despite the Conservatives winning more votes. The Conservatives also gained a seat, strengthening their position against the Liberal Democrats, who remained stayed in overall control of Three Rivers.
The 2004 St Albans City and District Council election took place on 10 June 2004 to elect members of St Albans District Council in Hertfordshire, England. One third of the council was up for election and the council stayed under no overall control.
The 2004 Winchester Council election took place on 10 June 2004 to elect members of Winchester District Council in Hampshire, England. One third of the council was up for election and the Liberal Democrats lost overall control of the council to no overall control.
The 2003 Welwyn Hatfield District Council election took place on 1 May 2003 to elect members of Welwyn Hatfield District Council in Hertfordshire, England. One third of the council was up for election and the Conservative party stayed in overall control of the council.
The 2004 Welwyn Hatfield District Council election took place on 10 June 2004 to elect members of Welwyn Hatfield District Council in Hertfordshire, England. One third of the council was up for election and the Conservative party stayed in overall control of the council.
The 2007 Welwyn Hatfield Borough Council election took place on 3 May 2007 to elect members of Welwyn Hatfield Borough Council in Hertfordshire, England. One third of the council was up for election and the Conservative party stayed in overall control of the council.
The Mayor of Watford is the head of the borough council of Watford, Hertfordshire, England. The holder of the position is a directly-elected mayor using the supplementary vote every four years. The current Mayor of Watford is Peter Taylor, who was elected in May 2018 for the Liberal Democrats.
The 2004 Harrogate Council election took place on 10 June 2004 to elect members of Harrogate Borough Council in North Yorkshire, England. One third of the council was up for election and the Conservative party stayed in overall control of the council.
The 2006 Hertsmere Borough Council election took place on 4 May 2006 to elect members of Hertsmere Borough Council in Hertfordshire, England. One third of the council was up for election and the Conservative party stayed in overall control of the council.
Elections to Watford Borough Council were held on 3 May 2012. Three years in every four, a third of the council retires and elections are held.
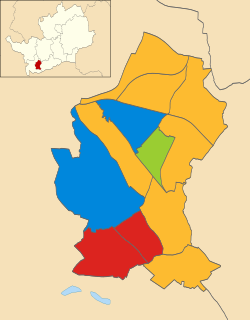
Elections to Watford Borough Council were held on 6 May 2010. Three years in every four, a third of the council retires and elections are held. The council election was held on the same day as the national General Election, when the Labour Party government lost power and the Watford parliamentary constituency was won by the Conservative Party.
Elections to Watford Borough Council in England were held on 5 May 2011. Three years in every four, a third of the council retires and elections are held.
The 2018 Watford Borough Council election took place on 3 May 2018 to elect members of Watford Borough Council in England. This was the same day as other local elections.