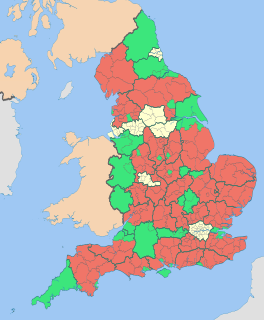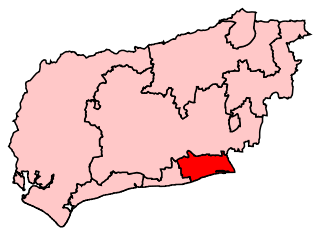
The 2016 Adur District Council elections took place on 5 May 2016 to elect members of Adur District Council in West Sussex, England. Half of the council was up for election, and the Conservative Party remained in overall control of the council. The Labour Party trebled their number of seats from one to three. [1]
Non-metropolitan districts, or colloquially "shire districts", are a type of local government district in England. As created, they are sub-divisions of non-metropolitan counties in a two-tier arrangement.
West Sussex is a county in the south of England, bordering East Sussex to the east, Hampshire to the west and Surrey to the north, and to the south the English Channel.
England is a country that is part of the United Kingdom. It shares land borders with Wales to the west and Scotland to the north-northwest. The Irish Sea lies west of England and the Celtic Sea lies to the southwest. England is separated from continental Europe by the North Sea to the east and the English Channel to the south. The country covers five-eighths of the island of Great Britain, which lies in the North Atlantic, and includes over 100 smaller islands, such as the Isles of Scilly and the Isle of Wight.
After the election, the composition of the council was
The Conservative Party, officially the Conservative and Unionist Party, is a centre-right political party in the United Kingdom. Presently led by Theresa May, it has been the governing party since 2010. It presently has 314 Members of Parliament in the House of Commons, 249 members of the House of Lords, and 18 members of the European Parliament. It also has 31 Members of the Scottish Parliament, 12 members of the Welsh Assembly, eight members of the London Assembly and 9,008 local councillors. One of the major parties of UK politics, it has formed the government on 45 occasions, more than any other party.
The Labour Party is a centre-left political party in the United Kingdom which has been described as an alliance of social democrats, democratic socialists and trade unionists. The party's platform emphasises greater state intervention, social justice and strengthening workers' rights.
Party | Seats | Gains | Losses | Net gain/loss | Seats % | Votes % | Votes | +/− | |
---|---|---|---|---|---|---|---|---|---|
Conservative | 7 | 0 | 3 | 0 | 46.7 | 35.8 | 5729 | ||
UKIP | 4 | 0 | 1 | 0 | 26.7 | 23.0 | 3687 | ||
Labour | 3 | 3 | 0 | 0 | 20.0 | 24.4 | 3912 | ||
Independent | 1 | 1 | 0 | 0 | 6.7 | 6.5 | 1036 | ||
Liberal Democrat | 0 | 0 | 0 | 0 | 0.0 | 7.2 | 1149 | ||
Green | 0 | 0 | 0 | 0 | 0.0 | 3.1 | 489 | ||
Party | Candidate | Votes | % | ± | |
---|---|---|---|---|---|
Conservative | Kevin Boram | 520 | 52.4% | -8.4% | |
Labour | Michael Thornton | 195 | 19.7% | +2.1% | |
UKIP | Darren Compton | 133 | 13.4% | -0.1% | |
Liberal Democrat | Cyril Cannings | 69 | 7.0% | -1.1% | |
Green | Leslie Groves Williams | 68 | 6.9% | +6.9% | |
Majority | 325 | 32.8% | -10.4% | ||
Turnout | 992 | 31.9% | +1.8% | ||
Conservative hold | Swing | 5.3% Con to Lab | |||
Party | Candidate | Votes | % | ± | |
---|---|---|---|---|---|
UKIP | Robin Monk | 393 | 33.8% | -2.2% | |
Conservative | Pat Beresford | 362 | 31.1% | -5.0% | |
Labour | Daniel Ballance | 267 | 22.9% | +22.9% | |
Liberal Democrat | Steve Creed | 123 | 10.6% | -17.3% | |
Majority | 31 | 2.7% | +2.7% | ||
Turnout | 1,164 | 34.2% | +8.3% | ||
UKIP gain from Conservative | Swing | 1.4% Con to UKIP | |||
Party | Candidate | Votes | % | ± | |
---|---|---|---|---|---|
Labour | Barry Mear | 376 | 33.3% | -6.1% | |
UKIP | Mick Clark | 358 | 31.7% | +12.6% | |
Conservative | Paul Mansfield | 328 | 29.1% | -6.3% | |
Liberal Democrat | Raj Dooraree | 58 | 5.1% | -0.8% | |
Majority | 18 | 1.6% | -2.7% | ||
Turnout | 1,128 | 33.6% | +4.5% | ||
Labour hold | Swing | 9.4% Lab to UKIP | |||
Party | Candidate | Votes | % | ± | |
---|---|---|---|---|---|
Labour | Les Alden | 429 | 39.6% | +5.8% | |
Conservative | Dave Donaldson | 405 | 37.4% | 0.0% | |
UKIP | Louise Hearne | 189 | 17.5% | +4.8% | |
Green | Patrick Ginnelly | 49 | 4.5% | -4.4% | |
Majority | 24 | 2.2% | +2.2% | ||
Turnout | 1,083 | 32.0% | +3.0% | ||
Labour gain from Conservative | Swing | 2.9% Con to Lab | |||
Party | Candidate | Votes | % | ± | |
---|---|---|---|---|---|
Conservative | Angus Dunn | 551 | 51.5% | +0.5% | |
Labour | Steve Gilbert | 253 | 23.6% | -3.8% | |
UKIP | Jenny Greig | 186 | 17.4% | +2.1% | |
Green | Helen Mears | 40 | 3.7% | +3.7% | |
Liberal Democrat | Keith Humphrey | 37 | 3.5% | -2.7% | |
Majority | 298 | 27.9% | +4.3% | ||
Turnout | 1,070 | 31.8% | +3.0% | ||
Conservative hold | Swing | 2.2% Lab to Con | |||
Party | Candidate | Votes | % | ± | |
---|---|---|---|---|---|
Conservative | Carson Albury | 461 | 37.1% | -3.8% | |
UKIP | Jason Lock | 316 | 25.5% | -8.4% | |
Labour | John Ballance | 198 | 16.0% | +0.6% | |
Independent | Keith Dollemore | 168 | 13.5% | +13.5% | |
Liberal Democrat | Steve Martin | 77 | 6.2% | -3.5% | |
Majority | 145 | 11.6% | +4.8% | ||
Turnout | 1,241 | 38.1% | +8.1% | ||
Conservative hold | Swing | 2.3% UKIP to Con | |||
Party | Candidate | Votes | % | ± | |
---|---|---|---|---|---|
Independent | Joss Loader | 868 | 67.8% | +0.8% | |
Labour | Adrienne Lowe | 191 | 14.9% | +2.6% | |
UKIP | Darren Compton | 151 | 11.8% | -2.0% | |
Liberal Democrat | Tom Hilditch | 57 | 4.4% | -2.6% | |
Majority | 677 | 52.9% | -0.3% | ||
Turnout | 1,281 | 36.2% | +11.2% | ||
Independent hold | Swing | 0.9% Ind to Lab | |||
Party | Candidate | Votes | % | ± | |
---|---|---|---|---|---|
UKIP | Liz Haywood | 398 | 41.6% | +17.4% | |
Conservative | Neil Maguinness | 212 | 22.3% | -12.0% | |
Labour | Douglas Bradley | 184 | 19.3% | -2.9% | |
Liberal Democrat | Doris Martin | 146 | 15.4% | -3.9% | |
Majority | 186 | 19.6% | +19.6% | ||
Turnout | 951 | 28.4% | +4.6% | ||
UKIP hold | Swing | 9.9% Con to UKIP | |||
Party | Candidate | Votes | % | ± | |
---|---|---|---|---|---|
Conservative | George Barton | 491 | 45.4% | +2.3% | |
UKIP | Ray McLeod | 322 | 29.8% | +9.2% | |
Labour | Alun Jones | 194 | 17.9% | -11.5% | |
Liberal Democrat | Nilda Dooraree | 67 | 6.2% | -0.7% | |
Majority | 169 | 15.6% | +1.9% | ||
Turnout | 1,081 | 31.6% | +6.6% | ||
Conservative hold | Swing | 3.5% Con to UKIP | |||
Party | Candidate | Votes | % | ± | |
---|---|---|---|---|---|
UKIP | Paul Graysmark | 301 | 30.9% | +15.8% | |
Conservative | Tony Nicklen | 289 | 29.7% | -8.3% | |
Labour | Kieran Francis | 281 | 28.9% | -8.2% | |
Liberal Democrat | Drew Tinsley | 95 | 9.7% | -0.1% | |
Majority | 12 | 1.2% | +1.2% | ||
Turnout | 973 | 33.5% | +4.6% | ||
UKIP gain from Conservative | Swing | 12.1% Con to UKIP | |||
Party | Candidate | Votes | % | ± | |
---|---|---|---|---|---|
Conservative | Peter Metcalfe | 530 | 50.0% | -3.1% | |
Labour | David Bowen | 252 | 23.8% | -0.9% | |
UKIP | Bill Jarman | 142 | 13.4% | +0.6% | |
Liberal Democrat | David Edey | 67 | 6.3% | -3.1% | |
Green | Annie Brown | 65 | 6.1% | +6.1% | |
Majority | 278 | 26.2% | -2.2% | ||
Turnout | 1,061 | 31.5% | +1.8% | ||
Conservative hold | Swing | 1.1% Con to Lab | |||
Party | Candidate | Votes | % | ± | |
---|---|---|---|---|---|
Labour | Sami Zeglam | 401 | 33.4% | +7.2% | |
Conservative | Cindy Golds | 374 | 31.1% | -4.5% | |
UKIP | Sean Ridley | 176 | 14.7% | +3.8% | |
Green | Paul Hendy | 154 | 12.8% | -9.0% | |
Liberal Democrat | Nevvy Merrett | 89 | 7.4% | +2.0% | |
Majority | 27 | 2.2% | +2.2% | ||
Turnout | 1,201 | 32.8% | +5.3% | ||
Labour gain from Conservative | Swing | 5.9% Con to Lab | |||
Party | Candidate | Votes | % | ± | |
---|---|---|---|---|---|
Conservative | Brian Coomber | 590 | 48.0% | -2.0% | |
Labour | Irene Reed | 292 | 23.7% | +0.1% | |
UKIP | Jean Turner | 116 | 9.4% | -3.6% | |
Green | Louise Miller | 113 | 9.2% | +9.2% | |
Liberal Democrat | Jan Kimber | 108 | 8.8% | -4.6% | |
Majority | 298 | 24.2% | -2.2% | ||
Turnout | 1,230 | 39.7% | +13.3% | ||
Conservative hold | Swing | 1.1% Con to Lab | |||
Party | Candidate | Votes | % | ± | |
---|---|---|---|---|---|
Conservative | Ann Bridges | 616 | |||
UKIP | Clive Burghard | 506 | |||
UKIP | Gloria Eveleigh | 492 | |||
Conservative | Nicholas Pigott | 411 | |||
Labour | Lee Cowen | 399 | |||
Labour | Jacqueline Pilkington | 366 | |||
Liberal Democrat | Andrew Serhan | 156 | |||
Turnout | 36.9 | +9.3 | |||
Conservative hold | Swing | ||||
UKIP gain from Conservative | Swing | ||||
East Worthing and Shoreham is a constituency represented in the House of Commons of the UK Parliament since 1997 by Tim Loughton of the Conservative Party.
Half of Adur District Council in West Sussex, England is elected every two years. Until 2003, the council was elected by thirds. Since the last boundary changes in 2004, 29 councillors have been elected from 14 wards.
Local government elections took place in England (only) on Thursday 4 May 2006. Polling stations were open between 7:00 and 22:00.
The first elections to the new local authorities established by the Local Government Act 1972 in England and Wales and the new Northern Ireland district councils created by the Local Government Act 1972 took place in 1973. Elections to the existing Greater London Council also took place.
The 1998 Adur District Council election took place on 7 May 1998 to elect members of Adur District Council in West Sussex, England. One third of the council was up for election and the Liberal Democrats stayed in overall control of the council.
The 1998 Adur District Council election took place on 6 May 1999 to elect members of Adur District Council in West Sussex, England. One third of the council was up for election and the Liberal Democrat party lost overall control of the council to no overall control.
Elections to Adur District Council were held on 4 May 2000. One third of the council was up for election and the council stayed under no overall control. Overall turnout was 36.5%.
Elections to Adur District Council were held on 2 May 2002. One third of the council was up for election and the Conservative party gained control of the council from no overall control. Overall turnout was 33%.
Elections to Adur District Council were held on 1 May 2003. One third of the council was up for election and the Conservative party held overall control of the council. Overall turnout was 31.7%.
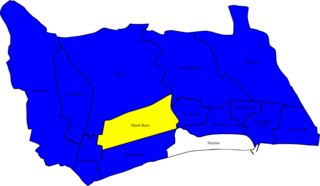
Elections to Adur District Council were held on 4 May 2006. Half of the council was up for election and the Conservative party held overall control of the council.
Elections to Adur District Council in West Sussex, England were held on 1 May 2008. Half of the council was up for election and the Conservative party held overall control of the council.
The 2008 Worthing Borough Council election took place on 1 May 2008 to elect members of Worthing Borough Council in West Sussex, England. One third of the council was up for election and the Conservative party stayed in overall control of the council. Overall turnout was 35%.
The 2010 Adur District Council election took place on 6 May 2010 to elect members of Adur District Council in West Sussex, England. Half of the council was up for election and the Conservative party stayed in overall control of the council.
The 2011 United Kingdom local elections were held on Thursday 5 May 2011. In England, direct elections were held in all 36 Metropolitan boroughs, 194 Second-tier district authorities, 49 unitary authorities and various mayoral posts, meaning local elections took place in all parts of England with the exception of seven unitary authorities, and seven districts and boroughs. For the majority of English districts and the 25 unitary authorities that are elected "all out" these were the first elections since 2007. In Northern Ireland, there were elections to all 26 local councils. Elections also took place to most English parish councils.
Local elections were held in the United Kingdom on 3 May 1979. The results provided some source of comfort to the Labour Party (UK), who recovered some lost ground from local election reversals in previous years, despite losing the general election to the Conservative Party on the same day.
Local elections were held in the United Kingdom in 1980. These were the first annual local elections for the new Conservative Prime Minister Margaret Thatcher. Though the Conservatives in government lost seats, the projected share of the vote was close: Labour Party 42%, Conservative Party 40%, Liberal Party 13%. Labour were still being led by the former prime minister James Callaghan, who resigned later in the year to be succeeded by Michael Foot.
The 2012 Adur District Council elections took place on 3 May 2012 to elect members of Adur District Council in West Sussex, England. Half of the council was up for election, and the Conservative Party remained in overall control of the council.
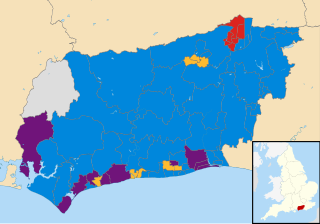
The West Sussex County Council election, 2013 took place on 2 May 2013, as part of the United Kingdom local elections, 2013. All 71 electoral divisions were up for election, which returned one county councillor each by first-past-the-post voting for a four-year term of office. At this election, the Conservative Party was seeking to retain overall control of the council, and the Liberal Democrats to maintain their position as the main opposition party.
The 2015 United Kingdom local elections were held on Thursday 7 May 2015, the same day as the general election for the House of Commons of the United Kingdom.
The 2018 Adur District Council elections took place on 3 May 2018 to elect members of Adur District Council in West Sussex, England. The election saw half of the Council's 29 seats up for election, and resulted in the Conservative Party retaining their majority on the council. Labour gained 4 seats to replace UKIP as the official opposition on the Council, who lost all the seats they were defending from 2014.