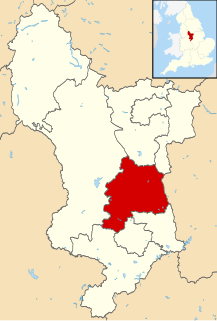
The 2000 Amber Valley Borough Council election took place on 4 May 2000 to elect members of Amber Valley Borough Council in Derbyshire, England. The whole council was up for election with boundary changes since the last election in 1999 increasing the number of seats by 2. [1] The Conservative party gained control of the council from the Labour party. [2]
Amber Valley is a local government district and borough in Derbyshire, England. It takes its name from the River Amber and covers a semi-rural area with a number of small towns whose economy was formerly based on coal mining and engineering. The parliamentary constituency of Amber Valley covers a similar area. The Local Authority population at the 2011 Census was 122,309.
Borough status in the United Kingdom is granted by royal charter to local government districts in England, Wales and Northern Ireland. The status is purely honorary, and does not give any additional powers to the council or inhabitants of the district. In Scotland, similarly chartered communities were known as royal burghs, although the status is no longer granted.
Derbyshire is a county in the East Midlands of England. A substantial portion of the Peak District National Park lies within Derbyshire, containing the southern extremity of the Pennine range of hills which extend into the north of the county. The county contains part of the National Forest, and borders on Greater Manchester to the northwest, West Yorkshire to the north, South Yorkshire to the northeast, Nottinghamshire to the east, Leicestershire to the southeast, Staffordshire to the west and southwest and Cheshire also to the west. Kinder Scout, at 636 metres (2,087 ft), is the highest point in the county, whilst Trent Meadows, where the River Trent leaves Derbyshire, is its lowest point at 27 metres (89 ft). The River Derwent is the county's longest river at 66 miles (106 km), and runs roughly north to south through the county. In 2003 the Ordnance Survey placed Church Flatts Farm at Coton in the Elms as the furthest point from the sea in Great Britain.
Overall turnout in the election was 31.6%, [3] with a trial in 2 wards seeing a 115% increase in postal voting after anyone was allowed to apply. [4]
Voter turnout is the percentage of eligible voters who cast a ballot in an election. Eligibility varies by country, and the voting-eligible population should not be confused with the total adult population. Age and citizenship status are often among the criteria used to determine eligibility, but some countries further restrict eligibility based on sex, race, or religion.
Postal voting is voting in an election whereby ballot papers are distributed to electors or returned by post, in contrast to electors voting in person at a polling station or electronically via an electronic voting system. Historically, postal votes must be distributed and placed in return mail before the scheduled election day, it is sometimes referred to as a form of early voting. It can also be used as an absentee ballot. However, in recent times the model in the US has morphed, in municipalities that use postal voting exclusively, to be one of ballots being mailed out to voters, but the return method taking on alternatives of return by mail or dropping off the ballot in person via secure drop boxes and/or voting centers.
Party | Seats | Gains | Losses | Net gain/loss | Seats % | Votes % | Votes | +/− | |
---|---|---|---|---|---|---|---|---|---|
Conservative | 32 | +21 | 71.1 | 50.7 | 27,044 | ||||
Labour | 12 | -20 | 26.7 | 42.4 | 22,604 | ||||
Independent | 1 | +1 | 2.2 | 2.0 | 1,041 | ||||
Liberal Democrat | 0 | 0 | 0 | 4.9 | 2,604 |
Party | Candidate | Votes | % | ± | |
---|---|---|---|---|---|
Labour | Kathryn Salt | 692 | |||
Labour | Gillian Dolman | 676 | |||
Independent | Colin Thornton | 657 | |||
Labour | Steven Daley | 546 | |||
Conservative | Jill Ratcliffe | 359 | |||
Conservative | Simon Hitchcock | 346 | |||
Liberal Democrat | Paul Gibbons | 297 | |||
Turnout | 3,573 | 22.0 |
Party | Candidate | Votes | % | ± | |
---|---|---|---|---|---|
Conservative | Mary Fletcher | 553 | 67.4 | ||
Labour | Keith Wharam | 137 | 16.7 | ||
Liberal Democrat | Peter Handscombe | 131 | 16.0 | ||
Majority | 416 | 50.7 | |||
Turnout | 821 | 39.4 |
Party | Candidate | Votes | % | ± | |
---|---|---|---|---|---|
Conservative | John Nelson | 805 | |||
Conservative | Robert Hailsworth | 722 | |||
Labour | Joyce Sanders | 502 | |||
Labour | Alan Broughton | 495 | |||
Liberal Democrat | Fiona Read | 88 | |||
Liberal Democrat | Colin Thompson | 73 | |||
Turnout | 2,685 | 35.5 |
Party | Candidate | Votes | % | ± | |
---|---|---|---|---|---|
Conservative | Michael Handley | 546 | |||
Conservative | Martin Thomlinson | 530 | |||
Labour | Nalda Boyes-Jackson | 441 | |||
Labour | Ashley Welch | 421 | |||
Turnout | 1,938 | 22.6 |
Party | Candidate | Votes | % | ± | |
---|---|---|---|---|---|
Conservative | Alan Cox | 882 | |||
Conservative | Benjamin Miller | 847 | |||
Labour | Robert Janes | 398 | |||
Labour | Kenneth Armstrong | 299 | |||
Turnout | 2,426 | 33.5 |
Party | Candidate | Votes | % | ± | |
---|---|---|---|---|---|
Conservative | Peter Arnold | 673 | |||
Conservative | Christopher Short | 638 | |||
Labour | Ronald Buzzard | 514 | |||
Labour | Peter Sheperd | 502 | |||
Turnout | 2,327 | 31.0 |
Party | Candidate | Votes | % | ± | |
---|---|---|---|---|---|
Labour | Christopher Emmas-Williams | 558 | |||
Conservative | David Cattermole | 529 | |||
Conservative | Michael Mumby | 483 | |||
Labour | Ian Fisher | 480 | |||
Turnout | 2,050 | 27.7 |
Party | Candidate | Votes | % | ± | |
---|---|---|---|---|---|
Conservative | Glyn Hartshorne | 459 | 51.3 | ||
Labour | Philip Whitney | 306 | 34.2 | ||
Liberal Democrat | Roger Shelley | 130 | 14.5 | ||
Majority | 153 | 17.1 | |||
Turnout | 895 | 47.0 |
Party | Candidate | Votes | % | ± | |
---|---|---|---|---|---|
Conservative | Anthony Woodings | 897 | |||
Conservative | Murray Charmichael-Smith | 858 | |||
Labour | Diana Hancock | 341 | |||
Labour | Jean Minion | 293 | |||
Liberal Democrat | Deena Gillat | 275 | |||
Liberal Democrat | Jeremy Benson | 191 | |||
Turnout | 2,855 | 39.0 |
Party | Candidate | Votes | % | ± | |
---|---|---|---|---|---|
Conservative | Albert Wilde | 711 | |||
Conservative | June Emmott | 709 | |||
Labour | Maurice Gent | 699 | |||
Labour | Michael Missett | 475 | |||
Liberal Democrat | Anthony Cooper | 183 | |||
Turnout | 2,777 | 38.3 |
Party | Candidate | Votes | % | ± | |
---|---|---|---|---|---|
Labour | Peter Bailey | 514 | |||
Labour | John Moon | 484 | |||
Conservative | Christine Storr | 423 | |||
Conservative | Sally West | 387 | |||
Turnout | 1,808 | 23.7 |
Party | Candidate | Votes | % | ± | |
---|---|---|---|---|---|
Conservative | Francis Bulkeley-Kirkham | 459 | |||
Labour | Glynne Cato | 451 | |||
Labour | Harry Soar | 438 | |||
Conservative | Enid Trusswell | 431 | |||
Turnout | 1,779 | 23.7 |
Party | Candidate | Votes | % | ± | |
---|---|---|---|---|---|
Labour | Celia Cox | 477 | |||
Labour | Paul Jones | 451 | |||
Conservative | Janet MacDonald | 384 | |||
Conservative | Linda Edwards-Milsom | 379 | |||
Liberal Democrat | Andrew Healy | 323 | |||
Liberal Democrat | Judith Woolley | 323 | |||
Turnout | 2,337 | 28.1 |
Party | Candidate | Votes | % | ± | |
---|---|---|---|---|---|
Conservative | Jack Brown | 788 | |||
Conservative | George Cope | 614 | |||
Labour | David Griffiths | 552 | |||
Labour | Pamela Cope | 535 | |||
Liberal Democrat | Keith Falconbridge | 101 | |||
Turnout | 2,590 | 32.7 |
Party | Candidate | Votes | % | ± | |
---|---|---|---|---|---|
Conservative | Charles Bull | 870 | |||
Conservative | Albert Hall | 846 | |||
Conservative | Alan Warner | 788 | |||
Labour | Richard Massey | 749 | |||
Labour | Timothy Benson | 710 | |||
Labour | Brenda Remington | 704 | |||
Liberal Democrat | Jane Benson | 249 | |||
Turnout | 4,916 | 29.9 |
Party | Candidate | Votes | % | ± | |
---|---|---|---|---|---|
Labour | Wendy Grace | 524 | |||
Labour | Stephanie Ward | 485 | |||
Independent | Denis Woolley | 210 | |||
Conservative | Terrence Thorpe | 206 | |||
Turnout | 1,425 | 21.3 |
Party | Candidate | Votes | % | ± | |
---|---|---|---|---|---|
Conservative | Patricia Parkin | 875 | |||
Conservative | Patricia Turner | 858 | |||
Conservative | Kathleen Brown | 774 | |||
Labour | Charles Cutting | 704 | |||
Labour | David Neilson | 665 | |||
Labour | Stephen Freeborn | 634 | |||
Liberal Democrat | Janet Thompson | 240 | |||
Turnout | 4,750 | 26.9 |
Party | Candidate | Votes | % | ± | |
---|---|---|---|---|---|
Conservative | Linda Cope | 562 | |||
Conservative | Patricia Bowmar | 559 | |||
Labour | Geoffrey Carlile | 549 | |||
Labour | Janis Gregory | 491 | |||
Turnout | 2,161 | 33.0 |
Party | Candidate | Votes | % | ± | |
---|---|---|---|---|---|
Conservative | John Jeffery | 682 | |||
Conservative | Gregory MacDonald | 676 | |||
Labour | Eric Lancashire | 611 | |||
Labour | Owen Gray | 481 | |||
Independent | Leslie Foster | 174 | |||
Turnout | 2,624 | 33.0 |
Party | Candidate | Votes | % | ± | |
---|---|---|---|---|---|
Labour | John McCabe | 690 | |||
Labour | Alan Stringer | 648 | |||
Conservative | Geoffrey Brailsford | 468 | |||
Conservative | David Beeston | 412 | |||
Turnout | 2,218 | 26.4 |
Party | Candidate | Votes | % | ± | |
---|---|---|---|---|---|
Conservative | John Cunningham | 709 | 82.0 | ||
Labour | Patrick Mountain | 156 | 18.0 | ||
Majority | 553 | 63.9 | |||
Turnout | 865 | 40.0 |
Party | Candidate | Votes | % | ± | |
---|---|---|---|---|---|
Conservative | Stephen Hayes | 885 | |||
Conservative | Allen King | 792 | |||
Labour | David Harry | 476 | |||
Labour | Pauline Griffiths | 461 | |||
Turnout | 2,614 | 32.2 |
Party | Candidate | Votes | % | ± | |
---|---|---|---|---|---|
Conservative | Valerie Thorpe | 670 | 78.0 | ||
Labour | Peter Hare | 189 | 22.0 | ||
Majority | 481 | 56.0 | |||
Turnout | 859 | 46.0 |
The 1998 Barking and Dagenham Council election took place on 7 May 1998 to elect members of Barking and Dagenham London Borough Council in London, England. The whole council was up for election and the Labour party stayed in overall control of the council.
The 2000 St Helens Metropolitan Borough Council election took place on 4 May 2000 to elect members of St Helens Metropolitan Borough Council in Merseyside, England. One third of the council was up for election and the Labour party stayed in overall control of the council.
The 2006 Barnet Council election took place on 4 May 2006 to elect members of Barnet London Borough Council in London, England. The whole council was up for election and the Conservative party stayed in overall control of the council.
The 1998 Oldham Council election took place on 7 May 1998 to elect members of Oldham Metropolitan Borough Council in Greater Manchester, England. One third of the council was up for election and the Labour party stayed in overall control of the council.
The 1998 Amber Valley Borough Council election took place on 7 May 1998 to elect members of Amber Valley Borough Council in Derbyshire, England. One third of the council was up for election and the Labour party kept overall control of the council.
Elections for the London Borough of Merton were held on 7 May 1998 to elect members of Merton London Borough Council in London, England. This was on the same day as other local elections in England and a referendum on the Greater London Authority; in the latter, Merton voted in favour of creating the Greater London Authority by 72.2% on a 37.6% turnout.
The 2000 Cheltenham Council election took place on 4 May 2000 to elect members of Cheltenham Borough Council in Gloucestershire, England. One third of the council was up for election and the Conservative party stayed in overall control of the council.
The 2000 Fareham Council election took place on 4 May 2000 to elect members of Fareham Borough Council in Hampshire, England. One third of the council was up for election and the Conservative party stayed in overall control of the council.
The 2003 Windsor and Maidenhead Borough Council election took place on 1 May 2003 to elect members of Windsor and Maidenhead Unitary Council in Berkshire, England. The whole council was up for election with boundary changes since the last election in 2000 reducing the number of seats by 1. The Liberal Democrats gained overall control of the council from no overall control.
The 2000 Sunderland Council election took place on 4 May 2000 to elect members of Sunderland Metropolitan Borough Council in Tyne and Wear, England. One third of the council was up for election and the Labour party stayed in overall control of the council.
The 2004 Harrogate Council election took place on 10 June 2004 to elect members of Harrogate Borough Council in North Yorkshire, England. One third of the council was up for election and the Conservative party stayed in overall control of the council.
The 1999 Sandwell Metropolitan Borough Council election took place on 6 May 1999 to elect members of Sandwell Metropolitan Borough Council in the West Midlands, England. One third of the council was up for election and the Labour party stayed in overall control of the council.
The 2000 Maidstone Borough Council election took place on 4 May 2000 to elect members of Maidstone Borough Council in Kent, England. One third of the council was up for election and the council stayed under no overall control.
The 2002 Maidstone Borough Council election took place on 2 May 2002 to elect members of Maidstone Borough Council in Kent, England. The whole council was up for election with boundary changes since the last election in 2000. The council stayed under no overall control.
The 2010 Amber Valley Borough Council election took place on 6 May 2010 to elect members of Amber Valley Borough Council in Derbyshire, England. One third of the council was up for election and the Conservative party stayed in overall control of the council.
The 2011 Amber Valley Borough Council election took place on 5 May 2011 to elect members of Amber Valley Borough Council in Derbyshire, England. One third of the council was up for election and the Conservative party stayed in overall control of the council.
The 2000 Hertsmere Borough Council election took place on 4 May 2000 to elect members of Hertsmere Borough Council in Hertfordshire, England. One third of the council was up for election and the Conservative party stayed in overall control of the council.
The 2000 Eastbourne Borough Council election took place on 4 May 2000 to elect members of Eastbourne Borough Council in East Sussex, England. One third of the council was up for election and the Conservative party gained overall control of the council from no overall control.
The 2002 Crawley Borough Council election took place on 2 May 2002 to elect members of Crawley Borough Council in West Sussex, England. One third of the council was up for election and the Labour party stayed in overall control of the council.
The 2002 Swale Borough Council election took place on 2 May 2002 to elect members of Swale Borough Council in Kent, England. The whole council was up for election with boundary changes since the last election in 2000 reducing the number of seats by two. The Conservative party gained overall control of the council from no overall control.