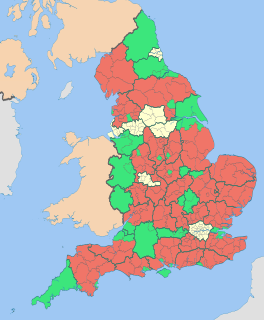
The 1999 Arun District Council election took place on 6 May 1999 to elect members of Arun District Council in West Sussex, England. The whole council was up for election and the Conservative Party held overall control of the council. [1]
Arun is a local government district in West Sussex, England. It contains the towns of Arundel, Bognor Regis and Littlehampton, and takes its name from the River Arun, which runs through the centre of the district.
Non-metropolitan districts, or colloquially "shire districts", are a type of local government district in England. As created, they are sub-divisions of non-metropolitan counties in a two-tier arrangement.
West Sussex is a county in the south of England, bordering East Sussex to the east, Hampshire to the west and Surrey to the north, and to the south the English Channel.
Party | Seats | Gains | Losses | Net gain/loss | Seats % | Votes % | Votes | +/− | |
---|---|---|---|---|---|---|---|---|---|
Conservative | 36 | +6 | 64.3 | 50.3 | 35,876 | ||||
Liberal Democrat | 10 | -4 | 17.9 | 27.5 | 19,591 | ||||
Labour | 8 | -2 | 14.3 | 18.1 | 12,900 | ||||
Independent | 2 | 0 | 3.6 | 4.1 | 2,953 |
Party | Candidate | Votes | % | ± | |
---|---|---|---|---|---|
Conservative | Richard Wilby | 642 | 66.7 | ||
Liberal Democrat | George Fletcher | 321 | 33.3 | ||
Majority | 321 | 33.3 | |||
Turnout | 963 | 34.9 |
Party | Candidate | Votes | % | ± | |
---|---|---|---|---|---|
Conservative | Gillian Brown | 1,127 | |||
Conservative | Robin Brown | 1,127 | |||
Liberal Democrat | Gerard Maloret | 311 | |||
Liberal Democrat | Joan Maloret | 289 | |||
Labour | Christopher Rodway | 202 | |||
Labour | Mary Vick | 195 | |||
Turnout | 3,251 | 37.4 |
Party | Candidate | Votes | % | ± | |
---|---|---|---|---|---|
Conservative | Richard Dickinson | 1,000 | |||
Conservative | Brian Dodd | 995 | |||
Conservative | Jacqueline Maconachie | 916 | |||
Liberal Democrat | Anthony Thorpe | 290 | |||
Liberal Democrat | Patricia Elliott | 288 | |||
Liberal Democrat | Carol Turner | 275 | |||
Labour | Bernadette Jones | 252 | |||
Labour | Brian Picton | 237 | |||
Labour | Colin White | 228 | |||
Turnout | 4,481 | 31.2 |
Party | Candidate | Votes | % | ± | |
---|---|---|---|---|---|
Conservative | Victor Barnard | 1,048 | |||
Conservative | Roger Elkins | 918 | |||
Conservative | Oliver Wingrove | 856 | |||
Liberal Democrat | Ann Franke | 428 | |||
Labour | David Jones | 394 | |||
Turnout | 3,644 | 29.0 |
Party | Candidate | Votes | % | ± | |
---|---|---|---|---|---|
Independent | William Redman | 933 | |||
Conservative | Clive Gardner | 790 | |||
Liberal Democrat | Ivan Olney | 543 | |||
Turnout | 2,266 | 43.0 |
Party | Candidate | Votes | % | ± | |
---|---|---|---|---|---|
Conservative | Jean Goad | 1,193 | |||
Liberal Democrat | John Matthews | 951 | |||
Conservative | David Hodgson | 935 | |||
Conservative | Martin Porsch | 842 | |||
Liberal Democrat | Julia Robson | 721 | |||
Liberal Democrat | John Goss | 649 | |||
Labour | Jill Etienne | 370 | |||
Labour | Peter Found | 363 | |||
Labour | Philippa Holliday | 340 | |||
Turnout | 6,364 | 33.4 |
Party | Candidate | Votes | % | ± | |
---|---|---|---|---|---|
Liberal Democrat | Simon McDougall | 618 | |||
Liberal Democrat | Paul Beckerson | 578 | |||
Liberal Democrat | Martin Lury | 549 | |||
Labour | Patrick Hastings | 474 | |||
Conservative | John Potter | 446 | |||
Labour | Tiggy Ayoub | 413 | |||
Labour | Robert Shields | 370 | |||
Turnout | 3,448 | 23.8 |
Party | Candidate | Votes | % | ± | |
---|---|---|---|---|---|
Conservative | John Rankin | 1,380 | |||
Conservative | Dennis Wilde | 1,362 | |||
Conservative | Ronald Sands | 1,268 | |||
Liberal Democrat | Susan Graves | 524 | |||
Liberal Democrat | Leonard Lee | 506 | |||
Turnout | 5,040 | 36.4 |
Party | Candidate | Votes | % | ± | |
---|---|---|---|---|---|
Conservative | Susan Kelly | 733 | |||
Independent | Michael Harvey | 561 | |||
Conservative | David Crabtree | 555 | |||
Liberal Democrat | William Robinson | 203 | |||
Labour | Alison McIsaac | 202 | |||
Labour | Scott Cowie | 196 | |||
Liberal Democrat | Christopher Oliver | 151 | |||
Turnout | 2,601 | 33.8 |
Party | Candidate | Votes | % | ± | |
---|---|---|---|---|---|
Conservative | Alan Stainton | 632 | |||
Conservative | Elaine Stainton | 545 | |||
Independent | Mary Harvey | 515 | |||
Independent | George Stride | 497 | |||
Liberal Democrat | Sylvia Orwell | 142 | |||
Labour | Mark Searle | 132 | |||
Labour | Melanie Webb | 96 | |||
Liberal Democrat | Walter Vanner | 80 | |||
Turnout | 2,639 | 38.8 |
Party | Candidate | Votes | % | ± | |
---|---|---|---|---|---|
Conservative | Rosemary Cooper | 1,224 | |||
Conservative | David Hill | 1,205 | |||
Liberal Democrat | John Ceiriog-Hughes | 300 | |||
Liberal Democrat | Penelope Kane | 286 | |||
Turnout | 3,015 | 40.4 |
Party | Candidate | Votes | % | ± | |
---|---|---|---|---|---|
Conservative | Stephen Brookman | 449 | 67.9 | ||
Liberal Democrat | Margaret Monroe | 212 | 32.1 | ||
Majority | 237 | 35.8 | |||
Turnout | 661 | 46.0 |
Party | Candidate | Votes | % | ± | |
---|---|---|---|---|---|
Conservative | Edwin Gyde | 490 | |||
Conservative | Michael May | 479 | |||
Labour | Pauline Nash | 349 | |||
Liberal Democrat | Roslyn Kissell | 348 | |||
Liberal Democrat | Jeanette Warr | 321 | |||
Labour | Edward Walsh | 318 | |||
Turnout | 2,305 | 27.0 |
Party | Candidate | Votes | % | ± | |
---|---|---|---|---|---|
Liberal Democrat | James Walsh | 607 | |||
Conservative | Richard Bower | 456 | |||
Liberal Democrat | Richard James | 454 | |||
Conservative | Philippa Bower | 440 | |||
Independent | Andrew Hawkes | 299 | |||
Labour | Edward Nattrass | 221 | |||
Labour | William Taylor | 219 | |||
Turnout | 2,696 | 32.9 |
Party | Candidate | Votes | % | ± | |
---|---|---|---|---|---|
Conservative | Nigel Peters | 576 | |||
Labour | David Dyball | 526 | |||
Labour | Alan Butcher | 510 | |||
Liberal Democrat | Barbara Roberts | 391 | |||
Liberal Democrat | Mark Foster | 372 | |||
Turnout | 2,375 | 30.7 |
Party | Candidate | Votes | % | ± | |
---|---|---|---|---|---|
Labour | Michael Northeast | 472 | |||
Labour | Anthony Squires | 465 | |||
Liberal Democrat | Alfred Roberts | 178 | |||
Conservative | Linda Rudd | 171 | |||
Liberal Democrat | Paul Graydon | 163 | |||
Turnout | 1,449 | 28.0 |
Party | Candidate | Votes | % | ± | |
---|---|---|---|---|---|
Labour | Mark Butler | 350 | 46.9 | ||
Conservative | Anthony Williamson | 206 | 27.6 | ||
Liberal Democrat | Nicholas Wiltshire | 190 | 25.5 | ||
Majority | 144 | 19.3 | |||
Turnout | 746 | 31.8 |
Party | Candidate | Votes | % | ± | |
---|---|---|---|---|---|
Labour | George O'Neill | 685 | |||
Labour | Andrew Northeast | 681 | |||
Conservative | John Forster | 412 | |||
Liberal Democrat | John Wedderburn | 247 | |||
Liberal Democrat | Alan Escolme | 184 | |||
Turnout | 2,209 | 30.8 |
Party | Candidate | Votes | % | ± | |
---|---|---|---|---|---|
Conservative | Douglas Maconachie | 566 | |||
Liberal Democrat | Kenneth Scutt | 524 | |||
Liberal Democrat | Sylvia Olliver | 512 | |||
Labour | Jeremy Tomlinson | 259 | |||
Labour | Thomas Wise | 212 | |||
Turnout | 2,073 | 29.1 |
Party | Candidate | Votes | % | ± | |
---|---|---|---|---|---|
Conservative | Barbara Oakley | 971 | |||
Conservative | Paul Wotherspoon | 922 | |||
Labour | Priscilla Matcham | 256 | |||
Labour | Robert Ling | 222 | |||
Liberal Democrat | Christine Beckerson | 209 | |||
Liberal Democrat | Frank Coe | 184 | |||
Independent | Colin Mansfield | 148 | |||
Turnout | 2,912 | 33.9 |
Party | Candidate | Votes | % | ± | |
---|---|---|---|---|---|
Liberal Democrat | Catherine Morrish | 454 | |||
Liberal Democrat | Francis Oppler | 390 | |||
Labour | Ian McIsaac | 373 | |||
Labour | Gail Walker | 356 | |||
Conservative | Doris May | 154 | |||
Turnout | 1,727 | 28.7 |
Party | Candidate | Votes | % | ± | |
---|---|---|---|---|---|
Conservative | Anita Hall | 869 | |||
Conservative | Leonard Brown | 849 | |||
Conservative | Ashvinkumar Patel | 777 | |||
Labour | Sean Whelan | 332 | |||
Labour | Simon Holland | 315 | |||
Labour | Michael Jones | 297 | |||
Liberal Democrat | Guy Beesley | 256 | |||
Liberal Democrat | Sara Allen | 252 | |||
Liberal Democrat | Paul Wells | 225 | |||
Turnout | 4,172 | 31.5 |
Party | Candidate | Votes | % | ± | |
---|---|---|---|---|---|
Labour | Roger Nash | 539 | |||
Labour | Jan Cosgrove | 479 | |||
Liberal Democrat | Jennifer Gillibrand | 315 | |||
Liberal Democrat | Robert Gillibrand | 300 | |||
Conservative | Luke Parker | 244 | |||
Turnout | 1,877 | 27.9 |
Party | Candidate | Votes | % | ± | |
---|---|---|---|---|---|
Conservative | Derek Whittaker | 1,057 | |||
Conservative | Frances Drazny | 1,017 | |||
Liberal Democrat | Allan Turner | 466 | |||
Liberal Democrat | George Young | 433 | |||
Turnout | 2,967 | 37.0 |
Party | Candidate | Votes | % | ± | |
---|---|---|---|---|---|
Liberal Democrat | Val Capon | 624 | |||
Liberal Democrat | John Richards | 578 | |||
Conservative | Alan Gammon | 484 | |||
Conservative | Dee Giles | 479 | |||
Turnout | 2,165 | 33.9 |
Party | Candidate | Votes | % | ± | |
---|---|---|---|---|---|
Conservative | Thomas Harrison | 699 | |||
Conservative | Harold Parris | 665 | |||
Liberal Democrat | Peter Gladston | 510 | |||
Liberal Democrat | Graham Trickett | 437 | |||
Turnout | 2,311 | 38.8 |
Party | Candidate | Votes | % | ± | |
---|---|---|---|---|---|
Conservative | Norman Dingemans | 705 | 73.7 | ||
Liberal Democrat | Kevin Welling | 252 | 26.3 | ||
Majority | 453 | 47.4 | |||
Turnout | 957 | 43.0 |
Vale of White Horse District Council in Oxfordshire, England is elected every four years.
Arun District Council in West Sussex, England is elected every four years. Since the last boundary changes in 2015, 54 councillors have been elected from 23 wards.
One third of Amber Valley Borough Council in Derbyshire, England is elected each year, followed by one year without election. Since the last boundary changes in 2000, 45 councillors have been elected from 23 wards.
Half of Adur District Council in West Sussex, England is elected every two years. Until 2003, the council was elected by thirds. Since the last boundary changes in 2004, 29 councillors have been elected from 14 wards.
One third of Brentwood Borough Council in Essex, England is elected each year, followed by one year where there is an election to Essex County Council. Since the last boundary changes in 2002, 37 councillors have been elected from 15 wards.
Fenland District Council in Cambridgeshire, England is elected every four years. Since the last boundary changes in 2015, 39 councillors have been elected from 24 wards.
One third of Daventry District Council in Northamptonshire, England is elected each year, followed by one year when there is an election to Northamptonshire County Council instead. Since the last boundary changes in 1999, 38 councillors have been elected from 24 wards.In another boundary review in 2012 the councillors were reduced to 36 councillors across 16 wards.
East Hampshire District Council in Hampshire England is elected every four years. Since the last boundary changes in 2003, 44 councillors have been elected from 38 wards.
The 1999 Fylde Borough Council election took place on 6 May 1999 to elect member of Fylde District Council in Lancashire, England. The whole council was up for election and the council stayed under no overall control.
Eden District Council in Cumbria, England is elected every four years.
The 2003 Arun District Council election took place on 1 May 2003 to elect members of Arun District Council in West Sussex, England. The whole council was up for election with boundary changes since the last election in 1999. The Conservative party stayed in overall control of the council.
The 2007 Arun District Council election took place on 3 May 2007 to elect members of Arun District Council in West Sussex, England. The whole council was up for election and the Conservative party stayed in overall control of the council.
Leicestershire County Council in England is elected every four years.
The 1999 Lichfield District Council election took place on 6 May 1999 to elect members of Lichfield District Council in Staffordshire, England. The whole council was up for election and the Conservative party gained overall control of the council from the Labour party.
One third of Worthing Borough Council in Worthing, West Sussex, England is elected each year, followed by one year without election. Since the last boundary changes in 2003, 37 councillors are elected from 13 wards.
The 1999 Bromsgrove District Council election took place on 6 May 1999 to elect members of Bromsgrove district council in Worcestershire, England. The whole council was up for election and the Conservative party gained overall control of the council from the Labour party.
Tendring District Council in Essex, England is elected every four years. Since the last boundary changes in 2003, 60 councillors have been elected from 32 wards.
One third of Hertsmere Borough Council in Hertfordshire, England is elected each year, followed by one year without election. Since the last boundary changes in 1999, 39 councillors have been elected from 15 wards.
The 1999 Welwyn Hatfield District Council election took place on 6 May 1999 to elect members of Welwyn Hatfield District Council in Hertfordshire, England. The whole council was up for election with boundary changes since the last election in 1998 increasing the number of seats by one. The Conservative party gained overall control of the council from the Labour party. Overall turnout in the election was 33.09%.