| |||||||||||||||||||||||||||||||||||||||||||||||||||||||||||||
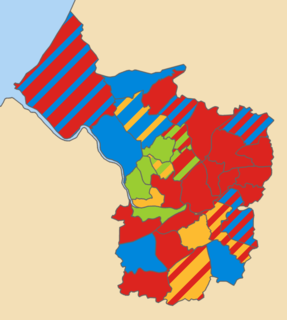
24 OF 70 seats (One Third) to Bristol City Council 36 seats needed for a majority | |||||||||||||||||||||||||||||||||||||||||||||||||||||||||||||
| |||||||||||||||||||||||||||||||||||||||||||||||||||||||||||||
|
The 2014 Bristol City Council election took place on 22 May 2014 to elect members of Bristol City Council in England, as part of the United Kingdom 2014 Local Elections. [1]
Bristol City Council is the local authority of Bristol, England. The council is a unitary authority, and is unusual in the United Kingdom in that its executive function is controlled by a directly elected mayor of Bristol. Bristol has 35 wards, electing a total of 70 councillors.
214,544 people were eligible to vote in the elections, of which 58,907 turned out to do so. Consequently, overall turnout was 27.5%. [2]
Party | Candidate | Votes | % | ± | |
---|---|---|---|---|---|
Conservative | Matthew Simon Melias | 1,067 | 31.55 | -7.83 | |
Labour | John Thomas Bees | 1,051 | 30.88 | +0.50 | |
UKIP | Spud Murphy | 878 | 25.79 | +1.90 | |
Green | Justin Michael Quinnell | 149 | 4.38 | +1.43 | |
Independent | Stephen Kenneth James Norman | 135 | 3.97 | N/A | |
Liberal Democrat | Ian Humfrey Campion-Smith | 108 | 3.17 | +0.81 | |
TUSC | Patrick Dorian Hulme | 16 | 0.47 | +8.53 | |
Majority | 16 | 0.67 | -4.05 | ||
Conservative gain from Labour | Swing | -4.17 | |||
Party | Candidate | Votes | % | ± | |
---|---|---|---|---|---|
Labour | Mark Bradshaw | 1,745 | 46.77 | +5.84 | |
Green | Catherine Slade | 838 | 22.46 | +7.46 | |
Conservative | Sarah Helen Cleave | 680 | 18.23 | +0.13 | |
Liberal Democrat | Thom Oliver | 264 | 7.08 | -13.19 | |
TUSC | Robin Victor Clapp | 204 | 5.47 | +2.45 | |
Majority | 907 | 24.31 | +3.65 | ||
Labour hold | Swing | -0.81 | |||
Party | Candidate | Votes | % | ± | |
---|---|---|---|---|---|
Green | Tim Malnick | 2,246 | 47.31 | +11.21 | |
Labour | Eileen Means | 1,168 | 24.61 | +5.21 | |
Liberal Democrat | Barry John Cash | 757 | 15.95 | -2.04 | |
Conservative | Owen James Evans | 511 | 10.76 | +4.29 | |
TUSC | Martin James Saddington | 65 | 1.37 | +0.45 | |
Majority | 1,078 | 22.70 | +6.00 | ||
Green gain from Liberal Democrat | Swing | +3.00 | |||
Party | Candidate | Votes | % | ± | |
---|---|---|---|---|---|
Conservative | Kevin Michael Quartley | 1,058 | 39.45 | -12.07 | |
Labour | Kye Daniel Dudd | 783 | 29.19 | -6.93 | |
Independents for Bristol | Jon Craig | 431 | 16.07 | N/A | |
Green | Alan Wilson Baker | 230 | 8.58 | -0.37 | |
Liberal Democrat | Gareth Owen | 92 | 3.43 | +0.03 | |
TUSC | Joseph John Etherington | 88 | 3.28 | N/A | |
Majority | 275 | 10.26 | -5.14 | ||
Conservative hold | Swing | -2.57 | |||
Party | Candidate | Votes | % | ± | |
---|---|---|---|---|---|
Labour | Mike Willacott | 1,002 | 31.85 | -7.61 | |
UKIP | John Langley | 886 | 28.16 | +21.94 | |
Conservative | Perry Hicks | 645 | 20.50 | -14.42 | |
Green | Peter Antony Goodwin | 241 | 7.66 | -0.04 | |
Liberal Democrat | Pauline Mary Allen | 199 | 6.33 | -4.34 | |
Independent | Philip Collins | 138 | 4.39 | N/A | |
TUSC | Matthew Gordon | 35 | 1.11 | +0.08 | |
Majority | 116 | 3.69 | -0.85 | ||
Labour hold | Swing | -14.78 | |||
Party | Candidate | Votes | % | ± | |
---|---|---|---|---|---|
Labour | Rhian Elena Greaves | 972 | 30.87 | +0.12 | |
UKIP | Christopher James Robinson | 813 | 25.82 | +16.15 | |
Liberal Democrat | Peter Henry Main | 800 | 25.40 | -6.94 | |
Conservative | Roy Towler | 501 | 15.91 | -3.18 | |
TUSC | Ibado Ali Mahamoud | 63 | 2.00 | +0.96 | |
Majority | 159 | 5.05 | +3.46 | ||
Labour gain from Liberal Democrat | Swing | -8.02 | |||
Party | Candidate | Votes | % | ± | |
---|---|---|---|---|---|
Labour | Christopher David Jackson | 1,334 | 59.39 | -4.45 | |
Green | Ryan Brinkley | 335 | 14.92 | +10.00 | |
Conservative | Sylvia Christine Windows | 301 | 13.40 | -0.45 | |
TUSC | Marion Jackson | 174 | 7.75 | +6.15 | |
Liberal Democrat | Crispin Allard | 102 | 4.54 | -1.62 | |
Majority | 999 | 44.47 | -5.19 | ||
Labour hold | Swing | -7.23 | |||
Party | Candidate | Votes | % | ± | |
---|---|---|---|---|---|
Labour | Naomi Grace Rylatt | 1,031 | 44.69 | -11.11 | |
Conservative | Jonathan Robert Hucker | 648 | 28.09 | +4.21 | |
Green | Patrick Charles Gordon Slade | 283 | 12.27 | +7.58 | |
TUSC | Robert Nash | 223 | 9.67 | N/A | |
Liberal Democrat | Paul Elvin | 122 | 5.29 | -0.22 | |
Majority | 383 | 16.60 | -0.22 | ||
Labour hold | Swing | -7.66 | |||
Party | Candidate | Votes | % | ± | |
---|---|---|---|---|---|
Conservative | Mark Weston | 1,491 | 52.02 | +4.29 | |
Labour | Rosalie Walker | 907 | 31.65 | -7.54 | |
Green | Ruby Tucker | 236 | 8.23 | +2.70 | |
Liberal Democrat | Thomas Stephens | 139 | 4.85 | -1.46 | |
TUSC | David Rawlings | 93 | 3.24 | N/A | |
Majority | 584 | 20.37 | +11.83 | ||
Conservative hold | Swing | +5.92 | |||
Party | Candidate | Votes | % | ± | |
---|---|---|---|---|---|
UKIP | Michael Frost | 912 | 31.02 | N/A | |
Labour | Yvonne Eileen Clapp | 780 | 26.53 | -11.02 | |
Conservative | Antony Skelding | 503 | 17.11 | -11.38 | |
Liberal Democrat | Sylvia Kathleen Doubell | 480 | 16.33 | -9.73 | |
Green | Graham Hugh Davey | 123 | 4.18 | +1.61 | |
Respect | Neil Oliver Maggs | 114 | 3.88 | N/A | |
TUSC | Mark Baker | 28 | 0.95 | N/A | |
Majority | 132 | 4.49 | -4.57 | ||
UKIP gain from Liberal Democrat | Swing | +21.02 | |||
Party | Candidate | Votes | % | ± | |
---|---|---|---|---|---|
Liberal Democrat | Clare Campion-Smith | 1,830 | 43.73 | -0.76 | |
Conservative | Kevin Michael Staples | 1,289 | 30.80 | -4.73 | |
Labour | Barry Thompson Trahar | 488 | 11.66 | -0.87 | |
Green | Geoff Collard | 307 | 7.34 | -0.11 | |
UKIP | Nina Beale | 246 | 5.88 | N/A | |
TUSC | Chris Farrell | 25 | 0.60 | N/A | |
Majority | 541 | 12.93 | +3.97 | ||
Liberal Democrat hold | Swing | +1.99 | |||
Party | Candidate | Votes | % | ± | |
---|---|---|---|---|---|
Labour | Olly Mead | 1,032 | 27.63 | +0.54 | |
Conservative | Nigel John Currie | 958 | 25.65 | -2.92 | |
Liberal Democrat | Cheryl Ann | 699 | 18.71 | -4.23 | |
UKIP | Peter Charles Brown | 520 | 13.92 | N/A | |
Green | John Mark Hills | 474 | 12.69 | +3.30 | |
TUSC | Martyn Ahmet | 52 | 1.39 | +0.00 | |
Majority | 74 | 1.39 | +0.99 | ||
Labour gain from Liberal Democrat | Swing | +1.73 | |||
Party | Candidate | Votes | % | ± | |
---|---|---|---|---|---|
Liberal Democrat | Tim Leaman | 745 | 26.37 | +3.17 | |
UKIP | Terence Richard Daniel Thomas | 720 | 25.49 | N/A | |
Labour | Mike Thorne | 654 | 23.15 | -2.85 | |
Conservative | Barbara Madeleine Lewis | 489 | 17.31 | -0.68 | |
Green | Ben Appleby | 195 | 6.90 | +3.47 | |
TUSC | Caroline Louisa Vincent | 22 | 0.78 | -1.00 | |
Majority | 25 | 0.88 | -0.72 | ||
Liberal Democrat hold | Swing | -11.16 | |||
Party | Candidate | Votes | % | ± | |
---|---|---|---|---|---|
Liberal Democrat | Gary Hopkins | 1,659 | 45.92 | +6.78 | |
Labour | Christopher Louis Orlik | 884 | 24.47 | -9.05 | |
UKIP | Steve Wood | 477 | 13.20 | N/A | |
Green | Stephen Petter | 311 | 8.61 | -1.92 | |
Conservative | Graham David Morris | 239 | 6.62 | -7.98 | |
TUSC | Domenico William Hill | 43 | 1.19 | -1.03 | |
Majority | 775 | 21.45 | +15.83 | ||
Liberal Democrat hold | Swing | +7.92 | |||
Party | Candidate | Votes | % | ± | |
---|---|---|---|---|---|
Labour | Gill Kirk | 1,071 | 37.79 | -8.61 | |
Liberal Democrat | Sean Clifford Emmett | 719 | 25.37 | -4.79 | |
UKIP | Pearleta Chicketer Hopkins | 452 | 15.95 | N/A | |
Green | Chrissie Quinnell | 309 | 10.90 | -0.12 | |
Conservative | Darien Luke Jay | 242 | 8.54 | -3.88 | |
TUSC | Roger Thomas | 41 | 1.45 | N/A | |
Majority | 352 | 12.42 | -3.82 | ||
Labour gain from Liberal Democrat | Swing | -1.91 | |||
Party | Candidate | Votes | % | ± | |
---|---|---|---|---|---|
Green | Martin Fodor | 1,465 | 36.19 | +14.21 | |
Liberal Democrat | Alex Smethurst | 709 | 17.51 | -15.31 | |
Labour | Philip John Jardine | 689 | 17.02 | -2.91 | |
Conservative | Christopher Morton | 661 | 16.33 | -0.36 | |
Independents for Bristol | Stella Jane Perrett | 327 | 8.08 | N/A | |
UKIP | Christine Wyndham-Thomas | 171 | 4.22 | N/A | |
TUSC | Laura Collins | 26 | 0.64 | -0.48 | |
Majority | 756 | 18.68 | +7.84 | ||
Green gain from Liberal Democrat | Swing | +14.76 | |||
Party | Candidate | Votes | % | ± | |
---|---|---|---|---|---|
Labour | Jenny Smith | 1,121 | 44.22 | -17.05 | |
UKIP | Tony Orr | 633 | 24.97 | N/A | |
Conservative | Paige Cora Betty Elise Golding | 458 | 18.07 | -1.14 | |
Green | Chris Millman | 160 | 6.31 | -2.79 | |
Liberal Democrat | Andrew John Morgan | 145 | 5.72 | -0.57 | |
TUSC | John Yeandle | 18 | 0.71 | -3.43 | |
Majority | 488 | 19.25 | -22.81 | ||
Labour hold | Swing | -21.01 | |||
Party | Candidate | Votes | % | ± | |
---|---|---|---|---|---|
Green | Charlie Bolton | 1,700 | 42.53 | +4.86 | |
Labour | Celia Christine Phipps | 1,322 | 33.07 | -10.27 | |
UKIP | Paul Anthony Turner | 402 | 10.06 | N/A | |
Conservative | James Andrew Hale Stevenson | 289 | 7.23 | -4.42 | |
Liberal Democrat | Lena Clare Wright | 208 | 5.20 | -2.13 | |
TUSC | Matthew Edward Carey | 76 | 1.90 | N/A | |
Majority | 378 | 9.46 | -4.98 | ||
Green hold | Swing | +7.57 | |||
Party | Candidate | Votes | % | ± | |
---|---|---|---|---|---|
Labour | Sue Milestone | 1,141 | 39.43 | -7.28 | |
Green | Chloe Alice Somers | 494 | 17.07 | +9.34 | |
Conservative | David Thomas Harrison Lewis | 425 | 14.69 | +7.23 | |
Liberal Democrat | Tony Potter | 387 | 13.37 | +0.76 | |
Independents for Bristol | Jane Marjory Westhead | 354 | 12.23 | N/A | |
TUSC | Tom Boyd | 93 | 3.21 | +0.81 | |
Majority | 647 | 22.36 | -1.26 | ||
Labour hold | Swing | -8.31 | |||
Party | Candidate | Votes | % | ± | |
---|---|---|---|---|---|
Conservative | David Henry Robert Morris | 1,336 | 47.65 | +0.55 | |
Labour | Kerry Barker | 855 | 30.49 | +0.52 | |
Green | Issica Carina Baron | 337 | 12.02 | +1.58 | |
Liberal Democrat | Robin Max McGhee | 150 | 5.35 | -7.14 | |
TUSC | Philip John Bishop | 126 | 4.49 | N/A | |
Majority | 481 | 17.16 | +0.03 | ||
Conservative hold | Swing | +0.02 | |||
Party | Candidate | Votes | % | ± | |
---|---|---|---|---|---|
Conservative | John Goulandris | 2,142 | 57.77 | -10.62 | |
Green | Kyla Darrell | 513 | 13.83 | +5.34 | |
Labour | Christine Webb | 468 | 12.62 | +0.44 | |
Liberal Democrat | Mary Elizabeth Page | 330 | 8.90 | -2.05 | |
UKIP | Gerard Robinson | 230 | 6.20 | N/A | |
TUSC | Michael Wright | 25 | 0.67 | N/A | |
Majority | 1,629 | 43.94 | -12.27 | ||
Conservative hold | Swing | -7.98 | |||
Party | Candidate | Votes | % | ± | |
---|---|---|---|---|---|
Conservative | Alastair Peter Lindsay Watson | 1,977 | 49.82 | -1.18 | |
Labour | Jonathan David Moore | 568 | 14.31 | +1.90 | |
Liberal Democrat | Graham Christopher Donald | 530 | 13.36 | +4.87 | |
UKIP | Ann Kathleen Michael | 442 | 11.14 | N/A | |
Green | Alex Dunn | 427 | 10.76 | +6.08 | |
TUSC | Mike Luff | 24 | 0.60 | N/A | |
Majority | 1,409 | 35.51 | +7.93 | ||
Conservative hold | Swing | +0.36 | |||
Party | Candidate | Votes | % | ± | |
---|---|---|---|---|---|
Liberal Democrat | Tim Kent | 961 | 36.61 | +12.50 | |
UKIP | Christine Ann Forrester | 742 | 28.27 | N/A | |
Labour | Alice Drummond Boquet | 612 | 23.31 | -28.28 | |
Conservative | Jenny Rogers | 210 | 8.00 | -7.74 | |
Green | Barney Smith | 82 | 3.12 | -0.03 | |
TUSC | Frankie Langeland | 18 | 0.69 | N/A | |
Majority | 219 | 8.34 | -19.17 | ||
Liberal Democrat hold | Swing | -7.89 | |||
Party | Candidate | Votes | % | ± | |
---|---|---|---|---|---|
Labour | Sam Mongon | 1,107 | 28.99 | +3.07 | |
Liberal Democrat | Andrew Charles Brown | 1,100 | 28.81 | -21.74 | |
Green | Pip Sheard | 920 | 24.10 | +10.07 | |
UKIP | Al Shute | 350 | 9.17 | N/A | |
Conservative | Tony Lee | 247 | 6.47 | +0.38 | |
TUSC | Tom Baldwin | 94 | 2.46 | -0.95 | |
Majority | 7 | 0.18 | -24.45 | ||
Labour gain from Liberal Democrat | Swing | +12.41 | |||
Bristol West is a borough constituency represented in the House of Commons of the Parliament of the United Kingdom. It covers the central and western parts of Bristol.
Bristol North West is a constituency to the north and north-west of Bristol city centre represented in the House of Commons of the UK Parliament since 2017 by Darren Jones of the Labour Party.
Bristol East is a constituency recreated in 1983 covering the eastern part of the City of Bristol, represented in the House of Commons of the UK Parliament since 2005 by Kerry McCarthy of the Labour Party. An earlier guise of the seat existed between 1885 and 1950.
The city of Bristol is divided into many areas, which often overlap or have non-fixed borders. These include Parliamentary constituencies, council wards and unofficial neighbourhoods. There are no civil parishes in Bristol.
The city of Bristol, England, is a unitary authority, represented by four MPs representing seats wholly within the city boundaries. As well as these, Filton and Bradley Stoke covers the northern urban fringe in South Gloucestershire and the north eastern urban fringe is in the Kingswood constituency. The overall trend of both local and national representation became left of centre, favouring the Labour Party and Liberal Democrats during the latter 20th century, but there was a shift to the right in the 2010 general election. The city has a tradition of local activism, with environmental issues and sustainable transport being prominent issues in the city.
Bristol South East was a constituency in the city of Bristol that returned one Member of Parliament (MP) to the House of Commons of the Parliament of the United Kingdom.
The 1986 Bristol City Council election took place on 8 May 1986 to elect members of Bristol City Council in England. This was on the same day as other local elections. One third of seats in the 1986 Council Elections in the English city of Bristol were up for election. The election in Brislington West was a by-election. There was a small swing away from the Conservatives and Labour regained a majority on the Council, which they kept until 2003.
The 1987 Bristol City Council election took place on 7 May 1987 to elect members of Bristol City Council in England. This was on the same day as other local elections. One third of seats were up for election. There was also a by-election in Clifton. There was a general but very small swing away from the Conservatives.
The 1990 Bristol City Council election took place on 3 May 1990 to elect members of Bristol City Council in England. This was on the same day as other local elections. One third of seats were up for election. There were by-elections in Brislington East and Easton. As Easton also had an election in the usual schedule, 2 seats were elected in that ward. There was a significant swing against the Liberal Democrats, largely as a result of the post-merger chaos that the party suffered.
Brislington West is a council ward of the city of Bristol, England. It covers the western part of Brislington, Arnos Vale, Kensington Park and St Anne's.
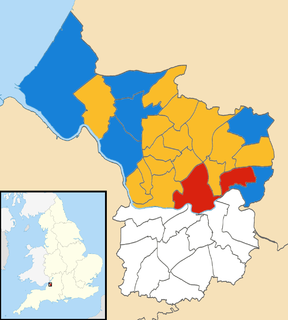
The 2009 Bristol City Council elections were held on Thursday 4 June 2009, for 23 seats, that being one-third of the total number of councilors. The Liberal Democrats who had been leading a minority administration, won an overall majority of the council, the first time the party had achieved this on Bristol City Council. The Liberal Democrats were defending 11 seats, the Labour Party 10 and the Conservatives 2.
The 2010 Bristol City Council elections were held on Thursday 6 May 2010, for 23 seats, that being one third of the total number of councillors. The Liberal Democrats, who had won overall control of the council in 2009, increased their majority to six seats.
The 2003 Sunderland Council election took place on 1 May 2003 to elect members of Sunderland Metropolitan Borough Council in Tyne and Wear, England. One third of the council was up for election and the Labour party stayed in overall control of the council.
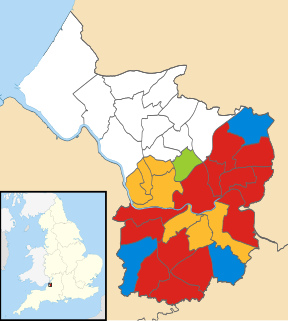
The 2011 Bristol City Council elections were held on Thursday 5 May 2011, for 24 seats, that being one third of the total number of councillors. The Liberal Democrats, who had won overall control of the council in 2009 and increased their majority in 2010, experienced a drop in support and lost 5 seats; 4 to the Labour Party and 1 to the Green Party, which gained its second ever council seat in Bristol. This meant that the Lib Dems no longer had a majority on the council. However, they continued to run the council, relying on opposition groups to vote through any proposal.
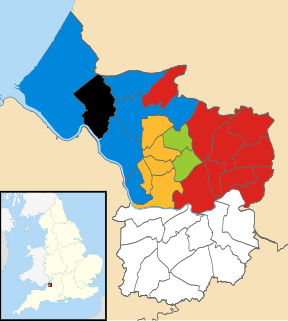
Elections for one third of Bristol City Council were held on 2 May 2013 as part of the United Kingdom local elections, 2013. No party gained overall control.
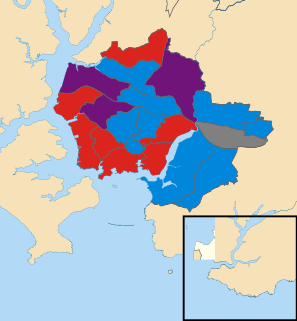
The 2014 Plymouth City Council election took place on 22 May 2014 to elect members of Plymouth City Council in England. This was on the same day as other local elections. The election was won by the Labour Party, who maintained their overall majority. The UK Independence Party gained representation on the council for the first time, and this was the only election in which the party won seats in Plymouth.
The 2015 Bristol City Council election took place on 7 May 2015 to elect members of Bristol City Council in England. This was on the same day as other local elections.
The 2015 City of York Council election took place on 7 May 2015 to elect members of City of York Council in England. The whole council was up for election. Turnout was substantially up across the city due to the election being held on the same day as the general election and other local elections in England.
The 2016 Bristol City Council election took place on Thursday 5 May 2016, alongside nationwide local elections. Following a boundary review, the number of wards in the City was reduced to 34, with each electing one, two or three Councillors. The overall number of Councillors remained 70, with all seats are up for election at the same time. Elections would then be held every 4 years.