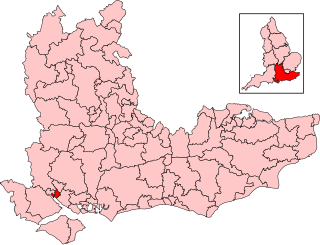
Southampton, Itchen is a constituency represented in the House of Commons of the UK Parliament since 2024 by Darren Paffey from the Labour Party (UK). Before then, it had been held since 2015 by Royston Smith GM of the Conservative Party, who had announced his retirement from frontline politics in 2023 and did not seek re-election in 2024.

Southampton Test is a constituency represented in the House of Commons of the UK Parliament by Satvir Kaur, a member of the Labour Party since 2024.
Birmingham Yardley is a constituency of part of the city of Birmingham represented in the House of Commons of the UK Parliament since 2015 by Jess Phillips of the Labour Party.

Leyton and Wanstead is a constituency in Greater London created in 1997 and represented in the House of Commons of the UK Parliament since 2024 by Calvin Bailey of the Labour Party.

Amber Valley is a constituency in Derbyshire, represented in the House of Commons of the UK Parliament. It has been represented in Parliament by Linsey Farnsworth, a Labour politician, since the 2024 general election.

Birmingham Selly Oak is a constituency in the West Midlands, represented in the House of Commons of the UK Parliament since 2024 by Alistair Carns of the Labour Party.
Morecambe and Lunesdale is a constituency represented in the House of Commons of the UK Parliament since the 2024 general election by Lizzi Collinge for Labour.

Manchester Withington is a constituency represented in the House of Commons of the UK Parliament since 2015 by Jeff Smith of Labour.

Brighton Kemptown and Peacehaven is a constituency represented in the House of Commons of the UK Parliament since the 2024 general election by Chris Ward of the Labour Party.

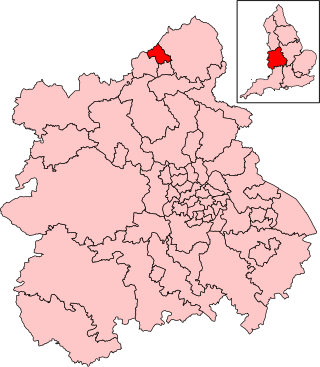
North East Derbyshire is a constituency created in 1885 represented in the House of Commons of the UK Parliament since 2024 by Louise Jones of the Labour Party.

Lichfield is a constituency in Staffordshire represented in the House of Commons of the UK Parliament since 2024 by Dave Robertson of the Labour Party.

Stoke-on-Trent Central is a constituency in Staffordshire. It has been represented by Gareth Snell of the Labour Party since 2024. He previously represented the constituency between 2017 and 2019. He succeeded Jo Gideon of the Conservative Party who defeated him in the general election of 2019. She announced in early 2023 that she would not be seeking reelection and accordingly left office at the dissolution of that parliament.
Stoke-on-Trent North is a constituency represented in the House of Commons of the UK Parliament by David Williams, a member of the Labour Party.

Stoke-on-Trent South is a constituency created in 1950, and represented in the House of Commons of the UK Parliament since 2024 by Allison Gardner, a Labour party representative. The local electorate returned a Labour MP in every election until 2017, when Jack Brereton became its first Conservative MP. The seat is non-rural and in the upper valley of the Trent covering half of the main city of the Potteries, a major ceramics centre since the 17th century.

Stone was a constituency in Staffordshire in the House of Commons of the UK Parliament. It was represented since its 1997 recreation by Sir Bill Cash, a Conservative. On 9 June 2023, he announced his intention to stand down at the 2024 general election.

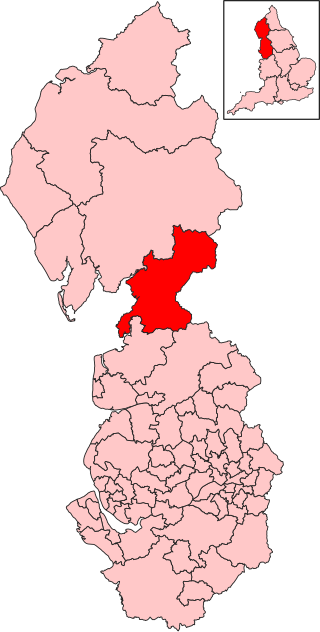
Wolverhampton South East is a constituency in West Midlands that was created in 1974. The seat has been represented in the House of Commons of the Parliament of the United Kingdom by Pat McFadden of the Labour Party since 2005. McFadden currently serves as Chancellor of the Duchy of Lancaster under the government of Keir Starmer.

Stevenage is a constituency in Hertfordshire represented in the House of Commons of the UK Parliament since 2024 by Kevin Bonavia, a member of the Labour Party.

Kenilworth and Southam is a constituency in Warwickshire, England represented in the House of Commons of the UK Parliament since 2010 by Jeremy Wright, a Conservative who served as Culture Secretary until 24 July 2019, having previously served as Attorney General for England and Wales from 2014 to 2018.

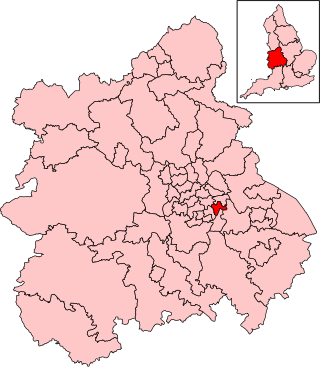
Mid Derbyshire is a constituency represented in the House of Commons of the UK Parliament. The Member of Parliament has been Jonathan Davies of the Labour Party since the 2024 United Kingdom general election. As with all constituencies, the constituency elects one Member of Parliament (MP) by the first past the post system of election at least every five years.
East Staffordshire Borough Council elections are held every four years. East Staffordshire is a non-metropolitan district with borough status in Staffordshire, England. The Borough Council area of East Staffordshire covers three main settlements such as Burton-Upon-Trent, Uttoxeter and Tutbury, as well several rural towns and villages, such as Barton-under-Needwood, Stramshall, Weaver, Draycott in the Clay, Rolleston-on-Dove, Needwood and Abbots Bromley.


