This article needs more links to other articles to help integrate it into the encyclopedia . (April 2017) (Learn how and when to remove this template message) |
Elections to Calderdale Metropolitan Borough Council were held on 1 May 2008. One third of the council was up for election and the council stayed under no overall control with a minority Conservative administration.
Calderdale Metropolitan Borough Council is the local authority of the Metropolitan Borough of Calderdale in West Yorkshire, England. It is a metropolitan district council, one of five in West Yorkshire and one of 36 in the metropolitan counties of England, and provides the majority of local government services in Calderdale. Since 1 April 2014 it has been a constituent council of the West Yorkshire Combined Authority.
In the context of local authorities in the United Kingdom, the term no overall control refers to a situation in which no single political group achieves a majority of seats; and is analogous to a hung parliament. Of the 310 councils who had members up for election in the 2007 local elections, 85 resulted in a NOC administration.
The Conservative Party, officially the Conservative and Unionist Party, is a centre-right political party in the United Kingdom. Presently led by Theresa May, it has been the governing party since 2010. It presently has 314 Members of Parliament in the House of Commons, 249 members of the House of Lords, and 18 members of the European Parliament. It also has 31 Members of the Scottish Parliament, 12 members of the Welsh Assembly, eight members of the London Assembly and 9,008 local councillors. One of the major parties of UK politics, it has formed the government on 45 occasions, more than any other party.
On 9 May, about a week after being elected as a Liberal Democrat, Greetland and Stainland Councillor Keith Watson left the Liberal Democrats and joined the Conservative Party. [1]
In 2009 the Skircoat Councillor Geoffrey Wainwright died suddenly. A by-election was held on 2 April 2009. The seat was held by the Conservative Party with John Hardy winning the seat. [2]
In June 2009 Elland Councillor Diane Park quit the Liberal Democrats due to the state of the party in the House of Commons. She continued as an independent. [3]
Prior to the election the composition of the council was:
18 | 17 | 11 | 3 | 1 | 1 |
Conservative | Lib Dem | Labour | Ind | BN | ED |
After the election the composition of the council was:
20 | 17 | 9 | 2 | 2 | 1 |
Conservative | Lib Dem | Labour | Ind | BN | ED |
Party | Previous council | New council | |||
---|---|---|---|---|---|
Conservative | 18 | 20 | |||
Liberal Democrat | 17 | 17 | |||
Labour | 11 | 9 | |||
Independent | 3 | 2 | |||
BNP | 1 | 2 | |||
English Democrat | 1 | 1 | |||
Total | 51 | 51 |
Party | Candidate | Votes | % | ± | |
---|---|---|---|---|---|
Conservative | Howard Blagbrough | 1,329 | 40.17 | ||
Liberal Democrat | Nick Yates | 1,250 | 37.78 | ||
Labour | Ann Martin | 729 | 22.03 | ||
Majority | 79 | ||||
Turnout | 3,308 | 39.1 | |||
Conservative gain from Liberal Democrat | Swing | ||||
The incumbent was Nick Yates for the Liberal Democrats.
Party | Candidate | Votes | % | ± | |
---|---|---|---|---|---|
Liberal Democrat | Janet Mary Battye | 1,188 | 32.11 | ||
Labour Co-op | Janet Lynne Oosthuysen | 1,135 | 30.68 | ||
Conservative | Beverley Anne Carter | 890 | 24.06 | ||
Green | Ruby Rose Joy Berridge | 486 | 13.13 | ||
Majority | 53 | ||||
Turnout | 3,699 | 41.52 | |||
Liberal Democrat hold | Swing | ||||
The incumbent was Janet Battye for the Liberal Democrats.
Party | Candidate | Votes | % | ± | |
---|---|---|---|---|---|
Liberal Democrat | Pat Allen | 1,203 | 44.01 | ||
Conservative | Christian Corkish | 800 | 29.27 | ||
Labour Co-op | Stewart Brown | 312 | 11.41 | ||
English Democrat | Mick Clarke | 262 | 9.58 | ||
Green | Susan Ann Thomas | 156 | 5.70 | ||
Majority | 403 | ||||
Turnout | 2,733 | 33.39 | |||
Liberal Democrat hold | Swing | ||||
The incumbent was Pat Allen for the Liberal Democrats.
Party | Candidate | Votes | % | ± | |
---|---|---|---|---|---|
Liberal Democrat | Keith Watson | 1,404 | 45.71 | ||
Conservative | John Frank Brearley Ford | 958 | 31.19 | ||
Labour | Pamela Fellows | 251 | 8.17 | ||
BNP | Michael Hall | 229 | 7.45 | ||
Green | Mark Mullany | 170 | 5.53 | ||
English Democrat | Johnathan Paul Rogan | 59 | 1.92 | ||
Majority | 446 | ||||
Turnout | 3,071 | 36.68 | |||
Liberal Democrat hold | Swing | ||||
The incumbent was Keith Watson for the Liberal Democrats.
Party | Candidate | Votes | % | ± | |
---|---|---|---|---|---|
Conservative | Graham Thomas Hall | 2,209 | 68.49 | ||
Liberal Democrat | Jim Souper | 578 | 17.92 | ||
Labour | Susan Press | 438 | 13.58 | ||
Majority | 1,631 | ||||
Turnout | 3,225 | 38.44 | |||
Conservative hold | Swing | ||||
The incumbent was Graham Hall for the Conservative Party
Party | Candidate | Votes | % | ± | |
---|---|---|---|---|---|
BNP | Tom Bates | 1,323 | 38.34 | ||
Labour | Judy Gannon | 1,014 | 29.39 | ||
Conservative | Jon Shaw | 796 | 23.07 | ||
Liberal Democrat | Michael Murray Elder | 193 | 5.59 | ||
Independent | Sean Vincent Loftus | 124 | 3.59 | ||
Majority | 309 | ||||
Turnout | 3,450 | 37.12 | |||
BNP gain from Labour | Swing | ||||
The incumbent was Judith Gannon for the Labour Party.
Party | Candidate | Votes | % | ± | |
---|---|---|---|---|---|
Liberal Democrat | Christine Irene Bampton-Smith | 1,301 | 41.35 | ||
Conservative | Sarah Jane Jennings | 1,016 | 32.29 | ||
Labour | James Edward Fearon | 513 | 16.3 | ||
BNP | John Derek Gregory | 316 | 10.04 | ||
Majority | 285 | ||||
Turnout | 3,146 | 40.97 | |||
Liberal Democrat hold | Swing | ||||
The incumbent was Christine Bampton-Smith for the Liberal Democrats.
Party | Candidate | Votes | % | ± | |
---|---|---|---|---|---|
Conservative | Graham Edward Alexander Reason | 1,745 | 49.0 | ||
Labour Co-op | Gary Rae | 524 | 14.71 | ||
Independent | Raymond Pearson | 387 | 10.86 | ||
English Democrat | John William Dowson | 343 | 9.63 | ||
BNP | Chris Godridge | 322 | 9.04 | ||
Liberal Democrat | John Christopher Beacroft-Mitchell | 240 | 6.73 | ||
Majority | 1,221 | ||||
Turnout | 3,561 | 40.15 | |||
Conservative hold | Swing | ||||
The incumbent was Graham Reason for the Conservative Party.
Party | Candidate | Votes | % | ± | |
---|---|---|---|---|---|
Labour Co-op | Danielle Sara Eleana Coombs | 847 | 44.81 | ||
BNP | Jane Shooter | 564 | 29.84 | ||
Conservative | John Cecil David Hardy | 479 | 25.34 | ||
Liberal Democrat | Malcolm Graham James | 248 | 13.12 | ||
Majority | 283 | ||||
Turnout | 1,890 | 25.38 | |||
Labour Co-op hold | Swing | ||||
The incumbent was Danielle Coombs for the Labour Party.
Party | Candidate | Votes | % | ± | |
---|---|---|---|---|---|
Liberal Democrat | Mohammad Ilyas | 1,838 | 41.33 | ||
Labour | Mohammed Najib | 1,678 | 37.73 | ||
Conservative | Craig Anthony Stanton | 489 | 10.99 | ||
Independent | Shakar Saghir | 442 | 9.93 | ||
Majority | 160 | ||||
Turnout | 4,447 | 50.85 | |||
Liberal Democrat gain from Labour | Swing | ||||
The incumbent was Mohammed Najib for the Labour Party.
Party | Candidate | Votes | % | ± | |
---|---|---|---|---|---|
Conservative | Ann McAllister | 1,546 | 49.03 | ||
Labour Co-op | George Edward Richardson | 666 | 21.12 | ||
English Democrat | David Vincent Stevenson | 516 | 16.36 | ||
Liberal Democrat | Philip Jeffery | 425 | 13.47 | ||
Majority | 880 | ||||
Turnout | 3,153 | 37.14 | |||
Conservative hold | Swing | ||||
The incumbent was Ann McAllister for the Conservative Party.
Party | Candidate | Votes | % | ± | |
---|---|---|---|---|---|
Conservative | Geraldine Mary Carter | 1,667 | 54.17 | ||
Liberal Democrat | Ashley John Richard Evans | 908 | 29.50 | ||
Labour | Lesley Anne Sleigh | 502 | 16.31 | ||
Majority | 759 | ||||
Turnout | 3,077 | 36.05 | |||
Conservative hold | Swing | ||||
The incumbent was Geraldine Carter for the Conservative Party.
Party | Candidate | Votes | % | ± | |
---|---|---|---|---|---|
Conservative | Geoffrey Wainwright | 2,132 | 54.01 | ||
Liberal Democrat | Pauline Nash | 1,305 | 33.06 | ||
Labour Co-op | Marion Simone Batten | 308 | 7.80 | ||
Green | Viv Smith | 202 | 5.11 | ||
Majority | 827 | ||||
Turnout | 3,947 | 42.21 | |||
Conservative hold | Swing | ||||
The incumbent was Geoffrey Wainwright for the Conservative Party.
Party | Candidate | Votes | % | ± | |
---|---|---|---|---|---|
Conservative | Amanda Louise Byrne | 1,252 | 42.57 | ||
Labour Co-op | Dave Draycott | 864 | 29.37 | ||
Liberal Democrat | John Boje Frederiksen | 365 | 12.41 | ||
BNP | Stuart Brian Gill | 357 | 12.13 | ||
English Democrat | Tom Mathieson | 103 | 3.50 | ||
Majority | 388 | ||||
Turnout | 2,941 | 35.73 | |||
Conservative hold | Swing | ||||
The incumbent was Amanda Byrne for the Conservative Party.
Party | Candidate | Votes | % | ± | |
---|---|---|---|---|---|
Conservative | Ian Cooper | 1,048 | 32.53 | ||
Liberal Democrat | Hilary Alice Myers | 912 | 28.31 | ||
Labour | Steph Booth | 853 | 26.48 | ||
BNP | Christian Michael Jackson | 408 | 12.66 | ||
Majority | 136 | ||||
Turnout | 3,221 | 37.92 | |||
Conservative gain from Liberal Democrat | Swing | ||||
The incumbent was Anne Townley for the Liberal Democrats.
Party | Candidate | Votes | % | ± | |
---|---|---|---|---|---|
Labour Co-op | Megan Kathleen Swift | 1,055 | 39.48 | ||
Conservative | Chris Pillai | 649 | 24.28 | ||
BNP | Anthony Bentley | 403 | 15.08 | ||
Independent | Robert Philip Andrew Reynolds | 292 | 10.92 | ||
Liberal Democrat | Brendan Robert Stubbs | 273 | 10.21 | ||
Majority | 406 | ||||
Turnout | 2,672 | 31.07 | |||
Labour Co-op hold | Swing | ||||
The incumbent was Megan Swift for the Labour Party.
Party | Candidate | Votes | % | ± | |
---|---|---|---|---|---|
Liberal Democrat | Robert Pearson | 1,681 | 51.81 | ||
Conservative | Sally Victoria McCartney | 708 | 21.82 | ||
BNP | Paul Wadsworth | 433 | 13.34 | ||
Labour | Anne Collins | 422 | 13.00 | ||
Majority | 973 | ||||
Turnout | 3,244 | 38.05 | |||
Liberal Democrat gain from Independent | Swing | ||||
The incumbent was Allen Clegg as an Independent.
Party | Candidate | Votes | % | ± | |
---|---|---|---|---|---|
Conservative | John Cecil David Hardy | 1,327 | 36.78 | ||
Liberal Democrat | Pauline Nash | 1,209 | 33.51 | ||
Labour | Anne Collins | 274 | 7.59 | ||
Independent | Paul Brannigan | 238 | 6.60 | ||
BNP | Chris Godridge | 235 | 6.51 | ||
Independent | Philip Maxwell Crossley | 229 | 6.35 | ||
Green | Viv Smith | 92 | 2.55 | ||
Majority | 118 | 3.28 | |||
Turnout | 3,608 | 38.07 | |||
Conservative hold | Swing | ||||
Elections to Calderdale Metropolitan Borough Council were held on 4 May 2006. One third of the council was up for election and the council stayed under no overall control with a minority Conservative administration.
Elections to Calderdale Metropolitan Borough Council were held on 6 May 1999. One third of the council was up for election and the Labour party lost overall control of the council to no overall control. The overall turnout of the election was 30.09%. The winning candidate in each ward is highlighted in bold.
Elections to Calderdale Metropolitan Borough Council were held on 4 May 2000. One third of the council was up for election and the Conservative party gained overall control of the council from no overall control. The total turnout of the election was 28.97%. The winning candidate in each ward is highlighted in bold.
Elections to Calderdale Metropolitan Borough Council were held on 2 May 2002. One third of the council was up for election and the Conservative party lost overall control of the council to no overall control. The total turnout of the election was 32.16%. The winning candidate in each ward is highlighted in bold.
Elections to Calderdale Metropolitan Borough Council were held on 1 May 2003. One third of the council was up for election and the council stayed under no overall control. The total turnout of the election was 34.44%. The winning candidate(s) in each ward is highlighted in bold.
Elections to Calderdale Metropolitan Borough Council were held on 3 May 2007 with the exception of the Warley ward which was postponed until 14 June 2007 due to the sudden death of one of the candidates. One third of the council was up for election and the council stayed under no overall control with a minority Conservative administration. The total turnout of the election was 38.01%. The winning candidate in each ward is highlighted in bold.
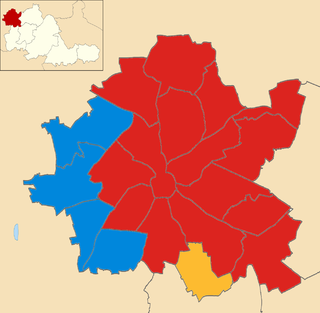
Elections to Wolverhampton City Council was held on 5 May 2011, the same day as the national referendum on the Alternative Vote, in Wolverhampton, England. One third of the council was up for election.
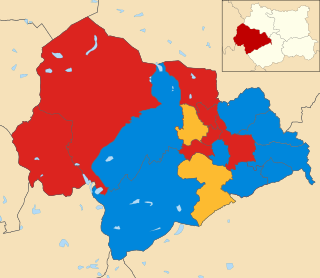
Elections to Calderdale Metropolitan Borough Council took place on Thursday 5 May 2011.
The 2010 Calderdale Metropolitan Borough Council election took place on 6 May 2010 to elect members of Calderdale Metropolitan Borough Council in England. This was on the same day as other local elections and a general election. One councillor was elected in each ward for a four-year term so the councillors elected in 2010 last stood for election in 2006. Each ward is represented by three councillors, the election of which is staggered, so only one third of the councillors was elected in this election. After the election the council stayed in no overall control but the Conservative minority administration was replaced with a coalition between Labour and the Liberal Democrats.
The 2012 Calderdale Metropolitan Borough Council election took place on 3 May 2012 to elect members of Calderdale Metropolitan Borough Council in West Yorkshire, England. This was on the same day as other United Kingdom local elections, 2012. After the election the council continued to have no overall control and continue to be run by a coalition between the Labour Party and the Liberal Democrats.
The 2014 Calderdale Metropolitan Borough Council election took place on 22 May 2014 to elect members of Calderdale Metropolitan Borough Council in England. This was on the same day as local elections across the United Kingdom and a European election. One councillor was elected in each of the 17 wards for a four-year term. There are three councillors representing each ward elected on a staggered basis so one third of the councillor seats were up for re-election. The seats had previously been contested in 2010 which was held in conjunction with a general election. The turnout was significantly lower in 2014 than in 2010 which is not unusual when comparing local elections that coincide with general elections to ones that do not. Prior to the election Labour was the largest party in the council with 21 out of 51 seats, 5 seats short of an overall majority. After the election there was no overall control of the council. Labour had 25 seats, only one short of a majority and so Labour continued to operate a minority administration.
The 2003 Rother District Council election took place on 1 May 2003 to elect members of Rother District Council in East Sussex, England. The whole council was up for election after boundary changes reduced the number of seats by 7. The Conservative party stayed in overall control of the council.
The 2015 Calderdale Metropolitan Borough Council election took place on 7 May 2015 to elect members of Calderdale in England. This was on the same day as other local elections and a general election. One councillor was elected in each ward for a four-year term so the councillors elected in 2015 last stood for election in 2011. Each ward is represented by three councillors, the election of which is staggered, so only one third of the councillors were elected in this election. Before the election there was no overall control with a minority Labour administration which was over-ruled at a Budget vote by a coalition of Conservatives & Liberal Democrats leading to a Conservative minority administration. After the election there was still no overall control & a Labour minority administration was formed again.
The 2015 West Oxfordshire District Council election took place on 22 May 2015 to elect members of West Oxfordshire District Council in Oxfordshire, England. One third of the council was up for election and the Conservative party stayed in overall control of the council.
The 2016 Calderdale Metropolitan Borough Council election took place on 5 May 2016 to elect members of Calderdale Metropolitan Borough Council in England. This was on the same day as other local elections. One councillor was elected in each ward for a four-year term so the councillors elected in 2016 last stood for election in 2012. Each ward is represented by three councillors, the election of which is staggered, so only one third of the councillors was elected in this election. Before the election there was no overall control with a minority Labour administration. After the election there was still no overall control so the minority Labour administration continued.
Skircoat is an electoral ward in Calderdale, West Yorkshire, England, and returns three members to sit on Calderdale Metropolitan Borough Council. The population at the 2011 Census was 12,712. It covers the area of Skircoat Green.
The 2018 Calderdale Metropolitan Borough Council election took place on 3 May 2018 to elect members of Calderdale Metropolitan Borough Council in England. This was on the same day as other local elections. One councillor was elected in each ward for a four-year term so the councillors elected in 2018 last stood for election in 2014. Each ward is represented by three councillors, the election of which is staggered, so only one third of the councillors were elected in this election. Before the election there was no overall control with a minority Labour administration. Following the election Labour, having gained one councillor, was still two councillors away from a majority so it remained no overall control.
The 2018 City of Bradford Metropolitan District Council took place on 3 May 2018 to elect members of Bradford District Council in England. This was on the same day as other local elections. One councillor was elected in each ward for a four-year term so the councillors elected in 2018 last stood for election in 2014. Each ward is represented by three councillors, the election of which is staggered, so only one third of the councillors were elected in this election. Before the election there was a Labour majority and afterwards Labour had increased their majority.
The 2018 Sunderland City Council election took place on 3 May 2018 to elect members of Sunderland City Council in England. The election took place on the same day as other local elections.