Chatham | |
---|---|
Former Borough constituency for the House of Commons | |
County | Kent |
Major settlements | Chatham |
1832–1950 | |
Number of members | One |
Replaced by | Rochester & Chatham |
Created from | Kent |
Chatham was a parliamentary constituency in Kent which returned one Member of Parliament (MP) to the House of Commons of the Parliament of the United Kingdom. It was created for the 1832 general election, when the borough of Chatham was enfranchised under the Reform Act 1832.
It was abolished for the 1950 general election, when it was largely replaced by the new Rochester and Chatham constituency. This then became Medway in 1983. When the boroughs of Rochester upon Medway and Gillingham merged to form the larger unitary Borough of Medway in 1998, the Parliamentary constituency of Medway only covered part of the new borough, so for the 2010 election it was renamed Rochester and Strood.
1918–1950: The Borough of Rochester except part of St Peter's ward, and the Borough of Chatham wards of Luton and St John.
Party | Candidate | Votes | % | ±% | |
---|---|---|---|---|---|
Whig | William Leader Maberly | 363 | 59.4 | ||
Radical | Thomas Erskine Perry | 248 | 40.6 | ||
Majority | 115 | 18.8 | |||
Turnout | 611 | 90.3 | |||
Registered electors | 677 | ||||
Whig win (new seat) |
Maberly resigned on appointment as a Commissioner of Customs, causing a by-election.
Party | Candidate | Votes | % | ±% | |
---|---|---|---|---|---|
Whig | George Byng | 262 | 57.7 | −1.7 | |
Tory | William Ching | 192 | 42.3 | New | |
Majority | 70 | 15.4 | −3.4 | ||
Turnout | 454 | 67.2 | −23.1 | ||
Registered electors | 676 | ||||
Whig hold | Swing | N/A | |||
Party | Candidate | Votes | % | ±% | |
---|---|---|---|---|---|
Conservative | John Beresford | 323 | 52.0 | N/A | |
Whig | George Byng | 298 | 48.0 | −11.4 | |
Majority | 25 | 4.0 | N/A | ||
Turnout | 621 | 92.4 | +2.1 | ||
Registered electors | 672 | ||||
Conservative gain from Whig | Swing | N/A | |||
Party | Candidate | Votes | % | ±% | |
---|---|---|---|---|---|
Whig | George Byng | Unopposed | |||
Registered electors | 785 | ||||
Whig gain from Conservative |
Party | Candidate | Votes | % | ±% | |
---|---|---|---|---|---|
Whig | George Byng | 457 | 66.1 | N/A | |
Conservative | Price Blackwood | 234 | 33.9 | New | |
Majority | 223 | 32.2 | N/A | ||
Turnout | 691 | 80.2 | N/A | ||
Registered electors | 862 | ||||
Whig hold | Swing | N/A | |||
Party | Candidate | Votes | % | ±% | |
---|---|---|---|---|---|
Whig | George Byng | Unopposed | |||
Registered electors | 1,145 | ||||
Whig hold |
Party | Candidate | Votes | % | ±% | |
---|---|---|---|---|---|
Conservative | Frederick Smith | 636 | 56.9 | New | |
Whig | James Stirling [8] [9] | 482 | 43.1 | N/A | |
Majority | 154 | 13.8 | N/A | ||
Turnout | 1,118 | 81.5 | N/A | ||
Registered electors | 1,371 | ||||
Conservative gain from Whig | Swing | ||||
The election was declared void on petition, due to bribery, causing a by-election. [10]
Party | Candidate | Votes | % | ±% | |
---|---|---|---|---|---|
Conservative | Leicester Viney Vernon | 610 | 50.5 | −6.4 | |
Whig | James Stirling [9] | 598 | 49.5 | +6.4 | |
Majority | 12 | 1.0 | −12.8 | ||
Turnout | 1,208 | 90.2 | +8.7 | ||
Registered electors | 1,339 | ||||
Conservative hold | Swing | −6.4 | |||
Party | Candidate | Votes | % | ±% | |
---|---|---|---|---|---|
Conservative | Frederick Smith | 672 | 51.1 | −5.8 | |
Whig | William Govett Romaine [11] | 643 | 48.9 | +5.8 | |
Majority | 29 | 2.2 | −11.6 | ||
Turnout | 1,315 | 89.9 | +8.4 | ||
Registered electors | 1,463 | ||||
Conservative hold | Swing | −5.8 | |||
Party | Candidate | Votes | % | ±% | |
---|---|---|---|---|---|
Conservative | Frederick Smith | 713 | 52.2 | +1.1 | |
Liberal | Arthur Otway | 652 | 47.8 | −1.1 | |
Majority | 61 | 4.4 | +2.2 | ||
Turnout | 1,365 | 88.4 | −1.5 | ||
Registered electors | 1,544 | ||||
Conservative hold | Swing | +1.1 | |||
Party | Candidate | Votes | % | ±% | |
---|---|---|---|---|---|
Liberal | Arthur Otway | 986 | 58.3 | +10.5 | |
Conservative | George Elliot | 704 | 41.7 | −10.5 | |
Majority | 282 | 16.6 | N/A | ||
Turnout | 1,690 | 80.3 | −8.1 | ||
Registered electors | 2,104 | ||||
Liberal gain from Conservative | Swing | +10.5 | |||
Party | Candidate | Votes | % | ±% | |
---|---|---|---|---|---|
Liberal | Arthur Otway | 2,042 | 52.4 | −5.9 | |
Conservative | George Elliot | 1,858 | 47.6 | +5.9 | |
Majority | 184 | 4.8 | −11.8 | ||
Turnout | 3,900 | 86.3 | +6.0 | ||
Registered electors | 4,518 | ||||
Liberal hold | Swing | −5.9 | |||
Party | Candidate | Votes | % | ±% | |
---|---|---|---|---|---|
Conservative | George Elliot | 2,132 | 59.1 | +11.5 | |
Liberal | Arthur Otway | 1,476 | 40.9 | −11.5 | |
Majority | 656 | 18.2 | N/A | ||
Turnout | 3,608 | 80.8 | −5.5 | ||
Registered electors | 4,468 | ||||
Conservative gain from Liberal | Swing | +11.5 | |||
Elliot resigned, causing a by-election.
Party | Candidate | Votes | % | ±% | |
---|---|---|---|---|---|
Conservative | John Eldon Gorst | 2,173 | 52.6 | −6.5 | |
Liberal | William Henry Stone [12] | 1,958 | 47.4 | +6.5 | |
Majority | 215 | 5.2 | −13.0 | ||
Turnout | 4,131 | 83.7 | +2.9 | ||
Registered electors | 4,935 | ||||
Conservative hold | Swing | −6.5 | |||
Party | Candidate | Votes | % | ±% | |
---|---|---|---|---|---|
Conservative | John Eldon Gorst | 2,499 | 51.0 | −8.1 | |
Liberal | Henry Carr Glyn [13] | 2,398 | 49.0 | +8.1 | |
Majority | 101 | 2.0 | −16.2 | ||
Turnout | 4,897 | 88.3 | +7.5 | ||
Registered electors | 5,548 | ||||
Conservative hold | Swing | −8.1 | |||
Gorst was appointed Solicitor General for England and Wales, requiring a by-election.
Party | Candidate | Votes | % | ±% | |
---|---|---|---|---|---|
Conservative | John Eldon Gorst | Unopposed | |||
Conservative hold |
Party | Candidate | Votes | % | ±% | |
---|---|---|---|---|---|
Conservative | John Eldon Gorst | 3,396 | 56.5 | +5.5 | |
Liberal | Robert Collier | 2,610 | 43.5 | −5.5 | |
Majority | 786 | 13.0 | +11.0 | ||
Turnout | 6,006 | 85.9 | +2.4 | ||
Registered electors | 6,988 | ||||
Conservative hold | Swing | +5.5 | |||
Party | Candidate | Votes | % | ±% | |
---|---|---|---|---|---|
Conservative | John Eldon Gorst | 3,187 | 56.8 | +0.3 | |
Liberal | Andrew Clarke | 2,422 | 43.2 | −0.3 | |
Majority | 765 | 13.6 | +0.6 | ||
Turnout | 5,609 | 80.3 | −5.6 | ||
Registered electors | 6,988 | ||||
Conservative hold | Swing | +0.3 | |||
Party | Candidate | Votes | % | ±% | |
---|---|---|---|---|---|
Conservative | Lewis Vivian Loyd | 3,777 | 52.6 | −4.2 | |
Liberal | Andrew Clarke | 3,400 | 47.4 | +4.2 | |
Majority | 377 | 5.2 | −8.4 | ||
Turnout | 7,177 | 83.2 | +2.9 | ||
Registered electors | 8,629 | ||||
Conservative hold | Swing | −4.2 | |||
Party | Candidate | Votes | % | ±% | |
---|---|---|---|---|---|
Conservative | Horatio Davies | 4,082 | 53.8 | +1.2 | |
Liberal | Robert Hippisley Cox | 3,499 | 46.2 | −1.2 | |
Majority | 583 | 7.6 | +2.4 | ||
Turnout | 7,581 | 82.4 | −0.8 | ||
Registered electors | 9,199 | ||||
Conservative hold | Swing | +1.2 | |||
Party | Candidate | Votes | % | ±% | |
---|---|---|---|---|---|
Conservative | Horatio Davies | Unopposed | |||
Conservative hold |
Party | Candidate | Votes | % | ±% | |
---|---|---|---|---|---|
Labour Repr. Cmte. | John Jenkins | 6,692 | 62.5 | New | |
Conservative | John Eustace Jameson | 4,020 | 37.5 | N/A | |
Majority | 2,672 | 25.0 | N/A | ||
Turnout | 10,712 | 79.7 | N/A | ||
Registered electors | 13,432 | ||||
Labour Repr. Cmte. gain from Conservative |
Party | Candidate | Votes | % | ±% | |
---|---|---|---|---|---|
Conservative | Gerald Hohler | 7,411 | 54.7 | +17.2 | |
Labour | John Jenkins | 6,130 | 45.3 | −17.2 | |
Majority | 1,281 | 9.4 | N/A | ||
Turnout | 13,541 | 85.7 | +6.0 | ||
Registered electors | 15,799 | ||||
Conservative gain from Labour | Swing | +17.2 | |||
Party | Candidate | Votes | % | ±% | |
---|---|---|---|---|---|
Conservative | Gerald Hohler | 6,989 | 56.4 | +1.7 | |
Liberal | Louis Bernacchi | 4,302 | 34.7 | New | |
Labour | Frank Smith | 1,103 | 8.9 | −36.4 | |
Majority | 2,687 | 21.7 | +12.3 | ||
Turnout | 12,394 | 78.4 | −7.3 | ||
Registered electors | 15,799 | ||||
Conservative hold |
Party | Candidate | Votes | % | ±% | |
---|---|---|---|---|---|
Unionist | John Moore-Brabazon | 11,454 | 62.4 | +6.0 | |
Labour | Dansy Hubbard | 4,134 | 22.5 | +13.6 | |
Liberal | H. B. D. Woodcock | 2,778 | 15.1 | −19.6 | |
Majority | 7,320 | 39.9 | +18.2 | ||
Turnout | 18,366 | 59.2 | −19.2 | ||
Registered electors | 31,000 | ||||
Unionist hold | Swing | -3.8 | |||
Party | Candidate | Votes | % | ±% | |
---|---|---|---|---|---|
Unionist | John Moore-Brabazon | 11,335 | 51.5 | −10.9 | |
Liberal | Alfred John Callaghan | 10,682 | 48.5 | +33.4 | |
Majority | 653 | 3.0 | −36.9 | ||
Turnout | 22,017 | 69.8 | +10.6 | ||
Registered electors | 31,525 | ||||
Unionist hold | Swing | −22.1 | |||
Party | Candidate | Votes | % | ±% | |
---|---|---|---|---|---|
Unionist | John Moore-Brabazon | 9,994 | 41.6 | −9.9 | |
Liberal | Alfred John Callaghan | 8,227 | 34.3 | −14.2 | |
Labour | Mary Hamilton | 5,794 | 24.1 | New | |
Majority | 1,767 | 7.3 | +4.3 | ||
Turnout | 24,015 | 74.6 | +4.8 | ||
Registered electors | 32,212 | ||||
Unionist hold | Swing | +2.2 | |||
Party | Candidate | Votes | % | ±% | |
---|---|---|---|---|---|
Unionist | John Moore-Brabazon | 13,184 | 52.2 | +10.6 | |
Labour | William Harvey Moore | 9,276 | 36.7 | +12.6 | |
Liberal | Cyril Berkeley Dallow | 2,806 | 11.1 | −23.2 | |
Majority | 3,908 | 15.5 | +8.2 | ||
Turnout | 25,266 | 77.8 | +3.2 | ||
Registered electors | 32,481 | ||||
Unionist hold | Swing | +10.6 | |||
Party | Candidate | Votes | % | ±% | |
---|---|---|---|---|---|
Labour | Frank Markham | 13,007 | 42.6 | +5.9 | |
Unionist | John Moore-Brabazon | 12,231 | 40.1 | −12.1 | |
Liberal | George H Bryans | 5,284 | 17.3 | +6.2 | |
Majority | 776 | 2.5 | N/A | ||
Turnout | 30,522 | 74.5 | −3.3 | ||
Registered electors | 40,980 | ||||
Labour gain from Unionist | Swing | +9.0 | |||
Party | Candidate | Votes | % | ±% | |
---|---|---|---|---|---|
Conservative | Park Goff | 19,991 | 62.5 | +22.4 | |
Labour | Oliver Baldwin | 10,837 | 33.9 | −8.7 | |
New Party | Martin Woodroffe | 1,135 | 3.6 | New | |
Majority | 9,154 | 28.6 | New | ||
Turnout | 31,963 | 75.5 | +1.0 | ||
Registered electors | 42,356 | ||||
Conservative gain from Labour | Swing | +15.6 | |||
The sitting MP Sydney Frank Markham sought re-election as a National Labour candidate. However, the Conservatives refused to withdraw in his favour. As a result, he was forced to withdraw. Communist candidate Walter Hannington was also adopted [20] but subsequently withdrew. [21]
Party | Candidate | Votes | % | ±% | |
---|---|---|---|---|---|
Conservative | Leonard Plugge | 19,212 | 59.1 | −3.4 | |
Labour | Hugh Gaitskell | 13,315 | 40.9 | +7.0 | |
Majority | 5,897 | 18.2 | −10.4 | ||
Turnout | 32,527 | 74.6 | −0.9 | ||
Registered electors | 43,573 | ||||
Conservative hold | Swing | −5.3 | |||
Party | Candidate | Votes | % | ±% | |
---|---|---|---|---|---|
Labour | Arthur Bottomley | 19,250 | 55.3 | +14.4 | |
Conservative | Leonard Plugge | 15,534 | 44.7 | −14.4 | |
Majority | 3,716 | 10.6 | N/A | ||
Turnout | 34,784 | 72.1 | −2.5 | ||
Registered electors | 48,270 | ||||
Labour gain from Conservative | Swing | +14.4 | |||
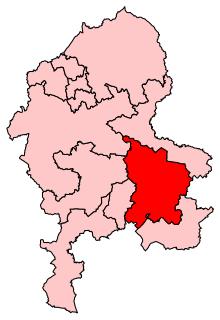
Lichfield is a constituency in Staffordshire represented in the House of Commons of the UK Parliament since its 1997 recreation by Michael Fabricant, a Conservative.
Medway was a county constituency represented in the House of Commons of the Parliament of the United Kingdom between 1983 and 2010. A previous constituency of the same name existed from 1885 to 1918.
Greenock was a burgh constituency represented in the House of Commons of the Parliament of the United Kingdom from 1832 until 1974, when it was abolished and its area was merged into the new Greenock and Port Glasgow constituency.
Dunbartonshire was a county constituency of the House of Commons of Great Britain from 1708 to 1801 and of the House of Commons of the Parliament of the United Kingdom from 1801 to 1950.
Clackmannanshire and Kinross-shire was a constituency of the House of Commons of the Parliament of the United Kingdom from 1832 to 1918.
Morpeth was a borough constituency centred on the town of Morpeth in Northumberland represented in the House of Commons of the Parliament of England until 1707, the Parliament of Great Britain from 1707 to 1800, and then the Parliament of the United Kingdom.
Warrington was a parliamentary constituency in the United Kingdom. From 1832 to 1983 it returned one Member of Parliament (MP) to the House of Commons of the Parliament of the United Kingdom.
Shrewsbury was a parliamentary constituency in England, centred on the town of Shrewsbury in Shropshire.
Tiverton was a constituency located in Tiverton in east Devon, formerly represented in the House of Commons of the Parliament of the United Kingdom. Enfranchised as a parliamentary borough in 1615 and first represented in 1621, it elected two Members of Parliament (MPs) by the first past the post system of election until 1885. The name was then transferred to a county constituency electing one MP.
Petersfield was an English Parliamentary constituency centred on the town of Petersfield in Hampshire. It existed for several hundred years until its abolition for the 1983 general election.
Whitehaven was a constituency centred on the town of Whitehaven in Cumberland, which returned one Member of Parliament (MP) to the House of Commons of the Parliament of the United Kingdom.
Hythe was a constituency centred on the town of Hythe in Kent. It returned two Members of Parliament to the House of Commons until 1832, when its representation was reduced to one member. The constituency was abolished for the 1950 general election, and replaced with the new Folkestone and Hythe constituency.
Hackney Central was a borough constituency in what was then the Metropolitan Borough of Hackney, in London. It returned one Member of Parliament (MP) to the House of Commons of the Parliament of the United Kingdom.
Rochester was a parliamentary constituency in Kent. It returned two members of parliament (MPs) to the House of Commons of England from 1295 to 1707, then to the House of Commons of Great Britain from 1708 to 1800, and finally to the House of Commons of the Parliament of the United Kingdom from 1801 until the 1885 general election, when its representation was reduced to one seat.
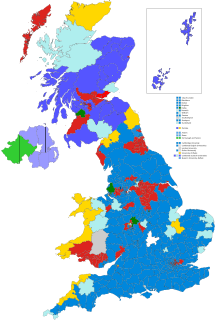
Barnstaple was a constituency centred on the town of Barnstaple in Devon, in the South West of England. It returned two Members of Parliament to the House of Commons of the Parliament of the United Kingdom until 1885, thereafter, one.
Bury was a borough constituency centred on the town of Bury in Lancashire. It returned one Member of Parliament (MP) to the House of Commons of the Parliament of the United Kingdom.
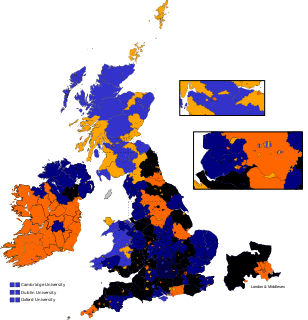
East Norfolk was a constituency in the county of Norfolk that returned two Members of Parliament to the House of Commons of the Parliament of the United Kingdom until 1868. A namesake was created in 1885 with representation of one member. That seat was abolished in 1950.
Southampton was a parliamentary constituency which was represented in the British House of Commons. Centred on the town of Southampton, it returned two members of parliament (MPs) from 1295 until it was abolished for the 1950 general election.
Monmouth Boroughs was a parliamentary constituency consisting of several towns in Monmouthshire. It returned one Member of Parliament (MP) to the House of Commons of the Parliaments of England, Great Britain, and finally the United Kingdom; until 1832 the constituency was known simply as Monmouth, though it included other "contributory boroughs".
Wilton was the name of a parliamentary borough in Wiltshire. It was represented in the House of Commons of the Parliament of England from 1295 to 1707, then in the Parliament of Great Britain from 1707 to 1800 and finally in the House of Commons of the United Kingdom of the Parliament of the United Kingdom from 1801 to 1918. It had two Members of Parliament (MPs) until 1832, but from 1832 to 1885 only one member, as a result of the Reform Act 1832. In 1885 the borough was abolished, but the name of the constituency was then transferred to a new county constituency electing one Member from 1885 until 1918.
Leigh Rayment's Historical List of MPs – Constituencies beginning with "C" (part 3)