Chislehurst | |
---|---|
Former county constituency for the House of Commons | |
County | Kent |
1918–1997 | |
Created from | Sevenoaks |
Replaced by | Bromley and Chislehurst |
Chislehurst was a parliamentary constituency in what is now the London Borough of Bromley. It returned one Member of Parliament (MP) to the House of Commons of the Parliament of the United Kingdom.
The constituency was created for the 1918 general election, and abolished for the 1997 general election, when it was partly replaced by the new Bromley and Chislehurst constituency. From 1885, most of the area of this constituency had been included in the Sevenoaks seat.
1918–1945: The Urban Districts of Chislehurst and Foot's Cray, the Rural District of Bromley, and part of the Rural District of Dartford.
1945–1950: The Urban Districts of Chislehurst and Sidcup, and Swanscombe, and the Rural District of Dartford. [1]
1950–1955: The Urban District of Chislehurst and Sidcup, and the parishes of Darenth, Stone, Sutton at Hone, and Wilmington in the Rural District of Dartford. [2]
1955–1974: The Urban District of Chislehurst and Sidcup. [3]
1974–1997: The London Borough of Bromley wards of Bickley, Chislehurst, Mottingham, Plaistow and Sundridge, and St Paul's Cray. [4] [5]
Election | Member | Party | |
---|---|---|---|
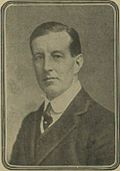
1918 | Sir Alfred Smithers | Unionist | |
1922 | Robert Nesbitt | Unionist | |
1924 | Sir Waldron Smithers | Conservative | |
1945 | George Wallace | Labour | |
1950 | Patricia Hornsby-Smith | Conservative | |
1966 | Alistair Macdonald | Labour | |
1970 | Patricia Hornsby-Smith | Conservative | |
Feb 1974 | Roger Sims | Conservative | |
1997 | constituency abolished |
Party | Candidate | Votes | % | ±% | |
---|---|---|---|---|---|
Conservative | Roger Sims | 24,761 | 58.4 | +0.8 | |
Labour | R. Ian Wingfield | 9,485 | 22.4 | +3.1 | |
Liberal Democrats | T. William M. Hawthorne | 6,683 | 15.8 | −7.2 | |
Liberal | I Richmond | 849 | 2.0 | New | |
Green | Frances M. Speed | 652 | 1.5 | New | |
Majority | 15,276 | 36.0 | +1.4 | ||
Turnout | 42,430 | 78.9 | +3.4 | ||
Conservative hold | Swing | −1.1 |
Party | Candidate | Votes | % | ±% | |
---|---|---|---|---|---|
Conservative | Roger Sims | 24,165 | 57.62 | +1.90 | |
Liberal | Richard Younger-Ross | 9,658 | 23.03 | −2.29 | |
Labour | Selwyn Ward | 8,115 | 19.35 | +0.90 | |
Majority | 14,507 | 34.59 | |||
Turnout | 41,938 | 75.52 | |||
Conservative hold | Swing |
Party | Candidate | Votes | % | ±% | |
---|---|---|---|---|---|
Conservative | Roger Sims | 22,108 | 55.72 | +1.19 | |
Liberal | Philip Lingard | 10,047 | 25.32 | +12.81 | |
Labour | Alistair Macdonald | 7,320 | 18.45 | −13.18 | |
BNP | Alfred Waite | 201 | 0.51 | New | |
Majority | 12,061 | 30.40 | |||
Turnout | 39,676 | 72.71 | |||
Conservative hold | Swing |
Party | Candidate | Votes | % | ±% | |
---|---|---|---|---|---|
Conservative | Roger Sims | 23,259 | 54.53 | +8.21 | |
Labour | Christopher Howes | 13,494 | 31.64 | −5.15 | |
Liberal | Brian Harry Taylor | 5,335 | 12.51 | −4.38 | |
National Front | Raymond Frederick George Hoy | 564 | 1.32 | New | |
Majority | 9,765 | 22.89 | |||
Turnout | 42,652 | 78.95 | |||
Conservative hold | Swing | +6.68 |
Party | Candidate | Votes | % | ±% | |
---|---|---|---|---|---|
Conservative | Roger Sims | 18,926 | 46.32 | +0.38 | |
Labour | Alistair Macdonald | 15,032 | 36.79 | +3.10 | |
Liberal | John Martin Crowley | 6,900 | 16.89 | −3.47 | |
Majority | 3,894 | 9.53 | |||
Turnout | 40,858 | 76.11 | |||
Conservative hold | Swing | -1.36 |
Party | Candidate | Votes | % | ±% | |
---|---|---|---|---|---|
Conservative | Roger Sims | 20,595 | 45.95 | ||
Labour | Alistair Macdonald | 15,102 | 33.69 | ||
Liberal | Robert Frank Webster | 9,127 | 20.36 | ||
Majority | 5,493 | 12.24 | |||
Turnout | 44,824 | 84.31 | |||
Conservative hold | Swing |
Party | Candidate | Votes | % | ±% | |
---|---|---|---|---|---|
Conservative | Patricia Hornsby-Smith | 24,650 | 49.10 | ||
Labour | Alistair Macdonald | 21,287 | 42.40 | ||
Liberal | Ron Coverson | 4,268 | 8.50 | ||
Majority | 3,363 | 6.70 | N/A | ||
Turnout | 50,205 | 75.43 | |||
Conservative gain from Labour | Swing |
Party | Candidate | Votes | % | ±% | |
---|---|---|---|---|---|
Labour | Alistair Macdonald | 22,757 | 45.09 | +3.85 | |
Conservative | Patricia Hornsby-Smith | 21,947 | 43.49 | −0.77 | |
Liberal | Paul Hayden | 5,761 | 11.42 | −3.08 | |
Majority | 810 | 1.60 | N/A | ||
Turnout | 50,465 | 84.26 | +1.40 | ||
Registered electors | 59,895 | ||||
Labour gain from Conservative | Swing | +2.31 |
Party | Candidate | Votes | % | ±% | |
---|---|---|---|---|---|
Conservative | Patricia Hornsby-Smith | 22,251 | 44.26 | −6.05 | |
Labour | Ronald W Huzzard | 20,736 | 41.24 | +3.98 | |
Liberal | Sheilagh M Hobday | 7,291 | 14.50 | +2.06 | |
Majority | 1,515 | 3.02 | −10.07 | ||
Turnout | 50,278 | 82.86 | −2.95 | ||
Registered electors | 60,678 | ||||
Conservative hold | Swing | -5.02 |
Party | Candidate | Votes | % | ±% | |
---|---|---|---|---|---|
Conservative | Patricia Hornsby-Smith | 25,748 | 50.31 | +0.56 | |
Labour | Margaret Reid | 19,069 | 37.26 | −4.63 | |
Liberal | David C Blackburn | 6,366 | 12.44 | +4.08 | |
Majority | 6,679 | 13.05 | +5.20 | ||
Turnout | 51,183 | 85.81 | +0.94 | ||
Registered electors | 59,646 | ||||
Conservative hold | Swing | +2.60 |
Party | Candidate | Votes | % | ±% | |
---|---|---|---|---|---|
Conservative | Patricia Hornsby-Smith | 24,514 | 49.75 | −1.04 | |
Labour | George Wallace | 20,644 | 41.89 | −7.32 | |
Liberal | David C Blackburn | 4,120 | 8.36 | N/A | |
Majority | 3,870 | 7.88 | +6.28 | ||
Turnout | 49,278 | 84.87 | −3.10 | ||
Registered electors | 58,063 | ||||
Conservative hold | Swing | +3.14 |
Party | Candidate | Votes | % | ±% | |
---|---|---|---|---|---|
Conservative | Patricia Hornsby-Smith | 31,679 | 50.79 | +6.00 | |
Labour | George Wallace | 30,699 | 49.21 | +4.72 | |
Majority | 980 | 1.58 | +1.28 | ||
Turnout | 62,378 | 87.97 | +1.66 | ||
Registered electors | 70,906 | ||||
Conservative hold | Swing | +0.64 |
Party | Candidate | Votes | % | ±% | |
---|---|---|---|---|---|
Conservative | Patricia Hornsby-Smith | 25,215 | 44.79 | +7.49 | |
Labour | George Wallace | 25,048 | 44.49 | −4.98 | |
Liberal | David A Hughes | 6,039 | 10.73 | −2.50 | |
Majority | 167 | 0.30 | N/A | ||
Turnout | 56,302 | 86.31 | +13.90 | ||
Registered electors | 65,231 | ||||
Conservative gain from Labour | Swing | +6.24 |
Party | Candidate | Votes | % | ±% | |
---|---|---|---|---|---|
Labour | George Wallace | 25,522 | 49.47 | +27.67 | |
Conservative | Nigel Fisher | 19,243 | 37.30 | −31.61 | |
Liberal | Ernest Charles Gendall Hawkins | 6,824 | 13.23 | +3.90 | |
Majority | 6,279 | 12.17 | N/A | ||
Turnout | 51,589 | 72.41 | +6.35 | ||
Registered electors | 71,246 | ||||
Labour gain from Conservative | Swing | +29.64 |
Party | Candidate | Votes | % | ±% | |
---|---|---|---|---|---|
Conservative | Waldron Smithers | 38,705 | 68.91 | −16.05 | |
Labour | Tom Colyer | 12,227 | 21.77 | +6.73 | |
Liberal | J. Alun Williams | 5,238 | 9.33 | New | |
Majority | 26,478 | 47.14 | −22.78 | ||
Turnout | 56,170 | 66.06 | −3.74 | ||
Registered electors | 85,024 | ||||
Conservative hold | Swing | -11.39 |
Party | Candidate | Votes | % | ±% | |
---|---|---|---|---|---|
Conservative | Waldron Smithers | 32,371 | 84.96 | +31.20 | |
Labour | Tom Colyer | 5,731 | 15.04 | −2.36 | |
Majority | 26,640 | 69.92 | +44.92 | ||
Turnout | 38,102 | 69.80 | +0.20 | ||
Registered electors | 54,589 | ||||
Conservative hold | Swing | +16.8 |
Party | Candidate | Votes | % | ±% | |
---|---|---|---|---|---|
Unionist | Waldron Smithers | 16,909 | 53.8 | −12.3 | |
Liberal | James Douglas Bateman | 9,025 | 28.8 | +12.1 | |
Labour | James Lamb Thomson | 5,445 | 17.4 | +0.2 | |
Majority | 7,884 | 25.0 | −23.9 | ||
Turnout | 31,379 | 69.6 | −3.1 | ||
Registered electors | 45,116 | ||||
Unionist hold | Swing | −12.2 |
Party | Candidate | Votes | % | ±% | |
---|---|---|---|---|---|
Unionist | Waldron Smithers | 14,440 | 66.1 | +10.6 | |
Labour | John Lamb Thomson | 3,757 | 17.2 | New | |
Liberal | Robert Charles Reginald Nevill | 3,647 | 16.7 | −27.8 | |
Majority | 10,683 | 48.9 | +37.9 | ||
Turnout | 21,844 | 72.7 | +12.2 | ||
Registered electors | 30,020 | ||||
Unionist hold | Swing | +19.2 |
Party | Candidate | Votes | % | ±% | |
---|---|---|---|---|---|
Unionist | Robert Chancellor Nesbitt | 9,725 | 55.5 | −9.9 | |
Liberal | Robert Charles Reginald Nevill | 7,806 | 44.5 | +9.9 | |
Majority | 1,919 | 11.0 | −19.8 | ||
Turnout | 17,531 | 60.5 | −3.2 | ||
Registered electors | 28,961 | ||||
Unionist hold | Swing | −9.9 |
Party | Candidate | Votes | % | ±% | |
---|---|---|---|---|---|
Unionist | Robert Chancellor Nesbitt | 11,801 | 65.4 | −11.4 | |
Liberal | David Marshall Mason | 6,256 | 34.6 | New | |
Majority | 5,545 | 30.8 | −22.8 | ||
Turnout | 18,057 | 63.7 | +23.3 | ||
Registered electors | 28,336 | ||||
Unionist hold | Swing |
Party | Candidate | Votes | % | ±% | |
---|---|---|---|---|---|
C | Unionist | Alfred Smithers | 8,314 | 76.8 | |
National | Alfred Edmunds | 2,507 | 23.2 | ||
Majority | 5,807 | 53.6 | |||
Turnout | 10,821 | 40.4 | |||
Unionist win (new seat) | |||||
Cindicates candidate endorsed by the coalition government. |
Bromley and Chislehurst was a constituency in Greater London represented in the House of Commons of the UK Parliament from 2006 until its abolition for the 2024 general election by Bob Neill, a Conservative.
Orpington is a constituency created in 1945 and represented in the House of Commons of the UK Parliament since 2019 by Gareth Bacon, a Conservative. It is the largest constituency in Greater London by area, covering the east and south of the London Borough of Bromley.
Dewsbury was a constituency created in 1868 and abolished in 2024.
Putney is a constituency in Greater London created in 1918 and represented in the House of Commons of the UK Parliament since 2019 by Fleur Anderson of the Labour Party.
Dartford is a constituency in Kent represented in the House of Commons of the UK Parliament by Jim Dickson of the Labour Party since 2024. It is the constituency that, in the entire UK, has longest been a bellwether: the party of the winning candidate has gone on to form the government at every UK general election since 1964. Candidates for the largest two parties nationally have polled first and second since 1923 in Dartford.
Gillingham was a constituency represented in the House of Commons of the Parliament of the United Kingdom. It elected one Member of Parliament (MP) by the first past the post system of election.
Edinburgh North was a burgh constituency of the House of Commons of the Parliament of the United Kingdom from 1918 to 1983. It elected one Member of Parliament (MP) using the first-past-the-post voting system.
Glasgow Pollok was a burgh constituency represented in the House of Commons of the Parliament of the United Kingdom from 1918 until 2005, when it was replaced by Glasgow South West. It elected one Member of Parliament (MP) using the first-past-the-post voting system.
Rutherglen is a burgh constituency represented in the House of Commons of the Parliament of the United Kingdom since 2024. It also existed between 1918 and 2005 and was largely replaced by Rutherglen and Hamilton West while a small portion became part of Glasgow Central and Glasgow South.
Kilmarnock was a county constituency of the House of Commons of the Parliament of the United Kingdom from 1918 to 1983. It elected one Member of Parliament (MP) by the first past the post system of election.
Newcastle upon Tyne West was a parliamentary constituency in the city of Newcastle upon Tyne from 1918 to 1983 which returned one Member of Parliament (MP) to the House of Commons of the Parliament of the United Kingdom.
Bedwellty was a county constituency in Monmouthshire which returned one Member of Parliament (MP) to the House of Commons of the Parliament of the United Kingdom from 1918 until it was abolished for the 1983 general election.
Worthing was a parliamentary constituency in West Sussex, centred on the town of Worthing in West Sussex. It returned one Member of Parliament (MP) to the House of Commons of the Parliament of the United Kingdom, elected by the first past the post system.
Cannock was a parliamentary constituency in Staffordshire which returned one Member of Parliament (MP) to the House of Commons of the Parliament of the United Kingdom from 1918 until it was abolished for the 1983 general election. It was effectively recreated in 1997 as the seat of Cannock Chase.
Pontypool was a county constituency in the town of Pontypool in Monmouthshire. It returned one Member of Parliament (MP) to the House of Commons of the Parliament of the United Kingdom, elected by the first past the post voting system.
Birmingham, Sparkbrook was a parliamentary constituency centred on the Sparkbrook area of Birmingham. It returned one Member of Parliament (MP) to the House of Commons of the Parliament of the United Kingdom, elected by the first past the post system.
Poplar was a parliamentary constituency centred on the Poplar district of the East End of London. It returned one Member of Parliament (MP) to the House of Commons of the Parliament of the United Kingdom.
Denbigh was a county constituency centred on the town of Denbigh in North Wales. It returned one Member of Parliament (MP) to the House of Commons of the Parliament of the United Kingdom, elected by the first-past-the-post voting system.
South East Essex was a parliamentary constituency in Essex in the East of England. It returned one Member of Parliament (MP) to the House of Commons of the Parliament of the United Kingdom.
Kirkcaldy Burghs was a burgh constituency of the House of Commons of the Parliament of the United Kingdom (Westminster) from 1832 to 1974. It elected one Member of Parliament (MP) by the first-past-the-post voting system. From 1832 to 1950 it was, officially, a district of burghs constituency.