This article does not cite any sources . (July 2016) (Learn how and when to remove this template message) |
| ||||||||||||||||||||||||||||||||||||||||||||||||||||||||||||||||
60 seats 31 seats needed for a majority | ||||||||||||||||||||||||||||||||||||||||||||||||||||||||||||||||
---|---|---|---|---|---|---|---|---|---|---|---|---|---|---|---|---|---|---|---|---|---|---|---|---|---|---|---|---|---|---|---|---|---|---|---|---|---|---|---|---|---|---|---|---|---|---|---|---|---|---|---|---|---|---|---|---|---|---|---|---|---|---|---|---|
|
Elections to Colchester Borough Council took place in 1983. They were held on the same day as the 1983 general election.
There were 20 councillors elected from the same number of wards.
Party | Candidate | Votes | % | ± | |
---|---|---|---|---|---|
Labour | T. Graves | 997 | 42.4 | -1.9 | |
Conservative | N. Knell | 735 | 31.2 | +2.3 | |
SDP–Liberal Alliance | H. Anderson | 569 | 26.4 | -0.4 | |
Majority | |||||
Turnout | |||||
Labour hold | Swing |
Party | Candidate | Votes | % | ± | |
---|---|---|---|---|---|
Conservative | T. Humphreys | 1,187 | 46.5 | +9.3 | |
Labour | K. Taylor | 804 | 31.5 | -6.8 | |
SDP–Liberal Alliance | D. Locke | 562 | 22.0 | -2.5 | |
Majority | |||||
Turnout | |||||
Conservative gain from Labour | Swing | ||||
Party | Candidate | Votes | % | ± | |
---|---|---|---|---|---|
Conservative | C. Dymond | 755 | 68.6 | -4.3 | |
SDP–Liberal Alliance | B. Trusler | 174 | 15.8 | N/A | |
Labour | B. Smith | 172 | 15.6 | -11.4 | |
Majority | |||||
Turnout | 50.4 | ||||
Conservative hold | Swing |
Party | Candidate | Votes | % | ± | |
---|---|---|---|---|---|
Conservative | D. Willey | 549 | 68.3 | -9.8 | |
SDP–Liberal Alliance | P. Hills | 184 | 22.9 | N/A | |
Labour | L. Shelley | 71 | 8.8 | -13.1 | |
Majority | |||||
Turnout | |||||
Conservative hold | Swing |
Party | Candidate | Votes | % | ± | |
---|---|---|---|---|---|
Conservative | R. Browning | 551 | 76.0 | -4.6 | |
Labour | R. Price | 89 | 12.3 | -7.1 | |
SDP–Liberal Alliance | M. Maxam | 85 | 11.7 | N/A | |
Majority | |||||
Turnout | 44.8 | ||||
Conservative hold | Swing |
Party | Candidate | Votes | % | ± | |
---|---|---|---|---|---|
SDP–Liberal Alliance | T. Brady | 959 | 37.6 | +7.2 | |
Labour | Jim Orpe | 946 | 37.1 | -5.5 | |
Conservative | S. Rae | 644 | 25.3 | -1.7 | |
Majority | |||||
Turnout | 46.2 | ||||
SDP–Liberal Alliance gain from Labour | Swing | ||||
Party | Candidate | Votes | % | ± | |
---|---|---|---|---|---|
SDP–Liberal Alliance | Ian Trusler | 1,427 | 54.0 | +15.6 | |
Conservative | T. Wilson | 1,114 | 42.2 | -13.1 | |
Labour | G. Rose | 101 | 3.8 | -1.2 | |
Majority | |||||
Turnout | 64.3 | ||||
SDP–Liberal Alliance gain from Conservative | Swing | ||||
Party | Candidate | Votes | % | ± | |
---|---|---|---|---|---|
Conservative | D. Fulford | 1,055 | 58.3 | +7.3 | |
Labour | M. Bryan | 431 | 23.8 | -7.2 | |
SDP–Liberal Alliance | R. Baker | 323 | 17.9 | -0.1 | |
Majority | |||||
Turnout | 75.8 | ||||
Conservative hold | Swing |
Party | Candidate | Votes | % | ± | |
---|---|---|---|---|---|
SDP–Liberal Alliance | J. Coleman | 1,110 | 49.1 | -3.4 | |
Labour | D. Williams | 629 | 27.8 | +0.1 | |
Conservative | J. Clarke | 520 | 23.0 | +3.2 | |
Majority | |||||
Turnout | 48.2 | ||||
SDP–Liberal Alliance gain from Labour | Swing | ||||
Party | Candidate | Votes | % | ± | |
---|---|---|---|---|---|
Conservative | J. Howgego | 1,248 | 45.3 | -0.7 | |
SDP–Liberal Alliance | Martin Hunt | 1,176 | 42.7 | +5.5 | |
Labour | P. Kent | 329 | 12.0 | -4.8 | |
Majority | |||||
Turnout | |||||
Conservative hold | Swing |
Party | Candidate | Votes | % | ± | |
---|---|---|---|---|---|
Conservative | A. Parsonson | 548 | 66.3 | -9.6 | |
SDP–Liberal Alliance | A. Stevens | 185 | 22.4 | N/A | |
Labour | H. Bryan | 94 | 11.4 | -12.7 | |
Majority | |||||
Turnout | |||||
Conservative hold | Swing |
Party | Candidate | Votes | % | ± | |
---|---|---|---|---|---|
Labour | F. Wilkin | 887 | 37.6 | +0.4 | |
SDP–Liberal Alliance | S. Cawley | 883 | 37.4 | -3.3 | |
Conservative | I. Foster | 590 | 25.0 | +2.9 | |
Majority | |||||
Turnout | 38.3 | ||||
Labour hold | Swing |
Party | Candidate | Votes | % | ± | |
---|---|---|---|---|---|
Labour | R. Crookes | 1,385 | 56.6 | +2.1 | |
Conservative | N. Elcombe | 653 | 26.7 | +4.4 | |
SDP–Liberal Alliance | P. Brady | 408 | 16.7 | -6.4 | |
Majority | |||||
Turnout | |||||
Labour hold | Swing |
Party | Candidate | Votes | % | ± | |
---|---|---|---|---|---|
Conservative | R. Pawsey | 1,063 | 45.2 | +9.5 | |
Labour | A. Rawal | 895 | 38.0 | -1.9 | |
SDP–Liberal Alliance | M. Bayliss | 396 | 16.8 | -8.1 | |
Majority | |||||
Turnout | 49.8 | ||||
Conservative gain from Labour | Swing | ||||
Party | Candidate | Votes | % | ± | |
---|---|---|---|---|---|
Conservative | B. West | 1,148 | 61.4 | +0.9 | |
SDP–Liberal Alliance | A. Hayman | 471 | 25.2 | +2.1 | |
Labour | F. Rogers | 251 | 13.4 | -3.0 | |
Majority | |||||
Turnout | 50.9 | ||||
Conservative hold | Swing |
Party | Candidate | Votes | % | ± | |
---|---|---|---|---|---|
Conservative | P. Spendlove | 1,431 | 61.5 | +4.4 | |
SDP–Liberal Alliance | C. Curtis | 526 | 22.6 | -5.9 | |
Labour | J. Pearsall | 369 | 15.9 | +1.5 | |
Majority | |||||
Turnout | 46.2 | ||||
Conservative hold | Swing |
Party | Candidate | Votes | % | ± | |
---|---|---|---|---|---|
Conservative | P. Holloway | 1,129 | 61.7 | +12.4 | |
SDP–Liberal Alliance | W. Sandford | 382 | 20.9 | -10.5 | |
Labour | R. Lister | 318 | 17.4 | -1.9 | |
Majority | |||||
Turnout | 43.6 | ||||
Conservative hold | Swing |
Party | Candidate | Votes | % | ± | |
---|---|---|---|---|---|
Tiptree Residents | J. Webb | 1,170 | 53.8 | +9.6 | |
Conservative | J. Crowe | 748 | 34.4 | -0.3 | |
Labour | S. Simmonds | 258 | 11.9 | -9.2 | |
Majority | |||||
Turnout | 33.7 | ||||
Tiptree Residents hold | Swing |
Party | Candidate | Votes | % | ± | |
---|---|---|---|---|---|
Conservative | J. Williams | 1,357 | 71.0 | +7.8 | |
SDP–Liberal Alliance | B. Packard | 429 | 22.5 | -8.9 | |
Labour | J. Kent | 124 | 6.5 | +1.3 | |
Majority | |||||
Turnout | |||||
Conservative hold | Swing |
Party | Candidate | Votes | % | ± | |
---|---|---|---|---|---|
Conservative | M. Last | 1,474 | 54.5 | +11.6 | |
Labour | J. Baylis | 1,231 | 45.5 | -8.8 | |
Majority | |||||
Turnout | 45.0 | ||||
Conservative hold | Swing |
Monmouth is a county constituency of the House of Commons of the Parliament of the United Kingdom. It elects one Member of Parliament (MP) by the first past the post of election. The constituency was created for the 1918 general election. Since 2005 the MP has been David Davies of the Conservative Party.
Aberdeen South is a burgh constituency of the House of Commons of the Parliament of the United Kingdom and it elects one Member of Parliament (MP) by the first past the post system of election. The current MP is Ross Thomson of the Conservative Party.
Motherwell and Wishaw is a burgh constituency of the House of Commons of the Parliament of the United Kingdom. It was formed in 1974, mostly from Motherwell. It was divided in 1983 into Motherwell North and Motherwell South constituencies, but these were merged in 1997 to recreate the old Motherwell and Wishaw constituency.
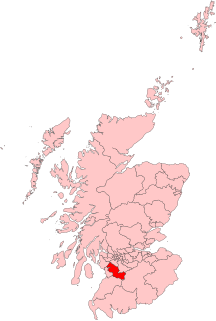
Kilmarnock and Loudoun is a county constituency of the House of Commons of the Parliament of the United Kingdom. It elects one Member of Parliament (MP), using the first-past-the-post voting system.
Federal elections were held in Australia on 1 December 1984. All 148 seats in the House of Representatives and 46 of 76 seats in the Senate were up for election. The incumbent Labor Party led by Prime Minister Bob Hawke defeated the opposition Liberal–National coalition, led by Andrew Peacock.
Mid Ulster is a constituency in the Northern Ireland Assembly.
The Leader of the Labour Party is the most senior political figure within the Labour Party in the United Kingdom. Since 12 September 2015, the office has been held by Jeremy Corbyn; who has represented the constituency of Islington North since 1983.
Elections to Trafford Council were held on Thursday, 3 May 1979, on the same day as the 1979 UK General Election. One third of the council was up for election, with each successful candidate to serve a four-year term of office, expiring in 1983. The Conservative Party retained overall control of the council.
The fifth full elections for Guildford Borough Council took place on 1 May 1987. The Conservatives retained control of the council winning 30 of the 45 seats on the council. This represented one net loss for the Conservatives, relative to the 1983 council elections. Labour retained its 6 councillors. The SDP-Liberal Alliance won 9 seats, a net gain of two seats on the 1983 council elections. No independents were elected to the council, one had been elected in 1983.
An election to Carmarthen District Council were held in May 1983. It was preceded by the 1979 election and followed by the 1987 election. On the same day there were elections to the other local authorities and community councils in Wales.
An election to Dinefwr Borough Council was held in May 1983. It was preceded by the 1979 election and followed by the 1987 election. On the same day there were elections to the other local authorities and community councils in Wales.
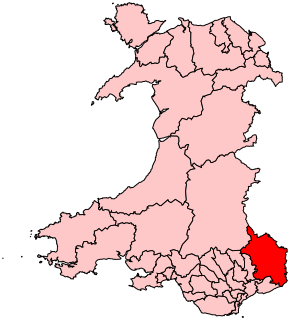
An election to Llanelli Borough Council was held in May 1983. It was preceded by the 1979 election and followed by the 1987 election. On the same day there were elections to the other local authorities and community councils in Wales.
An election to Llanelli Borough Council was held in May 1987. It was preceded by the 1983 election and followed by the 1991 election. On the same day there were elections to the other local authorities and community councils in Wales.
A deputy leadership election for the Labour Party in the United Kingdom took place on 2 October 1983 to replace incumbent Deputy Leader Denis Healey. Healey had served in the position since 1980, becoming deputy leader at the same time that Michael Foot became party leader. Foot and Healey had both announced their resignations after the general election on 9 June 1983, in which a disastrous performance left the Labour Party with just 209 seats in parliament.
An election to Preseli District Council was held in May 1983. It was preceded by the 1979 election and followed by the 1987 election. On the same day there were elections to the other local authorities and community councils in Wales.
An election to South Pembrokeshire District Council were held in May 1983. An Independent majority was maintained.. It was preceded by the 1979 election and followed by the 1987 election. On the same day there were elections to the other local authorities and community councils in Wales.
An election to Ceredigion District Council was held in May 1983. It was preceded by the 1979 election and followed by the 1987 election. On the same day there were elections to the other local authorities and community councils in Wales.
An election to South Pembrokeshire District Council was held in May 1987. An Independent majority was maintained. It was preceded by the 1983 election and followed by the 1991 election. On the same day there were elections to the other local authorities and community councils in Wales.
An election to Ceredigion District Council was held in May 1987. It was preceded by the 1983 election and followed by the 1991 election. On the same day there were elections to the other local authorities and community councils in Wales.