Coventry | |
---|---|
Former Borough constituency for the House of Commons | |
County | Warwickshire |
Major settlements | Coventry |
1298–1945 | |
Seats | 1298–1885: Two 1885–1945: One |
Replaced by | Coventry East Coventry West |
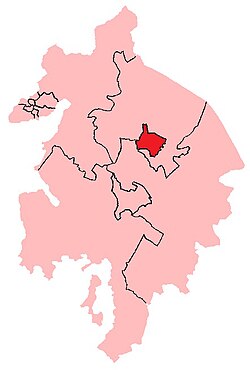
Coventry was a borough constituency which was represented in the House of Commons of England and its successors, the House of Commons of Great Britain and the House of Commons of the United Kingdom.
Centred on the City of Coventry in Warwickshire, it returned two Members of Parliament (MPs) from 1295 until the Redistribution of Seats Act 1885, when its representation was reduced to one. The Coventry constituency was abolished for the 1945 general election, when it was split into two new constituencies: Coventry East and Coventry West.
Elections were held using the bloc vote system when electing two MPs (until 1885), and then first-past-the-post to elect one MP thereafter.
1832–1868: The City of Coventry and the suburbs thereof. [1]
1868–1918: The existing parliamentary borough and the Parish of Stoke. [2]
The constituency was unchanged by the Representation of the People Act 1884. [3] By the time its boundaries were revised in 1918, it was defined as consisting of the city of Coventry, the parishes of St. Michael Without and Holy Trinity Without, the parish of Stoke, and part of the parish of Wyken. [4]
1918–1945: The county borough of Coventry. [5]
In the eighteenth century Coventry was, despite its size, known as a corrupt borough. [6]
Party | Candidate | Votes | % | ±% | |
---|---|---|---|---|---|
Tory | Thomas Bilcliffe Fyler | Unopposed | |||
Whig | Edward Ellice | Unopposed | |||
Tory hold | |||||
Whig gain from Tory |
Party | Candidate | Votes | % | ±% | |
---|---|---|---|---|---|
Whig | Edward Ellice | 1,658 | 38.0 | N/A | |
Whig | Henry Bulwer | 1,560 | 35.7 | N/A | |
Tory | Thomas Bilcliffe Fyler | 1,150 | 26.3 | N/A | |
Majority | 410 | 9.4 | N/A | ||
Turnout | 2,721 | c. 77.7 | N/A | ||
Registered electors | c. 3,500 | ||||
Whig hold | Swing | N/A | |||
Whig gain from Tory | Swing | N/A | |||
Party | Candidate | Votes | % | ±% | |
---|---|---|---|---|---|
Whig | Edward Ellice | 1,613 | 40.8 | +2.8 | |
Whig | Henry Bulwer | 1,607 | 40.6 | +4.9 | |
Tory | Thomas Bilcliffe Fyler | 371 | 9.4 | −3.8 | |
Tory | Morgan Thomas | 366 | 9.2 | −4.0 | |
Majority | 1,236 | 31.2 | +21.8 | ||
Turnout | 1,989 | 60.5 | c. −17.2 | ||
Registered electors | 3,285 | ||||
Whig hold | Swing | +3.4 | |||
Whig hold | Swing | +4.4 | |||
Ellice was appointed Secretary at War, requiring a by-election.
Party | Candidate | Votes | % | ±% | |
---|---|---|---|---|---|
Whig | Edward Ellice | 1,502 | 53.7 | −27.7 | |
Tory | Morgan Thomas | 1,208 | 43.2 | +24.6 | |
Radical | John Morgan Cobbett | 89 | 3.2 | N/A | |
Majority | 294 | 10.5 | −20.7 | ||
Turnout | 2,799 | 85.2 | +24.7 | ||
Registered electors | 3,285 | ||||
Whig hold | Swing | −26.2 | |||
Party | Candidate | Votes | % | ±% | |
---|---|---|---|---|---|
Radical | William Williams | 1,865 | 37.1 | N/A | |
Whig | Edward Ellice | 1,601 | 31.8 | −49.6 | |
Conservative | Morgan Thomas | 1,566 | 31.1 | +12.5 | |
Turnout | 3,206 | 89.6 | +29.1 | ||
Registered electors | 3,577 | ||||
Majority | 264 | 5.3 | N/A | ||
Radical gain from Whig | Swing | ||||
Majority | 35 | 0.7 | −30.5 | ||
Whig hold | Swing | −31.1 | |||
Party | Candidate | Votes | % | ±% | |
---|---|---|---|---|---|
Whig | Edward Ellice | 1,778 | 27.5 | −4.3 | |
Radical | William Williams | 1,748 | 27.0 | −10.1 | |
Conservative | Morgan Thomas | 1,511 | 23.3 | +7.8 | |
Conservative | John David Hay Hill [30] | 1,392 | 21.5 | +6.0 | |
Chartist | John Bell | 43 | 0.7 | New | |
Turnout | 3,323 | 90.7 | +1.1 | ||
Registered electors | 3,577 | ||||
Majority | 30 | 0.5 | −0.2 | ||
Whig hold | Swing | −5.6 | |||
Majority | 237 | 3.7 | −1.6 | ||
Radical hold | Swing | −8.5 | |||
Party | Candidate | Votes | % | ±% | |
---|---|---|---|---|---|
Radical | William Williams | 1,870 | 37.5 | +10.5 | |
Whig | Edward Ellice | 1,829 | 36.7 | +9.2 | |
Conservative | Thomas Weir | 1,290 | 25.9 | −18.9 | |
Turnout | c. 3,140 | c. 82.9 | c. −7.8 | ||
Registered electors | 3,789 | ||||
Majority | 41 | 0.8 | −2.9 | ||
Radical hold | Swing | +10.0 | |||
Majority | 539 | 10.8 | +10.3 | ||
Whig hold | Swing | +9.3 | |||
Party | Candidate | Votes | % | ±% | |
---|---|---|---|---|---|
Whig | Edward Ellice | 2,901 | 46.1 | +9.4 | |
Conservative | George James Turner | 1,754 | 27.9 | +2.0 | |
Radical | William Williams | 1,633 | 26.0 | −11.5 | |
Turnout | 3,144 (est) | 77.8 (est) | −5.1 | ||
Registered electors | 4,043 | ||||
Majority | 1,147 | 18.2 | +7.4 | ||
Whig hold | Swing | +5.2 | |||
Majority | 121 | 1.9 | N/A | ||
Conservative gain from Radical | Swing | +3.9 | |||
Turner resigned after being appointed Vice-Chancellor of the High Court, causing a by-election.
Party | Candidate | Votes | % | ±% | |
---|---|---|---|---|---|
Radical | Charles Geach | 1,669 | 60.2 | +34.2 | |
Whig | Edward Strutt [24] | 1,104 | 39.8 | −6.3 | |
Majority | 565 | 20.4 | N/A | ||
Turnout | 2,773 | 65.7 | −12.1 | ||
Registered electors | 4,223 | ||||
Radical gain from Conservative | Swing | +20.3 | |||
Party | Candidate | Votes | % | ±% | |
---|---|---|---|---|---|
Radical | Charles Geach | Unopposed | |||
Whig | Edward Ellice | Unopposed | |||
Registered electors | 4,502 | ||||
Radical gain from Conservative | |||||
Whig hold | |||||
Geach's death caused a by-election.
Party | Candidate | Votes | % | ±% | |
---|---|---|---|---|---|
Whig | Joseph Paxton | Unopposed | |||
Whig gain from Radical |
Party | Candidate | Votes | % | ±% | |
---|---|---|---|---|---|
Whig | Edward Ellice | 2,810 | 41.0 | N/A | |
Whig | Joseph Paxton | 2,384 | 34.8 | N/A | |
Whig | John Mellor [31] [32] | 703 | 10.3 | N/A | |
Conservative | Morgan Treherne | 599 | 8.7 | New | |
Peelite | Robert Phillimore [33] [34] | 356 | 5.2 | New | |
Majority | 1,681 | 24.5 | N/A | ||
Turnout | 3,426 (est) | 68.8 (est) | N/A | ||
Registered electors | 4,982 | ||||
Whig hold | |||||
Whig gain from Radical |
Party | Candidate | Votes | % | ±% | |
---|---|---|---|---|---|
Liberal | Edward Ellice | 3,107 | 41.7 | +0.7 | |
Liberal | Joseph Paxton | 2,409 | 32.4 | −2.4 | |
Conservative | Morgan Treherne | 1,928 | 25.9 | +17.2 | |
Majority | 481 | 6.5 | −18.0 | ||
Turnout | 4,686 (est) | 87.4 (est) | +18.6 | ||
Registered electors | 5,363 | ||||
Liberal hold | Swing | −4.0 | |||
Liberal hold | Swing | −5.5 | |||
Ellice's death caused a by-election.
Party | Candidate | Votes | % | ±% | |
---|---|---|---|---|---|
Conservative | Morgan Treherne | 2,263 | 51.5 | +25.6 | |
Liberal | Arthur Peel [36] | 2,129 | 48.5 | −25.6 | |
Majority | 134 | 3.0 | N/A | ||
Turnout | 4,392 | 84.4 | −3.0 | ||
Registered electors | 5,206 | ||||
Conservative gain from Liberal | Swing | +25.6 | |||
Paxton's death caused a by-election.
Party | Candidate | Votes | % | ±% | |
---|---|---|---|---|---|
Conservative | Henry Eaton | 2,395 | 52.8 | +26.9 | |
Liberal | Thomas Mason Jones [37] | 2,142 | 47.2 | −26.9 | |
Majority | 253 | 5.6 | N/A | ||
Turnout | 4,537 | 91.3 | +3.9 | ||
Registered electors | 4,967 | ||||
Conservative gain from Liberal | Swing | +26.9 | |||
Party | Candidate | Votes | % | ±% | |
---|---|---|---|---|---|
Conservative | Henry Eaton | 2,489 | 26.2 | +13.2 | |
Conservative | Morgan Treherne | 2,401 | 25.3 | +12.3 | |
Liberal | Edward Fordham Flower | 2,342 | 24.7 | −17.0 | |
Liberal | Thomas Mason Jones [37] | 2,259 | 23.8 | −8.6 | |
Majority | 59 | 0.6 | N/A | ||
Turnout | 4,746 (est) | 95.5 (est) | +8.1 | ||
Registered electors | 4,967 | ||||
Conservative gain from Liberal | Swing | +13.0 | |||
Conservative gain from Liberal | Swing | +12.6 | |||
Treherne's death caused a by-election.
Party | Candidate | Votes | % | ±% | |
---|---|---|---|---|---|
Liberal | Henry Jackson | 2,429 | 53.4 | +4.9 | |
Conservative | William Ferrand | 2,123 | 46.6 | −4.9 | |
Majority | 306 | 6.8 | N/A | ||
Turnout | 4,552 | 91.6 | −3.9 | ||
Registered electors | 4,967 | ||||
Liberal gain from Conservative | Swing | +4.9 | |||
The by-election was declared void on petition due to bribery by Jackson's agent. [38]
Party | Candidate | Votes | % | ±% | |
---|---|---|---|---|---|
Liberal | Samuel Carter | 2,415 | 53.1 | +4.6 | |
Conservative | Alexander Staveley Hill | 2,134 | 46.9 | −4.6 | |
Majority | 281 | 6.2 | N/A | ||
Turnout | 4,549 | 91.6 | −3.9 | ||
Registered electors | 4,967 | ||||
Liberal gain from Conservative | Swing | +4.6 | |||
Party | Candidate | Votes | % | ±% | |
---|---|---|---|---|---|
Conservative | Henry Eaton | 3,781 | 25.7 | −0.5 | |
Conservative | Alexander Staveley Hill | 3,761 | 25.6 | +0.3 | |
Liberal | Henry Jackson | 3,594 | 24.4 | −0.3 | |
Liberal | Samuel Carter | 3,576 | 24.3 | +0.5 | |
Majority | 167 | 1.2 | +0.6 | ||
Turnout | 7,356 (est) | 92.8 (est) | −2.7 | ||
Registered electors | 7,925 | ||||
Conservative hold | Swing | −0.4 | |||
Conservative hold | Swing | +0.4 | |||
Party | Candidate | Votes | % | ±% | |
---|---|---|---|---|---|
Conservative | Henry Eaton | 3,823 | 25.6 | −0.1 | |
Liberal | Henry Jackson | 3,799 | 25.5 | +1.1 | |
Liberal | Samuel Carter | 3,662 | 24.6 | +0.3 | |
Conservative | Frederick du Pré Thornton [39] | 3,628 | 24.3 | −1.3 | |
Turnout | 7,456 (est) | 92.9 (est) | +0.1 | ||
Registered electors | 8,027 | ||||
Majority | 24 | 0.9 | −1.3 | ||
Conservative hold | Swing | −0.2 | |||
Majority | 171 | 1.2 | N/A | ||
Liberal gain from Conservative | Swing | +1.2 | |||
Party | Candidate | Votes | % | ±% | |
---|---|---|---|---|---|
Liberal | Henry Jackson | 4,184 | 26.1 | +0.6 | |
Liberal | William Wills | 4,105 | 25.6 | +1.0 | |
Conservative | Henry Eaton | 4,008 | 25.0 | −0.6 | |
Conservative | Arthur Kekewich | 3,715 | 23.2 | −1.1 | |
Majority | 97 | 0.6 | N/A | ||
Turnout | 8,006 (est) | 86.9 (est) | −6.0 | ||
Registered electors | 9,208 | ||||
Liberal hold | Swing | +0.6 | |||
Liberal gain from Conservative | Swing | +1.1 | |||
Jackson resigned after being appointed a judge on the Queen's Bench Division of the High Court of Justice, causing a by-election.
Party | Candidate | Votes | % | ±% | |
---|---|---|---|---|---|
Conservative | Henry Eaton | 4,011 | 52.9 | +4.7 | |
Liberal | Ughtred Kay-Shuttleworth | 3,568 | 47.1 | −4.6 | |
Majority | 443 | 0.8 | N/A | ||
Turnout | 7,579 | 91.7 | +4.8 (est) | ||
Registered electors | 8,263 | ||||
Conservative gain from Liberal | Swing | +4.6 | |||
Party | Candidate | Votes | % | ±% | |
---|---|---|---|---|---|
Conservative | Henry Eaton | 4,577 | 51.4 | +3.2 | |
Liberal | Courtenay Warner | 4,328 | 48.6 | −3.1 | |
Majority | 249 | 2.8 | N/A | ||
Turnout | 8,905 | 91.5 | +4.6 (est) | ||
Registered electors | 9,736 | ||||
Conservative win |
Party | Candidate | Votes | % | ±% | |
---|---|---|---|---|---|
Conservative | Henry Eaton | 4,201 | 52.5 | +1.1 | |
Liberal | William Ballantine | 3,796 | 47.5 | -1.1 | |
Majority | 405 | 5.0 | +2.2 | ||
Turnout | 7,996 | 82.1 | -9.4 | ||
Registered electors | 9,736 | ||||
Conservative hold | Swing | +1.1 | |||
Eaton was elevated to the peerage, becoming Lord Cheylesmore, causing a by-election.
Party | Candidate | Votes | % | ±% | |
---|---|---|---|---|---|
Liberal | William Ballantine | 4,229 | 50.1 | +2.6 | |
Conservative | Herbert Eaton | 4,213 | 49.9 | -2.6 | |
Majority | 16 | 0.2 | N/A | ||
Turnout | 8,442 | 85.6 | +3.5 | ||
Registered electors | 9,867 | ||||
Liberal gain from Conservative | Swing | +2.6 | |||
Party | Candidate | Votes | % | ±% | |
---|---|---|---|---|---|
Liberal | William Ballantine | 4,754 | 50.8 | +3.3 | |
Conservative | Charles James Murray | 4,611 | 49.2 | −3.3 | |
Majority | 143 | 1.6 | N/A | ||
Turnout | 9,365 | 86.4 | +4.3 | ||
Registered electors | 10,838 | ||||
Liberal gain from Conservative | Swing | +3.3 | |||
Party | Candidate | Votes | % | ±% | |
---|---|---|---|---|---|
Conservative | Charles James Murray | 4,974 | 51.8 | +2.6 | |
Liberal | William Ballantine | 4,624 | 48.2 | -2.6 | |
Majority | 350 | 3.6 | N/A | ||
Turnout | 9,598 | 87.8 | +1.4 | ||
Registered electors | 10,926 | ||||
Conservative gain from Liberal | Swing | +2.6 | |||
Party | Candidate | Votes | % | ±% | |
---|---|---|---|---|---|
Conservative | Charles James Murray | 5,257 | 55.7 | +3.9 | |
Liberal | L Cowen | 4,188 | 44.3 | -3.9 | |
Majority | 1,069 | 11.4 | +7.8 | ||
Turnout | 9,445 | 77.8 | -10.0 | ||
Registered electors | 12,145 | ||||
Conservative hold | Swing | +3.9 | |||
Party | Candidate | Votes | % | ±% | |
---|---|---|---|---|---|
Liberal | A. E. W. Mason | 6,554 | 54.5 | +10.2 | |
Conservative | Kenneth Foster | 5,462 | 45.5 | -10.2 | |
Majority | 1,092 | 9.0 | N/A | ||
Turnout | 12,016 | 86.0 | +8.2 | ||
Registered electors | 13,965 | ||||
Liberal gain from Conservative | Swing | +10.2 | |||
Party | Candidate | Votes | % | ±% | |
---|---|---|---|---|---|
Conservative | Kenneth Foster | 7,369 | 50.7 | +5.2 | |
Liberal | Silas Hocking | 7,153 | 49.3 | -5.2 | |
Majority | 216 | 1.4 | N/A | ||
Turnout | 14,522 | 88.2 | +2.2 | ||
Conservative gain from Liberal | Swing | +5.2 | |||
Party | Candidate | Votes | % | ±% | |
---|---|---|---|---|---|
Liberal | David Marshall Mason | 7,351 | 51.8 | +2.5 | |
Conservative | Kenneth Foster | 6,828 | 48.2 | -2.5 | |
Majority | 523 | 3.6 | N/A | ||
Turnout | 14,179 | 86.1 | -2.1 | ||
Liberal gain from Conservative | Swing | +2.5 | |||
Party | Candidate | Votes | % | ±% | |
---|---|---|---|---|---|
C | Unionist | Edward Manville | 17,380 | 44.8 | -3.4 |
Labour | R. C. Wallhead | 10,298 | 26.6 | New | |
Liberal | Courtenay Mansel | 4,128 | 10.7 | -41.1 | |
Independent | Arthur Charles Bannington | 3,806 | 9.8 | New | |
Independent Liberal | David Marshall Mason | 3,145 | 8.1 | New | |
Majority | 7,082 | 18.2 | N/A | ||
Turnout | 38,757 | 62.4 | -23.7 | ||
Unionist gain from Liberal | Swing | ||||
Cindicates candidate endorsed by the coalition government. |
Mason had opposed the war and was replaced as Liberal candidate by Mansel who supported the Coalition Government. Bannington was the candidate of the National Federation of Discharged and Demobilized Sailors and Soldiers. [43]
Party | Candidate | Votes | % | ±% | |
---|---|---|---|---|---|
Unionist | Edward Manville | 20,986 | 42.6 | -2.2 | |
Labour | Robert Williams | 16,289 | 33.1 | +6.5 | |
Liberal | John Edward Darnton | 11,985 | 24.3 | +13.6 | |
Majority | 4,697 | 9.5 | -8.7 | ||
Turnout | 49,260 | 80.8 | +18.4 | ||
Unionist hold | Swing | -4.3 | |||
Party | Candidate | Votes | % | ±% | |
---|---|---|---|---|---|
Labour | A. A. Purcell | 16,346 | 34.2 | +1.1 | |
Unionist | Edward Manville | 15,726 | 32.9 | -9.7 | |
Liberal | Henry Paterson Gisborne | 15,716 | 32.9 | +8.6 | |
Majority | 620 | 1.3 | N/A | ||
Turnout | 47,788 | 77.1 | -3.7 | ||
Labour gain from Unionist | Swing | +5.4 | |||
Party | Candidate | Votes | % | ±% | |
---|---|---|---|---|---|
Unionist | Archibald Boyd-Carpenter | 22,712 | 42.4 | +9.5 | |
Labour | A. A. Purcell | 17,888 | 33.4 | -0.8 | |
Liberal | Henry Paterson Gisborne | 12,953 | 24.2 | -8.7 | |
Majority | 620 | 9.0 | N/A | ||
Turnout | 53,553 | 84.9 | +7.8 | ||
Unionist gain from Labour | Swing | +5.4 | |||
Party | Candidate | Votes | % | ±% | |
---|---|---|---|---|---|
Labour | Philip Noel-Baker | 34,255 | 49.4 | +16.0 | |
Unionist | Archibald Boyd-Carpenter | 22,536 | 32.5 | -9.9 | |
Liberal | James Wiseman McKay | 12,516 | 18.1 | -6.1 | |
Majority | 11,719 | 16.9 | N/A | ||
Turnout | 69,307 | 82.2 | -2.7 | ||
Labour gain from Unionist | Swing | +13.0 | |||
Party | Candidate | Votes | % | ±% | |
---|---|---|---|---|---|
Conservative | William Strickland | 44,305 | 61.0 | +28.5 | |
Labour | Philip Noel-Baker | 28,311 | 39.0 | -10.4 | |
Majority | 15,994 | 22.0 | N/A | ||
Turnout | 72,616 | 82.7 | +0.5 | ||
Conservative gain from Labour | Swing | +23.4 | |||
Party | Candidate | Votes | % | ±% | |
---|---|---|---|---|---|
Conservative | William Strickland | 37,313 | 51.7 | -9.3 | |
Labour | Philip Noel-Baker | 34,841 | 48.3 | +9.3 | |
Majority | 2,472 | 3.4 | -18.6 | ||
Turnout | 72,154 | 81.0 | -1.7 | ||
Conservative hold | Swing | -9.3 | |||
{{cite book}}
: CS1 maint: location missing publisher (link){{cite news}}
: Missing or empty |title=
(help)Great Yarmouth is a constituency represented in the House of Commons of the Parliament of the United Kingdom since the 2010 general election by Sir Brandon Lewis, a Conservative.
Stockport is a constituency represented in the House of Commons of the UK Parliament since 2019 by Navendu Mishra of the Labour Party.
Warwick was a parliamentary borough consisting of the town of Warwick, within the larger Warwickshire constituency of England. It returned two Members of Parliament (MPs) to the House of Commons of England from 1295 to 1707, to the House of Commons of Great Britain from 1707 to 1800, and then to the House of Commons of the Parliament of the United Kingdom until 1885.
Lancaster was a constituency of the House of Commons of the Parliament of England then of the Parliament of Great Britain from 1707 to 1800 and of the Parliament of the United Kingdom from 1801 to 1867, centred on the historic city of Lancaster in north-west England. It was represented by two Members of Parliament until the constituency was disenfranchised for corruption in 1867.
Falkirk Burghs was a district of burghs constituency of the House of Commons of the Parliament of the United Kingdom from 1832 to 1918. The constituency comprised the burghs of Falkirk, Airdrie, Hamilton, Lanark and Linlithgow, lying in Stirlingshire, Lanarkshire and Linlithgowshire.
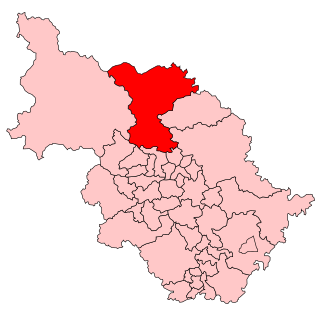
Ripon was a constituency sending members to the House of Commons of England, Great Britain and the House of Commons of the Parliament of the United Kingdom until 1983, centred on the city of Ripon in North Yorkshire.
Frome was a constituency centred on the town of Frome in Somerset. It returned one Member of Parliament (MP) to the House of Commons of the Parliament of the United Kingdom from 1832, until it was abolished for the 1950 general election. Between 1832 and 1885, it was a parliamentary borough; after 1885 it was a county constituency, a division of Somerset.
Northampton was a parliamentary constituency, which existed until 1974.
Hythe was a constituency centred on the town of Hythe in Kent. It returned two Members of Parliament to the House of Commons until 1832, when its representation was reduced to one member. The constituency was abolished for the 1950 general election, and replaced with the new Folkestone and Hythe constituency.
Clitheroe was a parliamentary constituency in Lancashire.
Tavistock was the name of a parliamentary constituency in Devon between 1330 and 1974. Until 1885 it was a parliamentary borough, consisting solely of the town of Tavistock; it returned two Members of Parliament to the House of Commons of the Parliament of the United Kingdom until 1868, when its representation was reduced to one member. From 1885, the name was transferred to a single-member county constituency covering a much larger area.
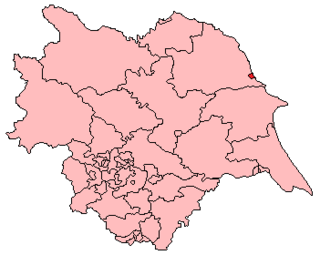
Scarborough was the name of a constituency in Yorkshire, electing Members of Parliament to the House of Commons, at two periods. From 1295 until 1918 it was a parliamentary borough consisting only of the town of Scarborough, electing two MPs until 1885 and one from 1885 until 1918. In 1974 the name was revived for a county constituency, covering a much wider area; this constituency was abolished in 1997.
Oldham was a parliamentary constituency centred on the town of Oldham, England. It returned two Members of Parliament (MPs) to the House of Commons of the Parliament of the United Kingdom. The constituency was created by the Great Reform Act of 1832 and was abolished for the 1950 general election when it was split into the Oldham East and Oldham West constituencies.
North Northamptonshire was a county constituency in Northamptonshire, represented in the House of Commons of the Parliament of the United Kingdom.
Southampton was a parliamentary constituency which was represented in the British House of Commons. Centred on the town of Southampton, it returned two members of parliament (MPs) from 1295 until it was abolished for the 1950 general election.
Cricklade was a parliamentary constituency named after the town of Cricklade in Wiltshire.
Dudley was a parliamentary constituency centred on the town of Dudley in Worcestershire which existed between 1832 and 1974. It returned one Member of Parliament (MP) to the House of Commons of the Parliament of the United Kingdom, elected by the first past the post system.
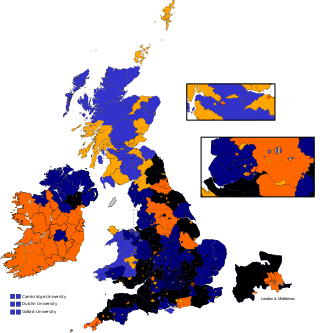
East Kent was a county constituency in Kent in South East England. It returned two Members of Parliament (MPs) to the House of Commons of the Parliament of the United Kingdom, elected by the first past the post system.
Newcastle-upon-Tyne was a parliamentary borough in the county of Northumberland of the House of Commons of England from 1283 to 1706, then of the House of Commons of Great Britain from 1707 to 1800 and of the House of Commons of the United Kingdom from 1801 to 1918. It returned two Members of Parliament (MPs), elected by the bloc vote system.
Leicester was a parliamentary borough in Leicestershire, which elected two members of parliament (MPs) to the House of Commons from 1295 until 1918, when it was split into three single-member divisions.