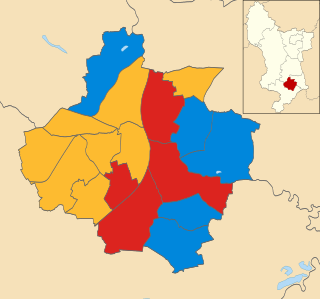
The 2003 Derby City Council election took place on 1 May 2003 to elect members of Derby City Council in England. One third of the council was up for election and the Labour party lost overall control of the council to no overall control. [1]
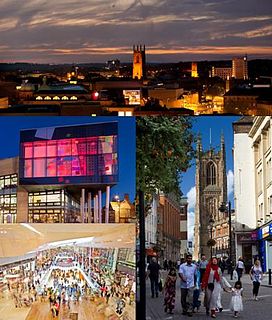
Derby is a city and unitary authority area in Derbyshire, England. It lies on the banks of the River Derwent in the south of Derbyshire, of which it was traditionally the county town. At the 2011 census, the population was 248,700. Derby gained city status in 1977.
Derby City Council is the local government unitary authority for Derby, a city in the East Midlands region of England. It is composed of 51 councillors, three for each of the 17 electoral wards of Derby. Currently there is no overall control of the council, with the Labour Party being the biggest party. The acting council chief executive is Christine Durrant. Carole Mills will take over as Chief Executive from August 2018.
England is a country that is part of the United Kingdom. It shares land borders with Wales to the west and Scotland to the north-northwest. The Irish Sea lies west of England and the Celtic Sea lies to the southwest. England is separated from continental Europe by the North Sea to the east and the English Channel to the south. The country covers five-eighths of the island of Great Britain, which lies in the North Atlantic, and includes over 100 smaller islands, such as the Isles of Scilly and the Isle of Wight.
After the election, the composition of the council was
The Labour Party is a centre-left political party in the United Kingdom which has been described as an alliance of social democrats, democratic socialists and trade unionists. The party's platform emphasises greater state intervention, social justice and strengthening workers' rights.
The Liberal Democrats are a liberal political party in the United Kingdom. They presently have 11 Members of Parliament in the House of Commons, 96 members of the House of Lords, and one member of the European Parliament. They also have five Members of the Scottish Parliament and a member each in the Welsh Assembly and London Assembly. The party reached the height of its influence in the early 2010s, forming a junior partner in a coalition government from 2010 to 2015. It is presently led by Vince Cable.
The Conservative Party, officially the Conservative and Unionist Party, is a centre-right political party in the United Kingdom. Presently led by Theresa May, it has been the governing party since 2010. It presently has 314 Members of Parliament in the House of Commons, 249 members of the House of Lords, and 18 members of the European Parliament. It also has 31 Members of the Scottish Parliament, 12 members of the Welsh Assembly, eight members of the London Assembly and 9,008 local councillors. One of the major parties of UK politics, it has formed the government on 45 occasions, more than any other party.
Party | Seats | Gains | Losses | Net gain/loss | Seats % | Votes % | Votes | +/− | |
---|---|---|---|---|---|---|---|---|---|
Labour | 7 | 0 | 2 | -2 | 36.8 | 31.5 | 18,586 | -6.5% | |
Liberal Democrat | 6 | 1 | 0 | +1 | 31.6 | 30.9 | 18,234 | +2.5% | |
Conservative | 5 | 1 | 0 | +1 | 26.3 | 30.6 | 18,039 | -1.0% | |
Independent | 1 | 0 | 0 | 0 | 5.3 | 7.0 | 4,113 | +5.0% |
Party | Candidate | Votes | % | ± | |
---|---|---|---|---|---|
Liberal Democrat | Bryan Lowe | 1,283 | 52.5 | ||
Labour | Michael Fuller | 791 | 32.3 | ||
Conservative | David Hart | 287 | 11.7 | ||
Independent | Ronald McKeown | 85 | 3.5 | ||
Majority | 492 | 20.2 | |||
Turnout | 2,446 | 25.6 | |||
Liberal Democrat hold | Swing |
Party | Candidate | Votes | % | ± | |
---|---|---|---|---|---|
Conservative | Balbir Samra | 2,132 | 50.7 | ||
Liberal Democrat | Roger Jackson | 1,053 | 25.0 | ||
Labour | David Byrne | 1,021 | 24.3 | ||
Majority | 1,079 | 25.7 | |||
Turnout | 4,206 | 39.1 | |||
Conservative hold | Swing |
Party | Candidate | Votes | % | ± | |
---|---|---|---|---|---|
Labour | Christopher Wynn | 1,231 | 47.5 | ||
Conservative | Adrian Pegg | 536 | 20.7 | ||
Independent | Trevlyn Atkinson | 417 | 16.1 | ||
Liberal Democrat | Cara Copestick | 408 | 15.7 | ||
Majority | 695 | 26.8 | |||
Turnout | 2,592 | 25.0 | |||
Labour hold | Swing |
Party | Candidate | Votes | % | ± | |
---|---|---|---|---|---|
Labour | Fareed Hussain | 1,168 | 44.8 | ||
Liberal Democrat | Lloyd Newby | 595 | 22.8 | ||
Conservative | Shayad Mahmood | 535 | 20.5 | ||
Independent | Margaret Rooney | 309 | 11.9 | ||
Majority | 573 | 22.0 | |||
Turnout | 2,607 | 26.1 | |||
Labour hold | Swing |
Party | Candidate | Votes | % | ± | |
---|---|---|---|---|---|
Liberal Democrat | Robert Troup | 2,044 | 57.5 | ||
Labour | Stephen Melvin | 911 | 25.6 | ||
Conservative | Janice Lee | 537 | 15.1 | ||
Independent | Andries Olivier | 61 | 1.7 | ||
Majority | 1,133 | 31.9 | |||
Turnout | 3,553 | 36.7 | |||
Liberal Democrat hold | Swing |
Party | Candidate | Votes | % | ± | |
---|---|---|---|---|---|
Independent | Ronald Allen | 1,316 | 41.8 | ||
Labour | Mark Tittley | 1,123 | 35.7 | ||
Conservative | Sean Conway | 521 | 16.6 | ||
Liberal Democrat | Eric Ashburner | 186 | 5.9 | ||
Majority | 193 | 6.1 | |||
Turnout | 3,146 | 31.3 | |||
Independent hold | Swing |
Party | Candidate | Votes | % | ± | |
---|---|---|---|---|---|
Labour | Anne MacDonald | 1,475 | 49.2 | ||
Conservative | Vincent Mills | 973 | 32.5 | ||
Liberal Democrat | Leslie Alcock | 448 | 14.9 | ||
Independent | Brian Low | 102 | 3.4 | ||
Majority | 502 | 16.7 | |||
Turnout | 2,998 | 29.6 | |||
Labour hold | Swing |
Party | Candidate | Votes | % | ± | |
---|---|---|---|---|---|
Conservative | Ronald Liversedge | 1,393 | |||
Conservative | Julie Hickson | 1,274 | |||
Labour | David Whitehead | 1,189 | |||
Labour | Alan Mullarkey | 1,009 | |||
Independent | David Black | 572 | |||
Independent | Julia Slater | 396 | |||
Liberal Democrat | Christine Yates | 290 | |||
Liberal Democrat | Harjinder Naitta | 195 | |||
Turnout | 6,318 | 34.2 | |||
Conservative hold | Swing | ||||
Conservative gain from Labour | Swing | ||||
Party | Candidate | Votes | % | ± | |
---|---|---|---|---|---|
Liberal Democrat | Joan Travis | 1,406 | 41.9 | ||
Labour | Michael Futers | 973 | 29.0 | ||
Conservative | Graham Else | 876 | 26.1 | ||
Independent | Graham Leeming | 101 | 3.0 | ||
Majority | 433 | 12.9 | |||
Turnout | 3,356 | 34.6 | |||
Liberal Democrat gain from Labour | Swing | ||||
Party | Candidate | Votes | % | ± | |
---|---|---|---|---|---|
Labour | Suman Gupta | 853 | 43.0 | ||
Conservative | Franklyn Harwood | 719 | 36.2 | ||
Liberal Democrat | Rafe Nauen | 233 | 11.7 | ||
Independent | Mark Bull | 179 | 9.0 | ||
Majority | 134 | 6.8 | |||
Turnout | 1,984 | 20.7 | |||
Labour hold | Swing |
Party | Candidate | Votes | % | ± | |
---|---|---|---|---|---|
Liberal Democrat | Michael Carr | 2,298 | 64.4 | ||
Conservative | Mark Collins | 803 | 22.5 | ||
Labour | Peter Blount | 468 | 13.1 | ||
Majority | 1,495 | 41.9 | |||
Turnout | 3,569 | 37.5 | |||
Liberal Democrat hold | Swing |
Party | Candidate | Votes | % | ± | |
---|---|---|---|---|---|
Labour | Veronica Wilsoncroft | 1,104 | 47.5 | ||
Conservative | Elizabeth Waters | 742 | 31.9 | ||
Liberal Democrat | Lorraine Brown | 479 | 20.6 | ||
Majority | 362 | 15.6 | |||
Turnout | 2,325 | 23.9 | |||
Labour hold | Swing |
Party | Candidate | Votes | % | ± | |
---|---|---|---|---|---|
Liberal Democrat | Margaret Hird | 2,558 | |||
Liberal Democrat | Marilyn Winter | 2,516 | |||
Conservative | Virginia Lemmings | 1,468 | |||
Conservative | Christine Pearn | 1,449 | |||
Labour | Lisa Higginbottom | 536 | |||
Labour | Keith Normington | 427 | |||
Independent | Ivor Cox | 96 | |||
Turnout | 9,050 | 42.4 | |||
Liberal Democrat hold | Swing | ||||
Liberal Democrat hold | Swing |
Party | Candidate | Votes | % | ± | |
---|---|---|---|---|---|
Labour | Amar Nath | 1,351 | 47.6 | ||
Liberal Democrat | Sean Marshall | 1,092 | 38.5 | ||
Conservative | Joan Magee | 306 | 10.8 | ||
Independent | Richard Bull | 89 | 3.1 | ||
Majority | 259 | 9.1 | |||
Turnout | 2,838 | 28.9 | |||
Labour hold | Swing |
Party | Candidate | Votes | % | ± | |
---|---|---|---|---|---|
Conservative | Paul West | 1,408 | 52.1 | ||
Labour | Phillip Woodhead | 900 | 33.3 | ||
Liberal Democrat | Philip Clayden | 392 | 14.5 | ||
Majority | 508 | 18.8 | |||
Turnout | 2,700 | 27.0 | |||
Conservative hold | Swing |
Party | Candidate | Votes | % | ± | |
---|---|---|---|---|---|
Labour | Prem Chera | 1,049 | 53.7 | ||
Liberal Democrat | Leigh Alcock | 367 | 18.8 | ||
Conservative | Richard Pearn | 282 | 14.4 | ||
Independent | Mario Colella | 165 | 8.4 | ||
Independent | Dorothy Skrytek | 90 | 4.6 | ||
Majority | 682 | 34.9 | |||
Turnout | 1,953 | 20.6 | |||
Labour hold | Swing |
Party | Candidate | Votes | % | ± | |
---|---|---|---|---|---|
Conservative | Peter Berry | 1,798 | 54.0 | ||
Labour | Frank Kirkland | 1,007 | 30.2 | ||
Liberal Democrat | Patrick Peat | 391 | 11.7 | ||
Independent | William Peake | 135 | 4.1 | ||
Majority | 791 | 23.8 | |||
Turnout | 3,331 | 35.1 | |||
Conservative hold | Swing |
The 1998 Salford Council election took place on 7 May 1998 to elect members of Salford Metropolitan Borough Council in Greater Manchester, England. One-third of the council was up for election and the Labour party kept overall control of the council. Overall turnout was 19.39%.
The 2004 West Lancashire District Council election took place on 10 June 2004 to elect members of West Lancashire District Council in Lancashire, England. One third of the council was up for election and the Conservative party stayed in overall control of the council.
The 2006 West Lancashire District Council election took place on 4 May 2006 to elect members of West Lancashire District Council in Lancashire, England. One third of the council was up for election and the Conservative party stayed in overall control of the council.
The 1999 Lichfield District Council election took place on 6 May 1999 to elect members of Lichfield District Council in Staffordshire, England. The whole council was up for election and the Conservative party gained overall control of the council from the Labour party.
Elections to Reigate and Banstead Council in Surrey, England were held on 7 May 1998. One third of the council was up for election and the council stayed under no overall control.
The 2003 Gateshead Council election was held on 1 May 2003 to elect members of Gateshead Council in Tyne and Wear, England. One third of the council was up for election and the Labour party kept overall control of the council.
The 1998 Derby City Council election took place on 7 May 1998 to elect members of Derby City Council in England. One third of the council was up for election and the Labour party kept overall control of the council.
The 1999 Derby City Council election took place on 6 May 1999 to elect members of Derby City Council in England. One third of the council was up for election and the Labour party kept overall control of the council. Overall turnout was 29.0%.
The 2000 Derby City Council election took place on 4 May 2000 to elect members of Derby City Council in England. One third of the council was up for election and the Labour party kept overall control of the council.
The 2002 Derby City Council election took place on 2 May 2002 to elect members of Derby City Council in England. The whole council was up for election after boundary changes since the last election in 2000 had increased the number of seats by 7. The Labour party stayed in overall control of the council.
The 2004 Derby City Council election took place on 10 June 2004 to elect members of Derby City Council in England. One third of the council was up for election and the council stayed under no overall control.
The 2006 Derby City Council election took place on 4 May 2006 to elect members of Derby City Council in England. One third of the council was up for election and the Labour party lost their majority on the council to no overall control.
The 2007 Derby City Council election took place on 3 May 2007 to elect members of Derby City Council in England. One third of the council was up for election and the council stayed under no overall control.
The 2008 Derby City Council election took place on 1 May 2008 to elect members of Derby City Council in England. One third of the council was up for election and the council stayed under no overall control. Overall turnout was 34.6%.
The 2003 St Albans City and District Council election took place on 1 May 2003 to elect members of St Albans District Council in Hertfordshire, England. One third of the council was up for election and the council stayed under no overall control.
The 2006 St Albans City and District Council election took place on 4 May 2006 to elect members of St Albans District Council in Hertfordshire, England. One third of the council was up for election and the Liberal Democrats gained overall control of the council from no overall control.
The 2010 Winchester Council election took place on 6 May 2010 to elect members of Winchester District Council in Hampshire, England. One third of the council was up for election and the Liberal Democrats gained overall control of the council from the Conservative party.
Elections to Broxtowe Borough Council were held on 5 May 2011 to elect all 44 members to the Council.
The 2003 Southampton Council election took place on 1 May 2003 to elect members of Southampton Unitary Council in Hampshire, England. One third of the council was up for election and the council stayed under no overall control.
The 2010 Amber Valley Borough Council election took place on 6 May 2010 to elect members of Amber Valley Borough Council in Derbyshire, England. One third of the council was up for election and the Conservative party stayed in overall control of the council.