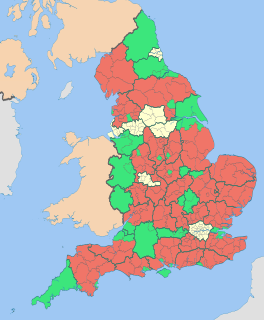
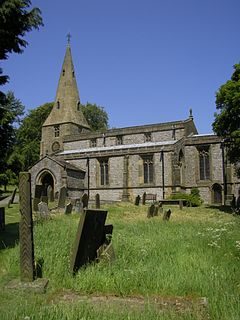
The 2003 Derbyshire Dales District Council election took place on 1 May 2003 to elect members of Derbyshire Dales District Council in Derbyshire, England. The whole council was up for election with boundary changes since the last election in 1999. [1] The Conservative party stayed in overall control of the council. [2]
Derbyshire Dales is a local government district in Derbyshire, England. The population of the district as taken at the 2011 Census was 71,116. Much of the district is situated in the Peak District, although most of its population lies along the River Derwent.
Non-metropolitan districts, or colloquially "shire districts", are a type of local government district in England. As created, they are sub-divisions of non-metropolitan counties in a two-tier arrangement.
England is a country that is part of the United Kingdom. It shares land borders with Wales to the west and Scotland to the north-northwest. The Irish Sea lies west of England and the Celtic Sea lies to the southwest. England is separated from continental Europe by the North Sea to the east and the English Channel to the south. The country covers five-eighths of the island of Great Britain, which lies in the North Atlantic, and includes over 100 smaller islands, such as the Isles of Scilly and the Isle of Wight.
Before the election the Conservatives had a majority on the council with 21 seats, compared to 9 for the Liberal Democrats, 6 for Labour and 3 independents. [3]
The Liberal Democrats are a liberal political party in the United Kingdom. They presently have 11 Members of Parliament in the House of Commons, 96 members of the House of Lords, and one member of the European Parliament. They also have five Members of the Scottish Parliament and a member each in the Welsh Assembly and London Assembly. The party reached the height of its influence in the early 2010s, forming a junior partner in a coalition government from 2010 to 2015. It is presently led by Vince Cable.
The Labour Party is a centre-left political party in the United Kingdom which has been described as an alliance of social democrats, democratic socialists and trade unionists. The party's platform emphasises greater state intervention, social justice and strengthening workers' rights.
Issues at the election included housing, with the Conservatives saying they would make more land available, council tax, where the Liberal Democrats attacked the Conservatives for a 19.9% increase, and waste collection, with Labour objecting to the end of large waste collection, which they said had led to fly tipping. [3] The Liberal Democrats said they were targeting seats in the villages of Baslow and Taddington, while Labour said they were aiming for Darley Dale. [3] However the Conservatives were guaranteed seats after the election, as 13 of their candidates faced no opposition, [3] the highest number of any council in the country. [4]
Baslow is a village in Derbyshire, England, in the Peak District, situated between Sheffield and Bakewell, just over 1 mile (1.6 km) north of Chatsworth House. It is sited by the River Derwent, which is spanned by a 17th-century bridge, alongside which is a contemporary toll house.
Taddington is a village and civil parish in Derbyshire, England. The population of the civil parish, together with neighbouring Blackwell in the Peak and Brushfield parishes, as taken at the 2011 Census, was 457. It lies over 1,100 feet (340 m) above sea level, on the former A6 road between Buxton and Bakewell, in the Derbyshire Dales district. To the east, the A6 runs through Taddington Dale, while Taddington Moor lies to the west.
Darley Dale, also known simply as Darley, is a town and civil parish in the Derbyshire Dales district of Derbyshire, England, with a population of around 6,000. It lies north of Matlock, on the River Derwent and the A6 road.The town forms part of the urban area of Matlock. It is a commuter town for workers in Matlock.
The Conservatives gained 3 seats to increase their majority on the council with 24 councillors, after gaining seats from independents in Bakewell ward. [5] The Liberal Democrats remained on 9 seats, while Labour finished with 5 seats and 1 independent was elected. [5] Turnout at the election varied between a high of 52% and a low of 24%, [6] but was down on the 1999 election. [5]
A Councillor is a member of a local government council.
Bakewell is a small market town and civil parish in the Derbyshire Dales district of Derbyshire, England, well known for the local confection Bakewell pudding. It is located on the River Wye, about thirteen miles (21 km) southwest of Sheffield. In the 2011 census the civil parish of Bakewell had a population of 3,949. The town is close to the tourist attractions of Chatsworth House and Haddon Hall.
Voter turnout is the percentage of eligible voters who cast a ballot in an election. Eligibility varies by country, and the voting-eligible population should not be confused with the total adult population. Age and citizenship status are often among the criteria used to determine eligibility, but some countries further restrict eligibility based on sex, race, or religion.
Party | Seats | Gains | Losses | Net gain/loss | Seats % | Votes % | Votes | +/− | |
---|---|---|---|---|---|---|---|---|---|
Conservative | 24 | +3 | 61.5 | 42.5 | 13,153 | ||||
Liberal Democrat | 9 | 0 | 23.1 | 35.7 | 11,058 | ||||
Labour | 5 | -1 | 12.8 | 14.3 | 4,438 | ||||
Independent | 1 | -2 | 2.6 | 7.5 | 2,310 | ||||
Party | Candidate | Votes | % | ± | |
---|---|---|---|---|---|
Conservative | Frederick Elliott | unopposed | |||
Conservative | Anthony Millward | unopposed | |||
Party | Candidate | Votes | % | ± | |
---|---|---|---|---|---|
Conservative | Andrew Lewer | 517 | |||
Conservative | Alan Hodkinson | 487 | |||
Labour | Che Lear Page | 210 | |||
Labour | Lytton Page | 165 | |||
Turnout | 1,379 | 24.0 | |||
Party | Candidate | Votes | % | ± | |
---|---|---|---|---|---|
Conservative | Judith Twigg | 1,042 | |||
Conservative | Carol Walker | 810 | |||
Conservative | John Pearce | 786 | |||
Independent | John Brighton | 531 | |||
Independent | Hilary Young | 452 | |||
Liberal Democrat | Maureen Smith | 376 | |||
Liberal Democrat | Helen Pocock | 351 | |||
Independent | Trevor Smith | 332 | |||
Liberal Democrat | Joyce Steele | 298 | |||
Labour | Stephen Pope | 162 | |||
Turnout | 5,140 | 46.4 | |||
Party | Candidate | Votes | % | ± | |
---|---|---|---|---|---|
Conservative | Janet Goodison | unopposed | |||
Party | Candidate | Votes | % | ± | |
---|---|---|---|---|---|
Conservative | Carol Valentine | unopposed | |||
Party | Candidate | Votes | % | ± | |
---|---|---|---|---|---|
Conservative | Catherine Hunt | 575 | 72.2 | ||
Liberal Democrat | Shirley Holt | 221 | 27.8 | ||
Majority | 354 | 44.5 | |||
Turnout | 796 | 49.5 | |||
Party | Candidate | Votes | % | ± | |
---|---|---|---|---|---|
Conservative | Lewis Rose | 468 | 77.7 | ||
Liberal Democrat | Julia Pulman | 134 | 22.3 | ||
Majority | 334 | 55.5 | |||
Turnout | 602 | 40.2 | |||
Party | Candidate | Votes | % | ± | |
---|---|---|---|---|---|
Conservative | Michael Longden | unopposed | |||
Party | Candidate | Votes | % | ± | |
---|---|---|---|---|---|
Conservative | Ian Bates | unopposed | |||
Party | Candidate | Votes | % | ± | |
---|---|---|---|---|---|
Liberal Democrat | David Burton | 1,051 | |||
Liberal Democrat | David Fearn | 1,014 | |||
Liberal Democrat | Sandra Fearn | 989 | |||
Conservative | John Wall | 396 | |||
Conservative | Howard Simpson-Birks | 395 | |||
Conservative | Terence Kilburn | 344 | |||
Labour | Fionntann Page | 184 | |||
Turnout | 4,373 | 37.8 | |||
Party | Candidate | Votes | % | ± | |
---|---|---|---|---|---|
Conservative | Simon Spencer | 441 | 77.1 | ||
Labour | Eric Page | 131 | 22.9 | ||
Majority | 310 | 54.2 | |||
Turnout | 572 | 46.0 | |||
Party | Candidate | Votes | % | ± | |
---|---|---|---|---|---|
Conservative | Charles Brindley | unopposed | |||
Party | Candidate | Votes | % | ± | |
---|---|---|---|---|---|
Conservative | David Chapman | 364 | 74.0 | ||
Liberal Democrat | Eleanor Nancolas | 128 | 26.0 | ||
Majority | 236 | 48.0 | |||
Turnout | 492 | 38.1 | |||
Party | Candidate | Votes | % | ± | |
---|---|---|---|---|---|
Conservative | Jacqueline Bevan | unopposed | |||
Conservative | David Hoskin | unopposed | |||
Party | Candidate | Votes | % | ± | |
---|---|---|---|---|---|
Conservative | Jennifer Radford | unopposed | |||
Party | Candidate | Votes | % | ± | |
---|---|---|---|---|---|
Independent | William Moore | 320 | 52.2 | ||
Conservative | Andrew Howard | 293 | 47.8 | ||
Majority | 27 | 4.4 | |||
Turnout | 613 | 45.4 | |||
Party | Candidate | Votes | % | ± | |
---|---|---|---|---|---|
Conservative | Robert Otter | unopposed | |||
Party | Candidate | Votes | % | ± | |
---|---|---|---|---|---|
Labour | John March | 395 | |||
Labour | Nicholas Elliott | 328 | |||
Liberal Democrat | Barbara Bowman | 248 | |||
Conservative | Joanna Cochrane | 237 | |||
Liberal Democrat | Janet Beckett | 236 | |||
Conservative | Vivienne Smith | 230 | |||
Turnout | 1,674 | 33.2 | |||
Party | Candidate | Votes | % | ± | |
---|---|---|---|---|---|
Liberal Democrat | David Barker | 914 | |||
Liberal Democrat | Martin Burfoot | 897 | |||
Conservative | Geoffrey Stevens | 867 | |||
Liberal Democrat | Martyn Moss | 766 | |||
Conservative | Melvyn Askew | 566 | |||
Conservative | John Smith | 541 | |||
Independent | Ann Elliott | 413 | |||
Independent | Jacqueline Power | 262 | |||
Turnout | 5,226 | 43.2 | |||
Party | Candidate | Votes | % | ± | |
---|---|---|---|---|---|
Liberal Democrat | Stephen Flitter | 1,035 | |||
Liberal Democrat | Anthony Allwood | 913 | |||
Liberal Democrat | Ursula Lunn | 815 | |||
Conservative | Diana Dakin | 703 | |||
Conservative | Jacqueline Stevens | 692 | |||
Conservative | Barrie Tipping | 665 | |||
Labour | Tane Page | 229 | |||
Turnout | 5,052 | 41.8 | |||
Party | Candidate | Votes | % | ± | |
---|---|---|---|---|---|
Conservative | Kenneth Bull | unopposed | |||
Party | Candidate | Votes | % | ± | |
---|---|---|---|---|---|
Conservative | Deborah Read | unopposed | |||
Party | Candidate | Votes | % | ± | |
---|---|---|---|---|---|
Conservative | Tracy Critchlow | 282 | 50.9 | ||
Liberal Democrat | Susan Barber | 272 | 49.1 | ||
Majority | 10 | 1.8 | |||
Turnout | 554 | 36.9 | |||
Party | Candidate | Votes | % | ± | |
---|---|---|---|---|---|
Liberal Democrat | Raymond Dring | 400 | 64.6 | ||
Conservative | Jean Wall | 128 | 20.7 | ||
Labour | Paul Tozer | 91 | 14.7 | ||
Majority | 272 | 43.9 | |||
Turnout | 619 | 52.0 | |||
Party | Candidate | Votes | % | ± | |
---|---|---|---|---|---|
Labour | Irene Ratcliffe | 901 | |||
Labour | James Ratcliffe | 822 | |||
Labour | Peter Slack | 820 | |||
Conservative | Kevin Hall | 468 | |||
Conservative | Gladwyn Gratton | 452 | |||
Conservative | Lesley Hall | 405 | |||
Turnout | 3,868 | 31.2 | |||
A by-election in All Saints Matlock was held on 27 November 2003 after the Liberal Democrat councillor Martin Burfoot was forced to resign after complaints of a conflict of interest due to his holding a position on the Peak District National Park Authority. [8] His wife Sue Burfoot held the seat for the Liberal Democrats. [8]
By-elections, also spelled bye-elections, are used to fill elected offices that have become vacant between general elections.
A conflict of interest (COI) is a situation in which a person or organization is involved in multiple interests, financial or otherwise, and serving one interest could involve working against another. Typically, this relates to situations in which the personal interest of an individual or organization might adversely affect a duty owed to make decisions for the benefit of a third party.
Party | Candidate | Votes | % | ± | |
---|---|---|---|---|---|
Liberal Democrat | Sue Burfoot | 678 | 54.0 | +16.8 | |
Conservative | Jacquie Stevens | 578 | 46.0 | +10.7 | |
Majority | 100 | 8.0 | |||
Turnout | 1,256 | 29.0 | |||
Liberal Democrat hold | Swing | ||||
Party | Candidate | Votes | % | ± | |
---|---|---|---|---|---|
Conservative | 338 | 66.0 | |||
Liberal Democrat | Sue Barber | 174 | 34.0 | ||
Majority | 164 | 32.0 | |||
Turnout | 512 | 36.0 | |||
Conservative hold | Swing | ||||
Party | Candidate | Votes | % | ± | |
---|---|---|---|---|---|
Conservative | Edward Moseley | 316 | 40.8 | +20.1 | |
Liberal Democrat | George Edwards | 281 | 36.2 | -28.4 | |
Labour | 178 | 23.0 | +8.3 | ||
Majority | 35 | 4.6 | |||
Turnout | 775 | ||||
Conservative gain from Liberal Democrat | Swing | ||||
Party | Candidate | Votes | % | ± | |
---|---|---|---|---|---|
Independent | unopposed | ||||
Independent hold | Swing | ||||
The 2004 Craven District Council election took place on 10 June 2004 to elect members of Craven District Council in North Yorkshire, England. One third of the council was up for election and the council stayed under no overall control.
The 2003 Harlow District Council election took place on 1 May 2003 to elect members of Harlow District Council in Essex, England. One third of the council was up for election and the council stayed under no overall control.
The 1998 Wyre Forest District Council election took place on 7 May 1998 to elect members of Wyre Forest District Council in Worcestershire, England. One third of the council was up for election and the Labour party stayed in overall control of the council.
The 2007 Derbyshire Dales District Council election took place on 3 May 2007 to elect members of Derbyshire Dales District Council in Derbyshire, England. The whole council was up for election and the Conservative party stayed in overall control of the council.
The 2011 Derbyshire Dales District Council election took place on 5 May 2011 to elect members of Derbyshire Dales District Council in Derbyshire, England. The whole council was up for election and the Conservative party stayed in overall control of the council.
The 1999 Wealden District Council election took place on 6 May 1999 to elect members of Wealden District Council in East Sussex, England. The whole council was up for election and the Conservative party stayed in overall control of the council.
The 2003 Wealden District Council election took place on 1 May 2003 to elect members of Wealden District Council in East Sussex, England. The whole council was up for election with boundary changes since the last election in 1999 reducing the number of seats by 3. The Conservative party stayed in overall control of the council.
The 2011 Wealden District Council election took place on 5 May 2011 to elect members of Wealden District Council in East Sussex, England. The whole council was up for election and the Conservative party stayed in overall control of the council.
The 2011 St Albans City and District Council election took place on 5 May 2011 to elect members of St Albans District Council in Hertfordshire, England. One third of the council was up for election and the Liberal Democrats lost overall control of the council to no overall control.
The 2006 Havant Borough Council election took place on 4 May 2006 to elect members of Havant Borough Council in Hampshire, England. One third of the council was up for election and the Conservative party stayed in overall control of the council.
The 2008 Huntingdonshire District Council election took place on 1 May 2008 to elect members of Huntingdonshire District Council in Cambridgeshire, England. One third of the council was up for election and the Conservative party stayed in overall control of the council.
The 2012 Huntingdonshire District Council election took place on 3 May 2012 to elect members of Huntingdonshire District Council in Cambridgeshire, England. One third of the council was up for election and the Conservative party stayed in overall control of the council.
The 2014 Huntingdonshire District Council election took place on 22 May 2014 to elect members of Huntingdonshire District Council in Cambridgeshire, England. One third of the council was up for election and the Conservative party stayed in overall control of the council.
The 2003 Rother District Council election took place on 1 May 2003 to elect members of Rother District Council in East Sussex, England. The whole council was up for election after boundary changes reduced the number of seats by 7. The Conservative party stayed in overall control of the council.
The 2007 Rother District Council election took place on 3 May 2007 to elect members of Rother District Council in East Sussex, England. The whole council was up for election and the Conservative party stayed in overall control of the council.
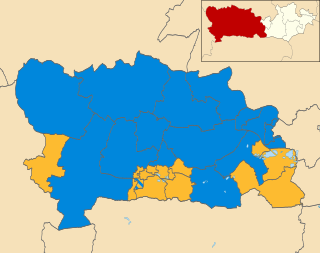
The 2003 West Berkshire Council election took place on 1 May 2003 to elect members of West Berkshire Council in Berkshire, England. The whole council was up for election with boundary changes since the last election in 2000 reducing the number of seats by 2. The Liberal Democrats lost overall control of the council to no overall control.
The 1999 Wychavon District Council election took place on 6 May 1999 to elect members of Wychavon District Council in Worcestershire, England. The whole council was up for election and the Conservative party gained overall control of the council from no overall control.
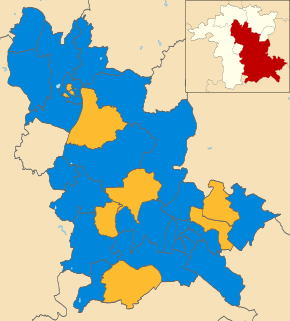
The 2007 Wychavon District Council election took place on 3 May 2007 to elect members of Wychavon District Council in Worcestershire, England. The whole council was up for election and the Conservative party stayed in overall control of the council.
The 2003 South Kesteven District Council election took place on 1 May 2003 to elect members of South Kesteven District Council in Lincolnshire, England. The whole council was up for election and the Conservative party gained control of the council from no overall control.
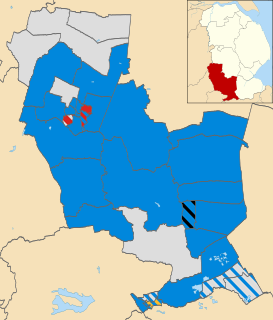
The 2011 South Kesteven District Council election took place on 5 May 2011 to elect members of South Kesteven District Council in Lincolnshire, England. The whole council was up for election and the Conservative party stayed in overall control of the council.