Economic surplus

Last updated
Graph illustrating consumer (red) and producer (blue) surpluses on a supply and demand chart Economic-surpluses.svg
Graph illustrating consumer (red) and producer (blue) surpluses on a supply and demand chart

In mainstream economics, economic surplus, also known as total welfare or total social welfare or Marshallian surplus (after Alfred Marshall), is either of two related quantities:

Contents

The sum of consumer and producer surplus is sometimes known as social surplus or total surplus; a decrease in that total from inefficiencies is called deadweight loss. [3]

Overview

In the mid-19th century, engineer Jules Dupuit first propounded the concept of economic surplus, but it was the economist Alfred Marshall who gave the concept its fame in the field of economics.

On a standard supply and demand diagram, consumer surplus is the area (triangular if the supply and demand curves are linear) above the equilibrium price of the good and below the demand curve. This reflects the fact that consumers would have been willing to buy a single unit of the good at a price higher than the equilibrium price, a second unit at a price below that but still above the equilibrium price, etc., yet they in fact pay just the equilibrium price for each unit they buy.

Likewise, in the supply-demand diagram, producer surplus is the area below the equilibrium price but above the supply curve. This reflects the fact that producers would have been willing to supply the first unit at a price lower than the equilibrium price, the second unit at a price above that but still below the equilibrium price, etc., yet they in fact receive the equilibrium price for all the units they sell.

History

Early writers of economic issues used surplus as a means to draw conclusions about the relationship between production and necessities. In the agricultural sector surplus was an important concept because this sector has the responsibility to feed everyone plus itself. Food is notable because people only need a specific amount of food and can only consume a limited amount. This means that excess food production must overflow to other people, and will not be rationally hoarded. The non-agricultural sector is therefore limited by the agricultural sector equaling the output of food subtracting the amount consumed by the agricultural sector.

William Petty [4] used a broad definition of necessities, leading him to focus on employment issues surrounding surplus. Petty explains a hypothetical example in which there is a territory of 1000 men and 100 of those men are capable of producing enough food for all 1000 men. The question becomes, what will the rest of the men do if only 100 are needed to provide necessities? He thereby suggests a variety of employments with some remaining unemployed. [5]

David Hume approached the agricultural surplus concept from another direction. Hume recognized that agriculture may feed more than those who cultivate it, but questioned why farmers would work to produce more than they need. Forceful production, which may occur under a feudal system, would be unlikely to generate a notable surplus in his opinion. Yet, if they could purchase luxuries and other goods beyond their necessities, they would become incentivized to produce and sell a surplus. Hume did not see this concept as abstract theory, he stated it as a fact when discussing how England developed after the introduction of foreign luxuries in his History of England. [4]

Adam Smith's thoughts on surplus drew on Hume. Smith noted that the desire for luxuries is infinite compared to the finite capacity of hunger. Smith saw the development in Europe as originating from landlords placing more importance on luxury spending rather than political power. [4]

Consumer surplus

Consumer surplus is the difference between the maximum price a consumer is willing to pay and the actual price they do pay. If a consumer is willing to pay more for a unit of a good than the current asking price, they are getting more benefit from the purchased product than they would if the price was their maximum willingness to pay. They are receiving the same benefit, the obtainment of the good, at a lesser cost. [6] An example of a good with generally high consumer surplus is drinking water. People would pay very high prices for drinking water, as they need it to survive. The difference in the price that they would pay, if they had to, and the amount that they pay now is their consumer surplus. The utility of the first few liters of drinking water is very high (as it prevents death), so the first few liters would likely have more consumer surplus than subsequent quantities.

The maximum amount a consumer would be willing to pay for a given quantity of a good is the sum of the maximum price they would pay for the first unit, the (lower) maximum price they would be willing to pay for the second unit, etc. Typically these prices are decreasing; they are given by the individual demand curve, which must be generated by a rational consumer who maximizes utility subject to a budget constraint. [6] Because the demand curve is downward sloping, there is diminishing marginal utility. Diminishing marginal utility means a person receives less additional utility from an additional unit. However, the price of a product is constant for every unit at the equilibrium price. The extra money someone would be willing to pay for the number units of a product less than the equilibrium quantity and at a higher price than the equilibrium price for each of these quantities is the benefit they receive from purchasing these quantities. [7] For a given price the consumer buys the amount for which the consumer surplus is highest. The consumer's surplus is highest at the largest number of units for which, even for the last unit, the maximum willingness to pay is not below the market price.

Consumer surplus can be used as a measurement of social welfare, shown by Robert Willig. [8] For a single price change, consumer surplus can provide an approximation of changes in welfare. With multiple price and/or income changes, however, consumer surplus cannot be used to approximate economic welfare because it is not single-valued anymore. More modern methods are developed later to estimate the welfare effect of price changes using consumer surplus.

The aggregate consumers' surplus is the sum of the consumer's surplus for all individual consumers. This aggregation can be represented graphically, as shown in the above graph of the market demand and supply curves. The aggregate consumers' surplus can also be said to be the maxim of satisfaction a consumer derives from particular goods and services.

Calculation from supply and demand

The consumer surplus (individual or aggregated) is the area under the (individual or aggregated) demand curve and above a horizontal line at the actual price (in the aggregated case, the equilibrium price). If the demand curve is a straight line, the consumer surplus is the area of a triangle:

where Pmkt is the equilibrium price (where supply equals demand), Qmkt is the total quantity purchased at the equilibrium price, and Pmax is the price at which the quantity purchased would fall to 0 (that is, where the demand curve intercepts the price axis). For more general demand and supply functions, these areas are not triangles but can still be found using integral calculus. Consumer surplus is thus the definite integral of the demand function with respect to price, from the market price to the maximum reservation price (i.e., the price-intercept of the demand function):

where This shows that if we see a rise in the equilibrium price and a fall in the equilibrium quantity, then consumer surplus falls.

Calculation of a change in consumer surplus

The change in consumer surplus is used to measure the changes in prices and income. The demand function used to represent an individual's demand for a certain product is essential in determining the effects of a price change. An individual's demand function is a function of the individual's income, the demographic characteristics of the individual, and the vector of commodity prices. When the price of a product changes, the change in consumer surplus is measured as the negative value of the integral from the original actual price (P0) and the new actual price (P1) of the demand for product by the individual. If the change in consumer surplus is positive, the price change is said to have increased the individuals welfare. If the price change in consumer surplus is negative, the price change is said to have decreased the individual's welfare. [6]

Distribution of benefits when price falls

When supply of a good expands, the price falls (assuming the demand curve is downward sloping) and consumer surplus increases. This benefits two groups of people: consumers who were already willing to buy at the initial price benefit from a price reduction, and they may buy more and receive even more consumer surplus; and additional consumers who were unwilling to buy at the initial price will buy at the new price and also receive some consumer surplus.

Consider an example of linear supply and demand curves. For an initial supply curve S0, consumer surplus is the triangle above the line formed by price P0 to the demand line (bounded on the left by the price axis and on the top by the demand line). If supply expands from S0 to S1, the consumers' surplus expands to the triangle above P1 and below the demand line (still bounded by the price axis). The change in consumer's surplus is difference in area between the two triangles, and that is the consumer welfare associated with expansion of supply.

Some people were willing to pay the higher price P0. When the price is reduced, their benefit is the area in the rectangle formed on the top by P0, on the bottom by P1, on the left by the price axis and on the right by line extending vertically upwards from Q0.

The second set of beneficiaries are consumers who buy more, and new consumers, those who will pay the new lower price (P1) but not the higher price (P0). Their additional consumption makes up the difference between Q1 and Q0. Their consumer surplus is the triangle bounded on the left by the line extending vertically upwards from Q0, on the right and top by the demand line, and on the bottom by the line extending horizontally to the right from P1.

Rule of one-half

The rule of one-half estimates the change in consumer surplus for small changes in supply with a constant demand curve. Note that in the special case where the consumer demand curve is linear, consumer surplus is the area of the triangle bounded by the vertical line Q = 0, the horizontal line and the linear demand curve. Hence, the change in consumer surplus is the area of the trapezoid with i) height equal to the change in price and ii) mid-segment length equal to the average of the ex-post and ex-ante equilibrium quantities. Following the figure above,

where:

Producer surplus

Producer surplus is the additional benefit that the owners of production factors and product providers bring to producers due to the differences between production, the supply price of the product, and the current market price. The difference between the amount actually obtained in a market transaction and the minimum amount it is willing to accept with the production factors or the products provided.

Calculation of producer surplus

Producer surplus is usually expressed by the area below the market price line and above the supply curve. In Figure 1, the shaded areas below the price line and above the supply curve between production zero and maximum output Q1 indicate producer surplus. Among them, OP1EQ1 below the price line. This indicates that the total revenue is the minimum total payment actually accepted by the manufacturer. The area OPMEQ1 below the S curve is the minimum total revenue that the manufacturer is willing to accept. In Figure 1, the area enclosed by the market price line, the manufacturer's supply line, and the coordinate axis is the producer surplus. Because the rectangle OP1EQ1 is the total revenue actually obtained by the manufacturer, that is, A + B, and the trapezoid OPMEQ. The minimum total profit that the manufacturer is willing to accept, that is, B, so A is the producer surplus.

Producer surplus Producer Surplus graph made by Weiyi.png
Producer surplus

Obviously, the manufacturer produces and sells a certain quantity of Q1 goods at the market price P1. The manufacturer has reduced the quantity of goods for Q1, which means that the manufacturer has increased the production factors or production costs equivalent to the amount of AVC·Q1. However, at the same time, the manufacturer actually obtains a total income equivalent to the total market price P1·Q1. Since AVC is always smaller than P1, from the production and sales of goods in Q1, manufacturers not only get sales revenue equivalent to variable costs, but also get additional revenue. This part of the excess income reflects the increase in the benefits obtained by the manufacturers through market exchange. Therefore, in economics, producer surplus is usually used to measure producer welfare and is an important part of social welfare.

Producer surplus is usually used to measure the economic welfare obtained by the manufacturer in the market supply. When the supply price is constant, the producer welfare depends on the market price. If the manufacturer can sell the product at the highest price, the welfare is the greatest. As part of social welfare, the size of the producer surplus depends on many factors. Generally speaking, when other factors remain constant, an increase in market price will increase producer surplus, and a decrease in supply price or marginal cost will also increase producer surplus. If there is a surplus of goods, that is, people can only sell part of the goods at market prices, and producer surplus will decrease.

Obviously, the sum of the producer surplus of all manufacturers in the market constitutes the producer surplus of the entire market. Graphically, it should be expressed as the area enclosed by the market supply curve, the market price line and the coordinate axis.

See also

Related Research Articles

A duopoly is a type of oligopoly where two firms have dominant or exclusive control over a market, and most of the competition within that market occurs directly between them.

<span class="mw-page-title-main">Microeconomics</span> Behavior of individuals and firms

Microeconomics is a branch of mainstream economics that studies the behavior of individuals and firms in making decisions regarding the allocation of scarce resources and the interactions among these individuals and firms. Microeconomics focuses on the study of individual markets, sectors, or industries as opposed to the national economy as whole, which is studied in macroeconomics.

A monopoly, as described by Irving Fisher, is a market with the "absence of competition", creating a situation where a specific person or enterprise is the only supplier of a particular thing. This contrasts with a monopsony which relates to a single entity's control of a market to purchase a good or service, and with oligopoly and duopoly which consists of a few sellers dominating a market. Monopolies are thus characterised by a lack of economic competition to produce the good or service, a lack of viable substitute goods, and the possibility of a high monopoly price well above the seller's marginal cost that leads to a high monopoly profit. The verb monopolise or monopolize refers to the process by which a company gains the ability to raise prices or exclude competitors. In economics, a monopoly is a single seller. In law, a monopoly is a business entity that has significant market power, that is, the power to charge overly high prices, which is associated with a decrease in social surplus. Although monopolies may be big businesses, size is not a characteristic of a monopoly. A small business may still have the power to raise prices in a small industry.

In economics, specifically general equilibrium theory, a perfect market, also known as an atomistic market, is defined by several idealizing conditions, collectively called perfect competition, or atomistic competition. In theoretical models where conditions of perfect competition hold, it has been demonstrated that a market will reach an equilibrium in which the quantity supplied for every product or service, including labor, equals the quantity demanded at the current price. This equilibrium would be a Pareto optimum.

<span class="mw-page-title-main">Supply and demand</span> Economic model of price determination in a market

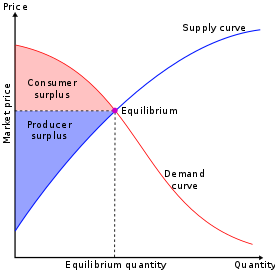
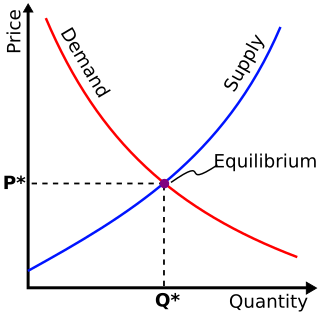
In microeconomics, supply and demand is an economic model of price determination in a market. It postulates that, holding all else equal, in a competitive market, the unit price for a particular good, or other traded item such as labor or liquid financial assets, will vary until it settles at a point where the quantity demanded will equal the quantity supplied, resulting in an economic equilibrium for price and quantity transacted. The concept of supply and demand forms the theoretical basis of modern economics.

Taxes and subsidies change the price of goods and, as a result, the quantity consumed. There is a difference between an ad valorem tax and a specific tax or subsidy in the way it is applied to the price of the good. In the end levying a tax moves the market to a new equilibrium where the price of a good paid by buyers increases and the proportion of the price received by sellers decreases. The incidence of a tax does not depend on whether the buyers or sellers are taxed since taxes levied on sellers are likely to be met by raising the price charged to buyers. Most of the burden of a tax falls on the less elastic side of the market because of a lower ability to respond to the tax by changing the quantity sold or bought. Introduction of a subsidy, on the other hand, may either lowers the price of production which encourages firms to produce more, or lowers the price paid by buyers, encouraging higher sales volume. Such a policy is beneficial both to sellers and buyers.

<span class="mw-page-title-main">Deadweight loss</span> Measure of lost economic efficiency

In economics, deadweight loss is the difference in production and consumption of any given product or service including government tax. The presence of deadweight loss is most commonly identified when the quantity produced relative to the amount consumed differs in regards to the optimal concentration of surplus. This difference in the amount reflects the quantity that is not being utilized or consumed and thus resulting in a loss. This "deadweight loss" is therefore attributed to both producers and consumers because neither one of them benefits from the surplus of the overall production.

<span class="mw-page-title-main">Price discrimination</span> Microeconomic pricing strategy to maximise firm profits

Price discrimination is a microeconomic pricing strategy where identical or largely similar goods or services are sold at different prices by the same provider in different market segments. Price discrimination is distinguished from product differentiation by the more substantial difference in production cost for the differently priced products involved in the latter strategy. Price differentiation essentially relies on the variation in the customers' willingness to pay and in the elasticity of their demand. For price discrimination to succeed, a firm must have market power, such as a dominant market share, product uniqueness, sole pricing power, etc. All prices under price discrimination are higher than the equilibrium price in a perfectly competitive market. However, some prices under price discrimination may be lower than the price charged by a single-price monopolist. Price discrimination is utilised by the monopolist to recapture some deadweight loss. This Pricing strategy enables firms to capture additional consumer surplus and maximize their profits while benefiting some consumers at lower prices. Price discrimination can take many forms and is prevalent in many industries, from education and telecommunications to healthcare.

In economics, elasticity measures the responsiveness of one economic variable to a change in another. If the price elasticity of the demand of something is -2, a 10% increase in price causes the quantity demanded to fall by 20%. Elasticity in economics provides an understanding of changes in the behavior of the buyers and sellers with price changes. There are two types of elasticity for demand and supply, one is inelastic demand and supply and other one is elastic demand and supply.

In economics, economic equilibrium is a situation in which economic forces such as supply and demand are balanced and in the absence of external influences the values of economic variables will not change. For example, in the standard text perfect competition, equilibrium occurs at the point at which quantity demanded and quantity supplied are equal.

<span class="mw-page-title-main">Substitute good</span> Economics concept of goods considered interchangeable

In microeconomics, two goods are substitutes if the products could be used for the same purpose by the consumers. That is, a consumer perceives both goods as similar or comparable, so that having more of one good causes the consumer to desire less of the other good. Contrary to complementary goods and independent goods, substitute goods may replace each other in use due to changing economic conditions. An example of substitute goods is Coca-Cola and Pepsi; the interchangeable aspect of these goods is due to the similarity of the purpose they serve, i.e fulfilling customers' desire for a soft drink. These types of substitutes can be referred to as close substitutes.

Allocative efficiency is a state of the economy in which production is aligned with consumer preferences; in particular, the set of outputs is chosen so as to maximize the wellbeing of society. This is achieved if every good or service is produced up until the last unit provides a marginal benefit to consumers equal to the marginal cost of production.

<span class="mw-page-title-main">Demand curve</span> Graph of how much of something a consumer would buy at a certain price

In a demand schedule, a demand curve is a graph depicting the inverse demand function, a relationship between the price of a certain commodity and the quantity of that commodity that is demanded at that price. Demand curves can be used either for the price-quantity relationship for an individual consumer, or for all consumers in a particular market.

<span class="mw-page-title-main">Price floor</span> Government- or group-imposed price control

A price floor is a government- or group-imposed price control or limit on how low a price can be charged for a product, good, commodity, or service. It is one type of price support; other types include supply regulation and guarantee government purchase price. A price floor must be higher than the equilibrium price in order to be effective. The equilibrium price, commonly called the "market price", is the price where economic forces such as supply and demand are balanced and in the absence of external influences the (equilibrium) values of economic variables will not change, often described as the point at which quantity demanded and quantity supplied are equal. Governments use price floors to keep certain prices from going too low.

<span class="mw-page-title-main">Tax wedge</span>

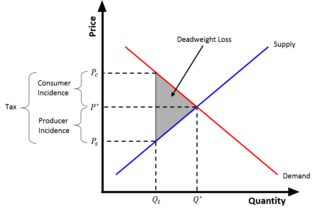
The tax wedge is the deviation from the equilibrium price and quantity as a result of the taxation of a good. Because of the tax, consumers pay more for the good than they did before the tax, and suppliers receive less for the good than they did before the tax. Put differently, the tax wedge is the difference between the price consumers pay and the value producers receive from a transaction. The tax effectively drives a "wedge" between the price consumers pay and the price producers receive for a product.

In economics, tax incidence or tax burden is the effect of a particular tax on the distribution of economic welfare. Economists distinguish between the entities who ultimately bear the tax burden and those on whom the tax is initially imposed. The tax burden measures the true economic effect of the tax, measured by the difference between real incomes or utilities before and after imposing the tax, and taking into account how the tax causes prices to change. For example, if a 10% tax is imposed on sellers of butter, but the market price rises 8% as a result, most of the tax burden is on buyers, not sellers. The concept of tax incidence was initially brought to economists' attention by the French Physiocrats, in particular François Quesnay, who argued that the incidence of all taxation falls ultimately on landowners and is at the expense of land rent. Tax incidence is said to "fall" upon the group that ultimately bears the burden of, or ultimately suffers a loss from, the tax. The key concept of tax incidence is that the tax incidence or tax burden does not depend on where the revenue is collected, but on the price elasticity of demand and price elasticity of supply. As a general policy matter, the tax incidence should not violate the principles of a desirable tax system, especially fairness and transparency. The concept of tax incidence is used in political science and sociology to analyze the level of resources extracted from each income social stratum in order to describe how the tax burden is distributed among social classes. That allows one to derive some inferences about the progressive nature of the tax system, according to principles of vertical equity.

<span class="mw-page-title-main">Supply (economics)</span> Amount of a good that sellers are willing to provide in the market

In economics, supply is the amount of a resource that firms, producers, labourers, providers of financial assets, or other economic agents are willing and able to provide to the marketplace or to an individual. Supply can be in produced goods, labour time, raw materials, or any other scarce or valuable object. Supply is often plotted graphically as a supply curve, with the price per unit on the vertical axis and quantity supplied as a function of price on the horizontal axis. This reversal of the usual position of the dependent variable and the independent variable is an unfortunate but standard convention.

Rental value is the fair market value of property while rented out in a lease. More generally, it may be the consideration paid under the lease for the right to occupy, or the royalties or return received by a lessor (landlord) under a license to real property. In the science and art of appraisal, it is the amount that would be paid for rental of similar real property in the same condition and in the same area.

In economics, an excess supply, economic surplus market surplus or briefly supply is a situation in which the quantity of a good or service supplied is more than the quantity demanded, and the price is above the equilibrium level determined by supply and demand. That is, the quantity of the product that producers wish to sell exceeds the quantity that potential buyers are willing to buy at the prevailing price. It is the opposite of an economic shortage.

This glossary of economics is a list of definitions of terms and concepts used in economics, its sub-disciplines, and related fields.

References

  1. Boulding, Kenneth E. (1945). "The Concept of Economic Surplus". The American Economic Review. 35 (5): 851–869. JSTOR   1812599.
  2. "Consumer and producer surplus|Microeconomics|Khan Academy". Khan Academy.
  3. "Economic efficiency (article)". Khan Academy. Retrieved 2023-07-15.
  4. 1 2 3 Brewer A. (2008) Surplus. In: Palgrave Macmillan (eds) The New Palgrave Dictionary of Economics. Palgrave Macmillan, London. https://doi.org/10.1057/978-1-349-95121-5_2208-1
  5. Petty, William (1899-11-11). "The Economic Writings of Sir William Petty". Cambridge: Cambridge University Press. 2 (98): 30. doi:10.1093/nq/s9-iv.98.409b. hdl: 2027/hvd.li4qq6 . ISSN   1471-6941.
  6. 1 2 3 Slesnick, Daniel T. (2008). "Consumer Surplus". The New Palgrave Dictionary of Economics. pp. 1–7. doi:10.1057/978-1-349-95121-5_626-2. ISBN   978-1-349-95121-5.
  7. "What a Consumer Surplus Tells Us".
  8. Willig, Robert D. (1976). "Consumer's Surplus Without Apology". The American Economic Review. 66 (4): 589–597. ISSN   0002-8282. JSTOR   1806699.

Further reading