Geological structure measurement by LiDAR technology is a remote sensing method applied in structural geology. It enables monitoring and characterisation of rock bodies. [1] This method's typical use is to acquire high resolution structural and deformational data for identifying geological hazards risk, such as assessing rockfall risks or studying pre-earthquake deformation signs.
Geological structures are the results of tectonic deformations, which control landform distribution patterns. These structures include folds, fault planes, size, persistence, spatial variations, and numbers of the rock discontinuities in a particular region. [1] These discontinuity features significantly impact slope stability, causing slope failures or separating a rock mass into intact rock blocks (rockfall). [2] Some displaced blocks along faults are signs of earthquakes.
Conventionally, geotechnical engineers carried out rock discontinuity studies manually. In post geological hazards studies, such as rockfall, the rockfall source areas are dangerous and are difficult to access, severely hindering the ability to carry out detailed structural measurements and volumetric calculations necessary for hazard assessment. [3] By using LiDAR, geological structures can be evaluated remotely, enabling a 3-D investigation of slopes with virtual outcrops.
LiDAR technology (Light Detection and Ranging) is a remote sensing technique that obtains precise 3-D information and distance. [4] The laser receptor calculates the distance by the travelling time between emitting and receiving laser pulses. [4] LiDAR produces topographic maps, and it is useful for assessing the natural environment.
Useful Links |
Related Disciplines |
Portal |
Geological structures are responsible for providing distinct physical properties to rock masses. Discontinuous properties and plate tectonic forces may alter rock masses and their geometries. These structures contain joints, fractures, bedding planes, shear zones, mechanical breaks, or any other features ranging from microscopic (<1 cm, foliation development by metamorphism [5] ) to macroscopic scale (>100m, mid-oceanic ridges). [6]
Geological structures are typically elongated, their orientations are often described as "strike". If a rock body is extensively tilted, taking its slope resistivity into account, it may have a high potential to cause rockfalls. [7] The use of LiDAR in the structural analysis allows measuring landform features from a single outcrop scale to a terrestrial scale. Some geological structures measurement and their importance are listed below:
Rock plane orientations are the natural inclinations that occurred on a rock plane. [8] Some examples of rock planes are bedding planes, fault planes. The planes' orientations are measured by dip and dip direction with a clinometer and compass, where dip represents the maximum inclination of a plane to the horizontal, dip direction is the direction of the intersection line between horizontal and the inclined plane. [9] A stereonet can visualise the distribution of dip and dip directions to analyse the kinematics of a slope. [9]
Kinematics represents the motion of a rock body without external forces that cause them to move. Kinematics analysis concentrates on the possibility of translational failures due to planes sliding. [9]
Faults behaviours can be used to measure the rate of sediment transportation and predict earthquakes. An earthquake can contribute to the formation of faults scraps. One side of a block will be relatively upthrown, causing vertical displacements. Therefore, given the parameters of fault scraps, structural geologists are able to trance the age of it and deduce the time involved to form such features. [10]
Earthquakes are initiated by slow slips. Slips are the displaced blocks along two sides of a fault. However, these slips are undetectable by seismometers (maximum 5mm/day). [11] When the slipping blocks reach a critical rupture velocity, the faults would gradually evolve into a final quake size by linear acceleration along fault planes. [11] The critical displacement of faults is proportional to the initial rupture velocities. [12]
After collecting LiDAR data from pre-earthquake and post-earthquake landforms, by constructing 3-D digital terrain models, the displacement and deformations can be derived. [13] Thus, scientists can predict the final earthquake scale in the future by determining faults and slips' characteristics and areas' size, and short-term earthquake predictions are possible. [14]
When carrying out geological mapping, interpretations through aerial photographs and satellite imagery are often used, but forest vegetation remained the major challenge for mapping. For example, characterising physical landform features at ridges and valleys are somehow complicated, many of these features are forest-covered. The topographic maps are then constructed by obtaining data manually. [15]
LiDAR provides the full-waveform system, it enables the laser pulse to penetrate through canopies and vegetations. [15] This system allows obtaining bare-ground geological data points. Webster et al. have discovered new craters in Northern Canada by harnessing LiDAR data and digital terrain models. A digital terrain model has to be constructed to measure structural parameters (tilt angles, river incision depths). [16] With the precise bedrock and surficial lithology mapping by LiDAR, structural geologists can reconstruct surficial processes involved.
Traditional structural orientations can only be assessed on reachable exposed rock mass manually. Conventionally, engineering geologists investigated rock discontinuities studies with only a limited number at a time. The discontinuities may not represent the whole outcrop. [3] Thus, the traditional rock plane orientation measurement may contain bias.
Geotechnical studies also investigate other geomechanical parameters, such as persistence, block size and rock joint spacing. [8]
LiDAR (Light Detection and Ranging) is a rapid surveying process that emits and receives laser pluses to acquire 3-D information. [3] By illuminating lights with different wavelengths to the object of interest, LiDAR can be used to create precise topographic maps, with applications in: geology, geomorphology, surveying and other applications. [3] Topographic maps are possible because of the Inertial Measuring Unit and Global Positioning System. [3] Furthermore, it is a technology that can carry out studies on a steep slope and rock-cliffs. [4]
Accurately measured data is necessary for the LiDAR data to be geo-referenced such as locating the data in a local or global coordinates system. Therefore, the produced LiDAR can be overlaid onto the aerial photographs collected previously to observe the topography changes over time. [17]
LiDAR system emits pulsed and continuous-wave lasers to acquire 3-D information. The laser scanner is the main component of LiDAR. Lasers with a wavelength of 550-600 nm are used on a ground-based system (handheld laser scanning and terrestrial laser scanning), whereas airborne systems use lasers with 1000-1600 nm wavelength. [18]
Laser calculates the reachable range by the following formula: [18]
LiDAR receives information by discrete and full-waveform return. Full-waveform (multi-return) is often used for forest analysis by Airborne LiDAR, while discrete return (single return) is used by a ground-based laser scanning method. [18] A laser is reflected whenever it reaches any surfaces. The full-waveform return is able to penetrate down into canopies and return vegetation information at different heights. [18] Discrete return can only return the superficial materials. [18] Thus, airborne LiDAR is often used for forestry studies.
LiDAR data is mainly stored in a point cloud format(.las). The captured point cloud data store X, Y Z geometric data. Each data point is obtained from a single laser scan and represents a local geo-referenced spatial datum. [19] It can represent realistic and three-dimensional rock faces in a remote and inaccessible natural terrain. [20]
The LiDAR data have the following parameters:
These data help rock body features analysis, they include recorded geometrical or radiometric information of natural, excavated, or blasted rock slopes.
Previously, the LiDAR data are in the form of the American Standard Code for Information Interchange format(ASCII), [17] which has several problems :
1) Low reading and interpreting speed of ASCII files [17]
2) Useful data loss during data processing [17]
3) ASCII is unstandardised [17]
After 2003, the American Society for Photogrammetry and Remote Sensing (ASPRS) has standardized the LiDAR data in sequential binary laser(.las file) containing LiDAR or other point cloud data records. [17]
Geo-referencing means the co-ordinates on an aerial photograph/digital terrain model can be referenced on a global/regional geographic system. Thus, the users are able to determine and locate every point of collected data on the Earth's surface. [17] The typical global positioning system uses the World Geodetic System of 1984(WGS84) datum, and stores the geo-referenced data in GeoTIFF/GeoPDF format. [22] In addition, the users may require orthometric elevation (elevation above sea-level or geoid model) in different scenarios. For example, analysing sea-level change by hydrological data. [17]
Geo-referencing can be done by adding control points at the base of the slope. [8] By shifting the point cloud data onto the known correct co-ordinates with at least 3 points, the point cloud data can be repositioned into an accurate co-ordinate system. [23] This information is useful for calculating distances, volume and areas.
LiDAR data can be collected on ground-based, airborne and mobile platforms. For example, Airborne LiDAR Scanning (ALS), Unmanned Aerial Vehicles (UAV), Terrestrial Laser Scanning (TLS) and Handheld Laser Scanning (HLS). The tables below will compare the mentioned data collection platforms:
1) The data collection methods
2) Geo-referencing technique (how to acquire the exact coordinate of a point)
3) Advantages and disadvantages
Airborne LiDAR Scanning (ALS) | Unmanned Aerial Vehicle (UAV) | Terrestrial Laser Scanning | Handheld Laser Scanning |
---|---|---|---|
|
|
|
|
LiDAR scanning methods | Data collection methods | Geo-referencing technique | Advantages | Disadvantages |
---|---|---|---|---|
Airborne LiDAR Scanning (ALS) |
|
|
| |
Unmanned Aerial Vehicle (UAV) |
|
| ||
Terrestrial Laser Scanning (TLS) |
|
| ||
Handheld Laser Scanning (HLS) |
|
A digital terrain model (DTM) is a mathematical model that represents Earth's visible terrain surfaces. [35] A DTM transforms discernible LiDAR data points into a continuous 3-D surface, the model connects discrete points with distinct height values to form planes. Thus, structural geologists are able to derive structural orientations from these 3-D planes. This modelling technique is also used to create digital planetary surfaces and there are more other applications. [35]
The DTMs are classified by the basic geometric units, such as triangles, squares. 3 major mathematic functions are used, as listed below :
Moreover, triangle-based and grid-based are the most used.
Point-based surface modelling reconstructs a surface by forming a series of small contiguous discontinuous surfaces. Each of the surfaces is planar and formed by connecting the individual data point. [25] This function can form a surface with regular and irregular patterns by considering the regional boundaries of influence of each point, where a Voronoi diagram defines the regional boundaries. However, regular patterns are most widely used for simpler computations, such as hexagons, squared patterns. [25]
The mathematical expression of the formation for each horizontal planar-surface is: [16]
where Z is the height of the planar surface, and H is the ith point's height.
A triangular-based function can form a more tilted or irregular digital surface model. This approach is treated as the primary way to construct a complex DTM. Triangles have great flexibility, any polygons (e.g. a square, rectangle) can be decomposed into other smaller triangles. [20] A linked triangular network can incorporate break lines for plane fitting, it facilitates the formation of a curved facet/surface. [35] The minimum requirement for forming a triangle requires 3 data points, where the nearest 3 points are grouped to form a triangle by Delaunay triangulation without overlapping. [36]
As the data points are unevenly distributed, the triangular-based method effectively constructs DTM because this method can create surface variations. Even some data points of the point cloud are removed or added, a local triangle can be reformed without complete DTM reconstruction. [36]
A few parameters control the surface formation process:
1) Density of Mesh
2) Maximum angle of neighbouring triangles
3) Minimum Patch size
The grid-based model has less relevance for constructing broken terrain or sharp terrain discontinuities with steep slopes. [35] 4 data points are the minimum requirement for forming a grid-based model. [4] The resulting surface is named a bi-linear surface that quadrilaterals of any shapes are linked to create a DTM, such as parallelograms, squares, rectangles or other irregular polygons. [29] This method has the advantage of data handling that the data is in the form of squared grids, evenly distributing data points. In this case, some software has provided a "Random-to-Grid" operation to ensure that the data has the grid form. [36]
As the data collected are in the form of a point cloud, there is a need to transform these 3-D co-ordinates of laser points into a digital terrain model with 2 major procedures:
1) Point cloud classification and ground filtering
2) Reconstruction of the ground surface from discrete laser point cloud data by interpolation.
Data classification and noise cleaning are the processes of obtaining a non-biased slope surface. When ALS collects the with multiple returns, this principle can classify the objects into different categories. Classification algorithms can be performed by TerraScan & TerraModel, computer software for classifying point cloud data automatically developed by TerraSolid. [37] However, some manual adjustments and validations are needed to ensure the data points are classified correctly.
Algorithms can identify pre-dominate landform features, these algorithms assume the surfaces with significant variations are non-ground features. [29] For creating a surface model of rock slope, only classified ground data is needed. The classifications of the ground and non-ground surfaces are in the following categories:
Classifications | Examples |
---|---|
Flat, ground or open terrain | Open terrain, sand, rock, flat rooftops, golf courses [25] |
Low-vegetation area | Tall crops and weeds <2m [25] |
Medium-vegetation area | Low trees or brushlands between 2 and 10m [25] |
High-vegetation area | Forested areas >10m [25] |
Data filtering enables the extraction of bare-Earth's surface by removing unnecessary data or data noise. [25] For rock orientation studies, outcrop mapping and topographical studies, they only acquire information about the rock slope bodies. Thus, data filtering is implemented to separate the point clouds as ground and non-ground features. Bugs, vegetations or other artificial infrastructures belong to non-ground features. [38]
In order to filter 3-D laser points, few methods from open source software can be applied to filter ground points out of the whole area of interests :
Author | Technique | Description of the method | Accuracy |
---|---|---|---|
Axelsson et al., 2000 [39] | Triangular-irregular network (TIN) | Multiple points are divided into grids. The lower elevation within each grid is treated as ground points. Users can set the grid size on their own. The points are added into a triangle facet when they are close enough. | Satisfactory |
Zeybek, 2019 | Cloth-simulation method | A simulated cloth is put on the up-side-down point cloud, points are not filtered when the cloth can touch the data points. The softer the cloth, the more intersection points can be preserved. The intersected points are then classified as a ground. [32] | 93% |
Surface-based | This method uses a linear algorithm to remove the non-ground points [32] | 81% | |
Curvature based | Fitting is applied to the nearest neighbour, the points with large elevation variations(Z component) are filtered out. [32] | 88% |
The purpose of the ground verification survey is to test the accuracy of LiDAR. LiDAR data is acquired by sending laser pulses at different angles or receiving the returning signal, these signals may include some error induced by atmosphere absorption of wavelength. [40] Therefore, a ground-truth survey is needed to ensure the collected data's co-ordinates match the local coordinate system. For example, horizontal accuracy will be tested by comparing the collected data through different data collection techniques. Also, data can be corrected by setting multiple control points with known coordinates. [41]
The DTMs are capable of identifying the structural parameters of geological features(tilt angle of a fold limb). For example, dip and dip directions of rock planes can be derived from DTM. The general methodology has the following steps:
1) Obtain LiDAR data of a targeted slope [26]
2) Noise cleaning and filtering of point data [26]
3) Transform point data into DTM through mathematical functions [8]
4) By using programs, such as Coltop 3D, the structural geometry of the joint/slope planes can be calculated automatically. [8]
5) The rock planes are determined by color-coding or statistical method for evaluating whether the points are grouped to form a single or different planes. [8] [26]
6) Output the structural orientations data into suitable computer software files, and plotting the distribution of dip and dip directions of different planes on a stereonet. [8] [26]
Data partitioning helps redistribute the unevenly distributed point data by dividing data into cubes. Returned point cloud data has different point density, due to the variation of data collection devices and parameters. The point cloud's density determines the cube size, no fewer than 4 points form each cube. [42] The points that are considered as non-conformers will be removed from the point cloud. [42] Afterwards, the normal vector of each cube will be calculated.
Octree Partitioning in open source softwares, including CloudCompare and Geomagic, can achieve data partitioning. [42] Considering the rock masses in different terrains, they have variations in the roughness. Thus, it is necessary for users to set the cube size manually to obtain the best cube. The average number of points in each cube ranges from 15 to 30 points, by setting the range of the point spacing between 4mm and 7mm. [42]
The purpose of rock discontinuities clustering is to group sub-planes of a slope into the same discontinuity set they belong to. The discontinuities demonstrate waviness, roughness or an undulating surface. [42] The points within the same joint set show similar orientation habits. [42] The algorithm determines whether the points are located within the main orientation of bedding planes or sub-parallel planes with each other. [43] The clustering technique can classify different joint sets based on assigned normal vectors on each face within approximately the same orientation. [43]
Although LiDAR has high efficiency in collecting data in a large area within a short time, some issues remain challenging for the overall data processing and generating the expected result.
Vegetation may not be entirely removed during data filtering. It may affect the smoothness and the clustering of rock surfaces. In most cases, 3-D models are generated through the triangulation method, spikes are often formed. [18] The spikes may affect the clustering of rock surfaces. They affect the smoothness of the 3-D surface, inducing errors in calculating the rock plane orientations. Spikes are formed when the data points have similar X and Y coordinates but very different Z coordinates, the needle-like shape triangles are produced as a result of non-smooth surfaces. [44]
The filtering parameters for surface clustering often depend on users' past experiences. For example, the octree parameter can be adjusted with different point densities. [17] The result of DTM formation has to be determined by users. Hence, a repeated testing procedure is needed for generating a satisfactory surface. [25]
Point cloud density, known as the spacing between each data point in an obtained LiDAR datasets. [44] This parameter affects the accuracy in measuring rock slopes. It is one of the characteristics that need to be considered during data processing. For example, data filtering, classification, feature extraction and object recognition. [33] Point cloud density depends on various factors:
Although LiDAR has been an effective data acquisition method on a rock slope, its high cost caused the technique to be not practical. [46] When the area of interest is of a very small scale, it limits the usability of TLS & ALS, given carrying out an ALS survey requires aircraft, an experienced pilot, a designed flying path and height that got the approval of the local aviation department. [28]
By employing UAV, the problem mentioned above can be resolved. It can collect data in inaccessible areas that enable data collection at a low cost at a small scale, since the device is portable and lightweight. [32]
With the high accuracy and high-efficiency data acquisition method of laser scanning, it can potentially apply to different areas other than structural measurements:
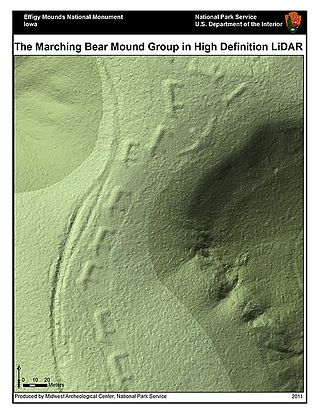
Lidar is a method for determining ranges by targeting an object or a surface with a laser and measuring the time for the reflected light to return to the receiver. Lidar may operate in a fixed direction or it may scan multiple directions, in which case it is known as lidar scanning or 3D laser scanning, a special combination of 3-D scanning and laser scanning. Lidar has terrestrial, airborne, and mobile applications.
A digital elevation model (DEM) or digital surface model (DSM) is a 3D computer graphics representation of elevation data to represent terrain or overlaying objects, commonly of a planet, moon, or asteroid. A "global DEM" refers to a discrete global grid. DEMs are used often in geographic information systems (GIS), and are the most common basis for digitally produced relief maps. A digital terrain model (DTM) represents specifically the ground surface while DEM and DSM may represent tree top canopy or building roofs.
A point cloud is a discrete set of data points in space. The points may represent a 3D shape or object. Each point position has its set of Cartesian coordinates. Point clouds are generally produced by 3D scanners or by photogrammetry software, which measure many points on the external surfaces of objects around them. As the output of 3D scanning processes, point clouds are used for many purposes, including to create 3D computer-aided design (CAD) or geographic information systems (GIS) models for manufactured parts, for metrology and quality inspection, and for a multitude of visualizing, animating, rendering, and mass customization applications.
In geology, a fault is a planar fracture or discontinuity in a volume of rock across which there has been significant displacement as a result of rock-mass movements. Large faults within Earth's crust result from the action of plate tectonic forces, with the largest forming the boundaries between the plates, such as the megathrust faults of subduction zones or transform faults. Energy release associated with rapid movement on active faults is the cause of most earthquakes. Faults may also displace slowly, by aseismic creep.
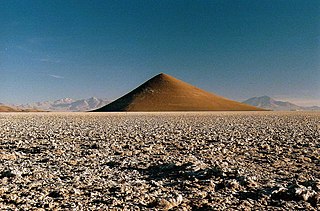
A landform is a natural or anthropogenic land feature on the solid surface of the Earth or other planetary body. Landforms together make up a given terrain, and their arrangement in the landscape is known as topography. Landforms include hills, mountains, canyons, and valleys, as well as shoreline features such as bays, peninsulas, and seas, including submerged features such as mid-ocean ridges, volcanoes, and the great ocean basins.
Photogrammetry is the science and technology of obtaining reliable information about physical objects and the environment through the process of recording, measuring and interpreting photographic images and patterns of electromagnetic radiant imagery and other phenomena.
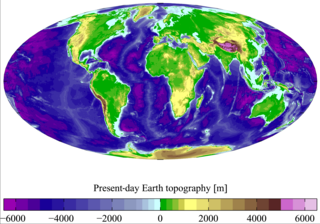
Terrain or relief involves the vertical and horizontal dimensions of land surface. The term bathymetry is used to describe underwater relief, while hypsometry studies terrain relative to sea level. The Latin word terra means "earth."
Bathymetry is the study of underwater depth of ocean floors, lake floors, or river floors. In other words, bathymetry is the underwater equivalent to hypsometry or topography. The first recorded evidence of water depth measurements are from Ancient Egypt over 3000 years ago. Bathymetric charts, are typically produced to support safety of surface or sub-surface navigation, and usually show seafloor relief or terrain as contour lines and selected depths (soundings), and typically also provide surface navigational information. Bathymetric maps may also use a Digital Terrain Model and artificial illumination techniques to illustrate the depths being portrayed. The global bathymetry is sometimes combined with topography data to yield a global relief model. Paleobathymetry is the study of past underwater depths.
Slope stability refers to the condition of inclined soil or rock slopes to withstand or undergo movement; the opposite condition is called slope instability or slope failure. The stability condition of slopes is a subject of study and research in soil mechanics, geotechnical engineering and engineering geology. Analyses are generally aimed at understanding the causes of an occurred slope failure, or the factors that can potentially trigger a slope movement, resulting in a landslide, as well as at preventing the initiation of such movement, slowing it down or arresting it through mitigation countermeasures.
Surface roughness can be regarded as the quality of a surface of not being smooth and it is hence linked to human (haptic) perception of the surface texture. From a mathematical perspective it is related to the spatial variability structure of surfaces, and inherently it is a multiscale property. It has different interpretations and definitions depending on the disciplines considered.
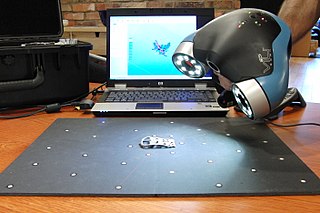
3D scanning is the process of analyzing a real-world object or environment to collect three dimensional data of its shape and possibly its appearance. The collected data can then be used to construct digital 3D models.
Structure from motion (SfM) is a photogrammetric range imaging technique for estimating three-dimensional structures from two-dimensional image sequences that may be coupled with local motion signals. It is studied in the fields of computer vision and visual perception.
Slope mass rating (SMR) is a rock mass classification scheme developed by Manuel Romana to describe the strength of an individual rock outcrop or slope. The system is founded upon the more widely used RMR scheme, which is modified with quantitative guidelines to the rate the influence of adverse joint orientations.
Slope stability analysis is a static or dynamic, analytical or empirical method to evaluate the stability of slopes of soil- and rock-fill dams, embankments, excavated slopes, and natural slopes in soil and rock. It is performed to assess the safe design of a human-made or natural slopes and the equilibrium conditions. Slope stability is the resistance of inclined surface to failure by sliding or collapsing. The main objectives of slope stability analysis are finding endangered areas, investigation of potential failure mechanisms, determination of the slope sensitivity to different triggering mechanisms, designing of optimal slopes with regard to safety, reliability and economics, and designing possible remedial measures, e.g. barriers and stabilization.
A digital outcrop model (DOM), also called a virtual outcrop model, is a digital 3D representation of the outcrop surface, mostly in a form of textured polygon mesh.
There are a number of different specialized magnetic compasses used by geologists to measure orientation of geological structures, as they map in the field, to analyze and document the geometry of bedding planes, joints, and/or metamorphic foliations and lineations. In this aspect the most common device used to date is the analogue compass.
CloudCompare is a 3D point cloud processing software. It can also handle triangular meshes and calibrated images.
Tree height is the vertical distance between the base of the tree and the tip of the highest branch on the tree, and is difficult to measure accurately. It is not the same as the length of the trunk. If a tree is leaning, the trunk length may be greater than the height of the tree. The base of the tree is where the projection of the pith (center) of the tree intersects the existing supporting surface upon which the tree is growing or where the seed sprouted. If the tree is growing on the side of a cliff, the base of the tree is at the point where the pith would intersect the cliff side. Roots extending down from that point would not add to the height of the tree. On a slope this base point is considered as halfway between the ground level at the upper and lower sides of the tree. Tree height can be measured in a number of ways with varying degrees of accuracy.
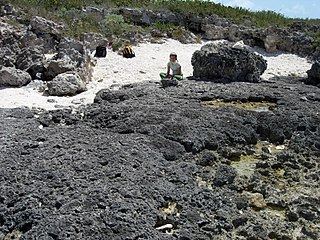
In geology and geomorphology, an erosion surface is a surface of rock or regolith that was formed by erosion and not by construction nor fault displacement. Erosional surfaces within the stratigraphic record are known as unconformities, but not all unconformities are buried erosion surfaces. Erosion surfaces vary in scale and can be formed on a mountain range or a rock. Particularly large and flat erosion surfaces receive the names of peneplain, paleoplain, planation surface or pediplain. An example of erosion surface is road surface erosion which is caused by natural and anthropogenic factors. Erosion surface can be measured through direct, contact measurement methods and indirect, non-contact measurement methods.
Global Ecosystem Dynamics Investigation (GEDI, pronounced ) is a NASA mission to measure how deforestation has contributed to atmospheric CO2 concentrations. A full-waveform LIDAR was attached to the International Space Station to provide the first global, high-resolution observations of forest vertical structure. This will allow scientists to map habitats and biomass, particularly in the tropics, providing detail on the Earth's carbon cycle.
{{cite book}}
: |last=
has generic name (help){{cite book}}
: CS1 maint: multiple names: authors list (link){{cite thesis}}
: CS1 maint: DOI inactive as of April 2024 (link) CS1 maint: multiple names: authors list (link)For more detailed description of the concepts, some links are provided below: