Growth accounting

Last updated

Growth accounting is a procedure used in economics to measure the contribution of different factors to economic growth and to indirectly compute the rate of technological progress, measured as a residual, in an economy. [1] Growth accounting decomposes the growth rate of an economy's total output into that which is due to increases in the contributing amount of the factors used—usually the increase in the amount of capital and labor—and that which cannot be accounted for by observable changes in factor utilization. The unexplained part of growth in GDP is then taken to represent increases in productivity (getting more output with the same amounts of inputs) or a measure of broadly defined technological progress.

Contents

The technique has been applied to virtually every economy in the world and a common finding is that observed levels of economic growth cannot be explained simply by changes in the stock of capital in the economy or population and labor force growth rates. Hence, technological progress plays a key role in the economic growth of nations, or the lack of it.

History

This methodology was introduced by Robert Solow and Trevor Swan in 1957. [2] [3] Growth accounting was proposed for management accounting in the 1980s. [4] [5] but they did not gain on as management tools. The reason is clear. The production functions are understood and formulated differently in growth accounting and management accounting. In growth accounting the production function is formulated as a function OUTPUT=F (INPUT), which formulation leads to maximize the average productivity ratio OUTPUT/INPUT. Average productivity has never been accepted in management accounting (in business) as a performance criterion or an objective to be maximized because it would mean the end of the profitable business. Instead the production function is formulated as a function INCOME=F(OUTPUT-INPUT) which is to be maximized. The name of the game is to maximize income, not to maximize productivity or production. [6] :6

Abstract example

Decomposing increase in output into that due to technology and that due to increase in capital (click to enlarge) Growth accounting.JPG
Decomposing increase in output into that due to technology and that due to increase in capital (click to enlarge)

The growth accounting model is normally expressed in the form of the exponential growth function. As an abstract example consider an economy whose total output (GDP) grows at 3% per year. Over the same period its capital stock grows at 6% per year and its labor force by 1%. The contribution of the growth rate of capital to output is equal to that growth rate weighted by the share of capital in total output and the contribution of labor is given by the growth rate of labor weighted by labor's share in income. If capital's share in output is 13, then labor's share is 23 (assuming these are the only two factors of production). This means that the portion of growth in output which is due to changes in factors is .06×(13)+.01×(23)=.027 or 2.7%. This means that there is still 0.3% of the growth in output that cannot be accounted for. This remainder is the increase in the productivity of factors that happened over the period, or the measure of technological progress during this time.

Specific example

Growth accounting can also be expressed in the form of the arithmetical model, which is used here because it is more descriptive and understandable. The principle of the accounting model is simple. The weighted growth rates of inputs (factors of production) are subtracted from the weighted growth rates of outputs. Because the accounting result is obtained by subtracting it is often called a "residual". The residual is often defined as the growth rate of output not explained by the share-weighted growth rates of the inputs. [7] :6

We can use the real process data of the production model in order to show the logic of the growth accounting model and identify possible differences in relation to the productivity model. When the production data is the same in the model comparison the differences in the accounting results are only due to accounting models. We get the following growth accounting from the production data.

Growth accounting model calculation GA model.png
Growth accounting model calculation

The growth accounting procedure proceeds as follows. First is calculated the growth rates for the output and the inputs by dividing the Period 2 numbers with the Period 1 numbers. Then the weights of inputs are computed as input shares of the total input (Period 1). Weighted growth rates (WG) are obtained by weighting growth rates with the weights. The accounting result is obtained by subtracting the weighted growth rates of the inputs from the growth rate of the output. In this case the accounting result is 0.015 which implies a productivity growth by 1.5%.

We note that the productivity model reports a 1.4% productivity growth from the same production data. The difference (1.4% versus 1.5%) is caused by the different production volume used in the models. In the productivity model the input volume is used as a production volume measure giving the growth rate 1.063. In this case productivity is defined as follows: output volume per one unit of input volume. In the growth accounting model the output volume is used as a production volume measure giving the growth rate 1.078. In this case productivity is defined as follows: input consumption per one unit of output volume. The case can be verified easily with the aid of productivity model using output as a production volume.

The accounting result of the growth accounting model is expressed as an index number, in this example 1.015, which depicts the average productivity change. As demonstrated above we cannot draw correct conclusions based on average productivity numbers. This is due to the fact that productivity is accounted as an independent variable separated from the entity it belongs to, i.e. real income formation. Hence, if we compare in a practical situation two growth accounting results of the same production process we do not know which one is better in terms of production performance. We have to know separately income effects of productivity change and production volume change or their combined income effect in order to understand which one result is better and how much better.

This kind of scientific mistake of wrong analysis level has been recognized and described long ago. [8] Vygotsky cautions against the risk of separating the issue under review from the total environment, the entity of which the issue is an essential part. By studying only this isolated issue we are likely to end up with incorrect conclusions. A second practical example illustrates this warning. Let us assume we are studying the properties of water in putting out a fire. If we focus the review on small components of the whole, in this case the elements oxygen and hydrogen, we come to the conclusion that hydrogen is an explosive gas and oxygen is a catalyst in combustion. Therefore, their compound water could be explosive and unsuitable for putting out a fire. This incorrect conclusion arises from the fact that the components have been separated from the entity. [9] :10

Technical derivation

The total output of an economy is modeled as being produced by various factors of production, with capital and labor being the primary ones in modern economies (although land and natural resources can also be included). This is usually captured by an aggregate production function: [10]

where Y is total output, K is the stock of capital in the economy, L is the labor force (or population) and A is a "catch all" factor for technology, role of institutions and other relevant forces which measures how productively capital and labor are used in production.

Standard assumptions on the form of the function F(.) is that it is increasing in K, L, A (if you increase productivity or you increase the number of factors used you get more output) and that it is homogeneous of degree one, or in other words that there are constant returns to scale (which means that if you double both K and L you get double the output). The assumption of constant returns to scale facilitates the assumption of perfect competition which in turn implies that factors get their marginal products:

where MPK denotes the extra units of output produced with an additional unit of capital and similarly, for MPL. Wages paid to labor are denoted by w and the rate of profit or the real interest rate is denoted by r. Note that the assumption of perfect competition enables us to take prices as given. For simplicity we assume unit price (i.e. P =1), and thus quantities also represent values in all equations.

If we totally differentiate the above production function we get;

where denotes the partial derivative with respect to factor i, or for the case of capital and labor, the marginal products. With perfect competition this equation becomes:

If we divide through by Y and convert each change into growth rates we get:

or denoting a growth rate (percentage change over time) of a factor as we get:

Then is the share of total income that goes to capital, which can be denoted as and is the share of total income that goes to labor, denoted by . This allows us to express the above equation as:

In principle the terms , , and are all observable and can be measured using standard national income accounting methods (with capital stock being measured using investment rates via the perpetual inventory method). The term however is not directly observable as it captures technological growth and improvement in productivity that are unrelated to changes in use of factors. This term is usually referred to as Solow residual or Total factor productivity growth. Slightly rearranging the previous equation we can measure this as that portion of increase in total output which is not due to the (weighted) growth of factor inputs:

Another way to express the same idea is in per capita (or per worker) terms in which we subtract off the growth rate of labor force from both sides:

which states that the rate of technological growth is that part of the growth rate of per capita income which is not due to the (weighted) growth rate of capital per person.

See also

Related Research Articles

Capital intensity is the amount of fixed or real capital present in relation to other factors of production, especially labor. At the level of either a production process or the aggregate economy, it may be estimated by the capital to labor ratio, such as from the points along a capital/labor isoquant. The inverse of capital intensity is labor intensity. Capital intensity is sometimes associated with industrialism, while labor intensity is sometimes associated with agrarianism.

<span class="mw-page-title-main">Cobb–Douglas production function</span> Macroeconomic formula that describes productivity

In economics and econometrics, the Cobb–Douglas production function is a particular functional form of the production function, widely used to represent the technological relationship between the amounts of two or more inputs and the amount of output that can be produced by those inputs. The Cobb–Douglas form was developed and tested against statistical evidence by Charles Cobb and Paul Douglas between 1927 and 1947; according to Douglas, the functional form itself was developed earlier by Philip Wicksteed.

<span class="mw-page-title-main">Endogenous growth theory</span> Economic theory

Endogenous growth theory holds that economic growth is primarily the result of endogenous and not external forces. Endogenous growth theory holds that investment in human capital, innovation, and knowledge are significant contributors to economic growth. The theory also focuses on positive externalities and spillover effects of a knowledge-based economy which will lead to economic development. The endogenous growth theory primarily holds that the long run growth rate of an economy depends on policy measures. For example, subsidies for research and development or education increase the growth rate in some endogenous growth models by increasing the incentive for innovation.

<span class="mw-page-title-main">Production function</span> Used to define marginal product and to distinguish allocative efficiency

In economics, a production function gives the technological relation between quantities of physical inputs and quantities of output of goods. The production function is one of the key concepts of mainstream neoclassical theories, used to define marginal product and to distinguish allocative efficiency, a key focus of economics. One important purpose of the production function is to address allocative efficiency in the use of factor inputs in production and the resulting distribution of income to those factors, while abstracting away from the technological problems of achieving technical efficiency, as an engineer or professional manager might understand it.

Productivity is the efficiency of production of goods or services expressed by some measure. Measurements of productivity are often expressed as a ratio of an aggregate output to a single input or an aggregate input used in a production process, i.e. output per unit of input, typically over a specific period of time. The most common example is the (aggregate) labour productivity measure, one example of which is GDP per worker. There are many different definitions of productivity and the choice among them depends on the purpose of the productivity measurement and data availability. The key source of difference between various productivity measures is also usually related to how the outputs and the inputs are aggregated to obtain such a ratio-type measure of productivity.

<span class="mw-page-title-main">Marginal product</span> Change in output resulting from employing one more unit of a particular input

In economics and in particular neoclassical economics, the marginal product or marginal physical productivity of an input is the change in output resulting from employing one more unit of a particular input, assuming that the quantities of other inputs are kept constant.

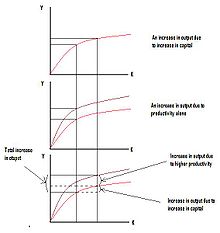
The Solow residual is a number describing empirical productivity growth in an economy from year to year and decade to decade. Robert Solow, the Nobel Memorial Prize in Economic Sciences-winning economist, defined rising productivity as rising output with constant capital and labor input. It is a "residual" because it is the part of growth that is not accounted for by measures of capital accumulation or increased labor input. Increased physical throughput – i.e. environmental resources – is specifically excluded from the calculation; thus some portion of the residual can be ascribed to increased physical throughput. The example used is for the intracapital substitution of aluminium fixtures for steel during which the inputs do not alter. This differs in almost every other economic circumstance in which there are many other variables. The Solow residual is procyclical and measures of it are now called the rate of growth of multifactor productivity or total factor productivity, though Solow (1957) did not use these terms.

In economics, total-factor productivity (TFP), also called multi-factor productivity, is usually measured as the ratio of aggregate output to aggregate inputs. Under some simplifying assumptions about the production technology, growth in TFP becomes the portion of growth in output not explained by growth in traditionally measured inputs of labour and capital used in production. TFP is calculated by dividing output by the weighted geometric average of labour and capital input, with the standard weighting of 0.7 for labour and 0.3 for capital. Total factor productivity is a measure of productive efficiency in that it measures how much output can be produced from a certain amount of inputs. It accounts for part of the differences in cross-country per-capita income. For relatively small percentage changes, the rate of TFP growth can be estimated by subtracting growth rates of labor and capital inputs from the growth rate of output.

The Solow–Swan model or exogenous growth model is an economic model of long-run economic growth. It attempts to explain long-run economic growth by looking at capital accumulation, labor or population growth, and increases in productivity largely driven by technological progress. At its core, it is an aggregate production function, often specified to be of Cobb–Douglas type, which enables the model "to make contact with microeconomics". The model was developed independently by Robert Solow and Trevor Swan in 1956, and superseded the Keynesian Harrod–Domar model.

The Harrod–Domar model is a Keynesian model of economic growth. It is used in development economics to explain an economy's growth rate in terms of the level of saving and of capital. It suggests that there is no natural reason for an economy to have balanced growth. The model was developed independently by Roy F. Harrod in 1939, and Evsey Domar in 1946, although a similar model had been proposed by Gustav Cassel in 1924. The Harrod–Domar model was the precursor to the exogenous growth model.

In economics, the Golden Rule savings rate is the rate of savings which maximizes steady state level of the growth of consumption, as for example in the Solow–Swan model. Although the concept can be found earlier in the work of John von Neumann and Maurice Allais, the term is generally attributed to Edmund Phelps who wrote in 1961 that the golden rule "do unto others as you would have them do unto you" could be applied inter-generationally inside the model to arrive at some form of "optimum", or put simply "do unto future generations as we hope previous generations did unto us."

Constant elasticity of substitution (CES), in economics, is a property of some production functions and utility functions. Several economists have featured in the topic and have contributed in the final finding of the constant. They include Tom McKenzie, John Hicks and Joan Robinson. The vital economic element of the measure is that it provided the producer a clear picture of how to move between different modes or types of production.

In macroeconomics, factor shares are the share of production given to the factors of production, usually capital and labor. This concept uses the methods and fits into the framework of neoclassical economics.

<span class="mw-page-title-main">Luigi Pasinetti</span> Italian economist (1930–2023)

Luigi L. Pasinetti was an Italian economist of the post-Keynesian school. Pasinetti was considered the heir of the "Cambridge Keynesians" and a student of Piero Sraffa and Richard Kahn. Along with them, as well as Joan Robinson, he was one of the prominent members on the "Cambridge, UK" side of the Cambridge capital controversy. His contributions to economics include developing the analytical foundations of neo-Ricardian economics, including the theory of value and distribution, as well as work in the line of Kaldorian theory of growth and income distribution. He also developed the theory of structural change and economic growth, structural economic dynamics and uneven sectoral development.

The AK model of economic growth is an endogenous growth model used in the theory of economic growth, a subfield of modern macroeconomics. In the 1980s it became progressively clearer that the standard neoclassical exogenous growth models were theoretically unsatisfactory as tools to explore long run growth, as these models predicted economies without technological change and thus they would eventually converge to a steady state, with zero per capita growth. A fundamental reason for this is the diminishing return of capital; the key property of AK endogenous-growth model is the absence of diminishing returns to capital. In lieu of the diminishing returns of capital implied by the usual parameterizations of a Cobb–Douglas production function, the AK model uses a linear model where output is a linear function of capital. Its appearance in most textbooks is to introduce endogenous growth theory.

In the technological theory of social production, the growth of output, measured in money units, is related to achievements in technological consumption of labour and energy. This theory is based on concepts of classical political economy and neo-classical economics and appears to be a generalisation of the known economic models, such as the neo-classical model of economic growth and input-output model.

The Cambridge capital controversy, sometimes called "the capital controversy" or "the two Cambridges debate", was a dispute between proponents of two differing theoretical and mathematical positions in economics that started in the 1950s and lasted well into the 1960s. The debate concerned the nature and role of capital goods and a critique of the neoclassical vision of aggregate production and distribution. The name arises from the location of the principals involved in the controversy: the debate was largely between economists such as Joan Robinson and Piero Sraffa at the University of Cambridge in England and economists such as Paul Samuelson and Robert Solow at the Massachusetts Institute of Technology, in Cambridge, Massachusetts, United States.

Economic dynamics is an empirical science that studies emergences, motion and disappearance of value—a specific concept that is used for description of the processes of creation and distribution of wealth. Any economic theory deals with the interpretation of economic processes based on the law of production of value, and various scientific approaches differ in the choice of factors of production that determine, in the end, the creation of wealth. Marxists insist that only labor creates value, neoclassicists believe that, in addition to labor, capital must also be taken into account as the important source of value. Econodynamics demonstrates, and this is an achievement of V.N. Pokrovskii, that the obseved substitution of labour be capital is, in fact, the substitution of labour by work of external energy souses, and the statement about the productive power of capital is a hoax that hides the real role of labor and energy in the production of value. Econodynamics offers a more adequate interpretation of economic growth and other phenomena. Econodynamics is based on the achievements of classical political economy and neo-classical economics and has been using the methods of phenomenological science to investigate evolution of economic system. Econodynamics has been proposing methods of analysis and forecasting of economic processes. The comprehensive review of the problems of econodynamics is given recently by Vladimir Pokrovskii.

Uzawa's theorem, also known as the steady state growth theorem, is a theorem in economic growth theory concerning the form that technological change can take in the Solow–Swan and Ramsey–Cass–Koopmans growth models. It was first proved by Japanese economist Hirofumi Uzawa.

References

  1. Sickles, R., & Zelenyuk, V. (2019). Measurement of Productivity and Efficiency: Theory and Practice. Cambridge: Cambridge University Press. doi : 10.1017/9781139565981
  2. Solow, Robert (1957). "Technical change and the aggregate production function". Review of Economics and Statistics . 39 (3): 312–320. doi:10.2307/1926047. JSTOR   1926047.
  3. Spencer, Barbara (2008). "Trevor Swan And The Neoclassical Growth Model". History of Political Economy . 42.
  4. Loggerenberg van, B.; Cucchiaro, S. (1982). "Productivity Measurement and the Bottom Line". National Productivity Review. 1 (1): 87–99. doi:10.1002/npr.4040010111.
  5. Bechler, J.G (1984). "The Productivity Management Process". American Productivity Center.{{cite journal}}: Cite journal requires |journal= (help)
  6. Kohli, U (2012). Productivity: National vs. Domestic (PDF). Sydney, Australia: EMG Workshop, University of New South Wales, November 21–23, 2012.
  7. Hulten, C.R. (September 2009). "Growth Accounting" (PDF). NATIONAL BUREAU OF ECONOMIC RESEARCH. doi: 10.3386/w15341 .{{cite journal}}: Cite journal requires |journal= (help)
  8. Vygotsky, L. (1962). Thought and Language . MIT Press (original work 1934).
  9. Saari, S. (2011). Production and Productivity as Sources of Well-being. MIDO OY. p. 25.
  10. Zelenyuk (2014). "Testing Significance of Contributions in Growth Accounting, with Application to Testing ICT Impact on Labor Productivity of Developed Countries". International Journal of Business and Economics. 13 (2): 115–126.