Nkangala District Municipality UMasipala weSiyingi seKangala | |
|---|---|
 Seal | |
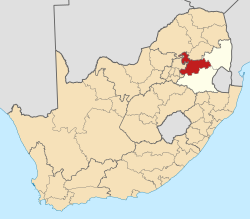 Location in South Africa | |
| Coordinates: 25°45′S29°25′E / 25.750°S 29.417°E | |
| Country | South Africa |
| Province | Mpumalanga |
| Seat | Middelburg |
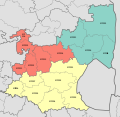
| Local municipalities | |
| Government | |
| • Type | Municipal council |
| • Mayor | Speedy Mashilo (ANC) |
| Area | |
• Total | 16,758 km2 (6,470 sq mi) |
| Population (2011) [2] | |
• Total | 1,308,129 |
| • Density | 78.060/km2 (202.17/sq mi) |
| Racial makeup (2011) | |
| • Black African | 87.9% |
| • Coloured | 1.1% |
| • Indian/Asian | 0.7% |
| • White | 9.9% |
| First languages (2011) | |
| • Southern Ndebele | 28.4% |
| • Zulu | 23.1% |
| • Northern Sotho | 14.7% |
| • Afrikaans | 10.0% |
| • Other | 23.8% |
| Time zone | UTC+2 (SAST) |
| Municipal code | DC31 |
Nkangala is one of the 3 districts of Mpumalanga province of South Africa. The seat of Nkangala is Middelburg. The Nkangala District Municipality consists of 160 towns and villages. The most spoken language of its 1,308,129 people is IsiNdebele with 28.4%, closely followed by Zulu speakers (2011 Census). The district code is DC31.