Elections to Three Rivers Council were held on 3 May 2007. One third of the council was up for election and the Liberal Democrat party stayed in overall control of the council.
The Liberal Democrats are a liberal political party in the United Kingdom. They presently have 11 Members of Parliament in the House of Commons, 96 members of the House of Lords, and one member of the European Parliament. They also have five Members of the Scottish Parliament and a member each in the Welsh Assembly and London Assembly. The party reached the height of its influence in the early 2010s, forming a junior partner in a coalition government from 2010 to 2015. It is presently led by Vince Cable.
After the election, the composition of the council was
Party | Seats | Gains | Losses | Net gain/loss | Seats % | Votes % | Votes | +/− | |
---|---|---|---|---|---|---|---|---|---|
Liberal Democrat | 11 | 1 | 0 | +1 | 68.8 | 54.9 | 10,216 | +8.5% | |
Conservative | 3 | 1 | 1 | 0 | 18.8 | 35.7 | 6,653 | -8.5% | |
Labour | 2 | 0 | 1 | -1 | 12.5 | 7.7 | 1,439 | -0.4% | |
Green | 0 | 0 | 0 | 0 | 0 | 1.0 | 179 | +0.7% | |
UKIP | 0 | 0 | 0 | 0 | 0 | 0.7 | 125 | +0.2% | |
Party | Candidate | Votes | % | ± | |
---|---|---|---|---|---|
Liberal Democrat | Matthew Bedford | 1,028 | 67.8 | +10.9 | |
Conservative | Andy Woodard | 401 | 26.4 | -8.0 | |
Labour | Bruce Prochnik | 88 | 5.8 | -2.9 | |
Majority | 627 | 41.4 | +18.9 | ||
Turnout | 1,517 | 41.5 | -2.1 | ||
Liberal Democrat hold | Swing | ||||
Party | Candidate | Votes | % | ± | |
---|---|---|---|---|---|
Conservative | Graham Denman | 241 | 43.9 | +10.5 | |
Labour | Nena Spellen | 231 | 42.1 | +2.6 | |
Liberal Democrat | Gabriel Aitman | 77 | 14.0 | -13.0 | |
Majority | 10 | 1.8 | -4.3 | ||
Turnout | 549 | 22.3 | -6.5 | ||
Conservative gain from Labour | Swing | ||||
Party | Candidate | Votes | % | ± | |
---|---|---|---|---|---|
Liberal Democrat | Richard Laval | 525 | 59.3 | +0.4 | |
Conservative | Claire Woodard | 281 | 31.8 | +6.3 | |
Labour | Stephen Cox | 79 | 8.9 | +0.5 | |
Majority | 244 | 27.5 | -5.9 | ||
Turnout | 885 | 33.2 | -9.4 | ||
Liberal Democrat hold | Swing | ||||
Party | Candidate | Votes | % | ± | |
---|---|---|---|---|---|
Liberal Democrat | Pam Hames | 1,003 | 60.9 | +7.6 | |
Conservative | Craig Lewell | 448 | 27.2 | -12.4 | |
UKIP | Andrew Shanks | 125 | 7.6 | +7.6 | |
Labour | Stephen King | 72 | 4.4 | -2.7 | |
Majority | 555 | 33.7 | +20.0 | ||
Turnout | 1,648 | 41.4 | -7.3 | ||
Liberal Democrat hold | Swing | ||||
Party | Candidate | Votes | % | ± | |
---|---|---|---|---|---|
Liberal Democrat | Barbara Green | 1,163 | 53.5 | +0.3 | |
Conservative | Richard Booth | 933 | 42.9 | +4.2 | |
Green | Tina Kamei | 78 | 3.6 | +0.5 | |
Majority | 230 | 10.6 | -3.9 | ||
Turnout | 2,174 | 53.0 | -4.2 | ||
Liberal Democrat hold | Swing | ||||
Party | Candidate | Votes | % | ± | |
---|---|---|---|---|---|
Liberal Democrat | Leighton Dann | 977 | 60.6 | +4.1 | |
Conservative | Mark Englefield | 512 | 31.8 | -5.1 | |
Labour | David Wynne-Jones | 123 | 7.6 | +0.9 | |
Majority | 465 | 28.8 | +9.6 | ||
Turnout | 1,612 | 38.5 | -9.6 | ||
Liberal Democrat hold | Swing | ||||
Party | Candidate | Votes | % | ± | |
---|---|---|---|---|---|
Liberal Democrat | Christopher Lloyd | 841 | 76.0 | +23.7 | |
Conservative | David Redman | 266 | 24.0 | -16.3 | |
Majority | 575 | 52.0 | +40.0 | ||
Turnout | 1,107 | 43.0 | -1.5 | ||
Liberal Democrat hold | Swing | ||||
Party | Candidate | Votes | % | ± | |
---|---|---|---|---|---|
Liberal Democrat | Philip Brading | 705 | 75.2 | +8.0 | |
Conservative | Jacqueline Worrall | 233 | 24.8 | +0.1 | |
Majority | 472 | 50.4 | +5.9 | ||
Turnout | 938 | 36.0 | -7.0 | ||
Liberal Democrat hold | Swing | ||||
Party | Candidate | Votes | % | ± | |
---|---|---|---|---|---|
Labour | Phil Redshaw | 274 | 52.4 | -5.1 | |
Conservative | Malcolm Butwick | 162 | 31.0 | +8.0 | |
Liberal Democrat | David Lowes | 87 | 16.6 | -2.9 | |
Majority | 112 | 21.4 | -13.1 | ||
Turnout | 523 | 21.2 | -9.4 | ||
Labour hold | Swing | ||||
Party | Candidate | Votes | % | ± | |
---|---|---|---|---|---|
Liberal Democrat | Paul Goggins | 839 | 68.3 | +2.9 | |
Conservative | Barbara Brockhurst | 244 | 19.9 | -3.5 | |
Labour | John Sutton | 146 | 11.9 | +0.7 | |
Majority | 595 | 48.4 | +6.4 | ||
Turnout | 1,229 | 34.7 | -2.9 | ||
Liberal Democrat hold | Swing | ||||
Party | Candidate | Votes | % | ± | |
---|---|---|---|---|---|
Liberal Democrat | Stephen Giles-Medhurst | 952 | 77.0 | +11.8 | |
Conservative | Wally Tuck | 217 | 17.6 | -8.1 | |
Labour | Peter Arthur | 67 | 5.4 | -3.7 | |
Majority | 735 | 59.4 | +19.9 | ||
Turnout | 1,236 | 31.7 | -2.2 | ||
Liberal Democrat hold | Swing | ||||
Party | Candidate | Votes | % | ± | |
---|---|---|---|---|---|
Liberal Democrat | Ann Shaw | 819 | 69.9 | +13.3 | |
Conservative | Edna Nicholls | 353 | 30.1 | -4.8 | |
Majority | 466 | 39.8 | +18.1 | ||
Turnout | 1,172 | 32.2 | -3.4 | ||
Liberal Democrat hold | Swing | ||||
Party | Candidate | Votes | % | ± | |
---|---|---|---|---|---|
Conservative | Ralph Sangster | 1,096 | 76.9 | -0.8 | |
Liberal Democrat | Jeremy Asquith | 229 | 16.1 | -0.4 | |
Green | Andy Lewis | 101 | 7.1 | +7.1 | |
Majority | 867 | 60.8 | -0.4 | ||
Turnout | 1,426 | 32.8 | -10.9 | ||
Conservative hold | Swing | ||||
Party | Candidate | Votes | % | ± | |
---|---|---|---|---|---|
Labour | Ron Spellen | 299 | 36.8 | -2.5 | |
Conservative | Alistair Macdonald | 268 | 33.0 | +11.0 | |
Liberal Democrat | Alan Feldman | 246 | 30.3 | -8.3 | |
Majority | 31 | 3.8 | +3.1 | ||
Turnout | 813 | 23.5 | -4.2 | ||
Labour hold | Swing | ||||
Party | Candidate | Votes | % | ± | |
---|---|---|---|---|---|
Liberal Democrat | Peter Ray | 589 | 55.3 | +9.0 | |
Conservative | Roy Clements | 417 | 39.1 | -4.0 | |
Labour | Sheila Bull | 60 | 5.6 | -5.0 | |
Majority | 172 | 16.2 | +13.0 | ||
Turnout | 1,066 | 42.4 | +0.8 | ||
Liberal Democrat gain from Conservative | Swing | ||||
Party | Candidate | Votes | % | ± | |
---|---|---|---|---|---|
Conservative | Tony Barton | 581 | 81.0 | +5.6 | |
Liberal Democrat | Sue Stibbs | 136 | 19.0 | -5.6 | |
Majority | 445 | 62.0 | +11.2 | ||
Turnout | 717 | 48.1 | +7.2 | ||
Conservative hold | Swing | ||||
One third of Three Rivers District Council in Hertfordshire, England is elected each year, followed by one year without election.
Elections to Three Rivers Council were held on 6 May 1999. The whole council was up for election with boundary changes since the last election in 1998. The Liberal Democrat party gained overall control of the council from no overall control.
Elections to Three Rivers Council in Hertfordshire, England, were held on 4 May 2000. One third of the council was up for election and the Liberal Democrat party stayed in overall control of the council.
Elections to Three Rivers Council were held on 2 May 2002. One third of the council was up for election and the Liberal Democrat party stayed in overall control of the council.
Elections to Three Rivers Council were held on 1 May 2003. One third of the council was up for election and the Liberal Democrat party stayed in overall control of the council.
Elections to Three Rivers Council were held on 10 June 2004. One third of the council was up for election and the Liberal Democrat party stayed in overall control of the council. Overall turnout was 42.1%.
Elections to Three Rivers Council were held on 4 May 2006. One third of the council was up for election and the Liberal Democrat party stayed in overall control of the council.
Elections for Oxford City Council were held on Thursday 1 May 2008. As Oxford City Council is elected by halves, one seat in each of the 24 wards is up for election.
Elections to Three Rivers District Council were held on 1 May 2008. One-third of the council was up for election. The Liberal Democrats won the most seats, despite the Conservatives winning more votes. The Conservatives also gained a seat, strengthening their position against the Liberal Democrats, who remained stayed in overall control of Three Rivers.
The 2007 council elections in Guildford saw the Conservatives retain control over Guildford Borough Council. Full results for each ward can be found at Guildford Council election, full results, 2007.
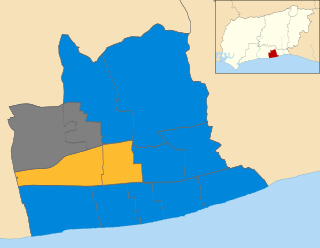
The 2007 Worthing Borough Council election took place on 3 May 2007 to elect members of Worthing Borough Council in West Sussex, England. One third of the council was up for election and the Conservative party stayed in overall control of the council.
The 2007 Hull City Council election took place on 3 May 2007 to elect members of Hull City Council in England. One third of the council was up for election and the Liberal Democrats gained overall control of the council from no overall control. Overall turnout was 27%.
The 2007 Pendle Borough Council election took place on 3 May 2007 to elect members of Pendle Borough Council in Lancashire, England. One third of the council was up for election and the Liberal Democrats stayed in overall control of the council.
The 2011 council elections in Guildford saw the Conservatives retain control over Guildford Borough Council with an increased majority of 20 seats. Full results for each ward can be found at Guildford Council election, full results, 2011.
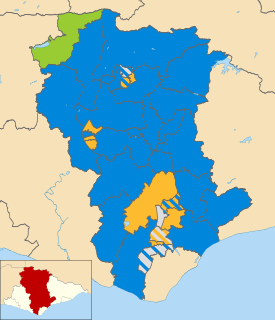
The 2007 Wealden District Council election took place on 3 May 2007 to elect members of Wealden District Council in East Sussex, England. The whole council was up for election and the Conservative party stayed in overall control of the council.
Elections to Three Rivers District Council were held on 3 May 2012 to elect one-third of the council of Three Rivers district in England.
Elections to Three Rivers District Council were held on 5 May 2011 to elect one-third of the council of Three Rivers district in England. These seats had been previously defended in 2007.
The 2015 Guildford Borough Council election took place on 7 May 2015 to elect members of Guildford Borough Council in England as one of the 2015 local elections, held simultaneously with the General Election.
The 2007 Christchurch Borough Council election took place on 3 May 2007 to elect members of Christchurch Borough Council in Dorset, England. The whole council was up for election and the Conservative party stayed in overall control of the council.
The 2011 South Oxfordshire District Council election was held on 5 May 2011 to elect members of South Oxfordshire District Council in England. This was on the same day as other local elections.