Elections to Three Rivers District Council were held on 3 May 2012 to elect one-third of the council of Three Rivers district in England. [1]
The Liberal Democrats won the largest number of seats and the most votes. The Conservatives failed to strengthen their position against the Liberal Democrats, who remained stayed in overall control of Three Rivers. Labour gained two seats, including one they had lost to the British National Party; the incumbent moved to the English Democrats Party in 2010 and stood as the EDP candidate. Overall, however, this council remains under firm LibDem control, with most seats contested between them and the Conservatives, and Labour having little prospect of improving their own representation.
The Liberal Democrats are a liberal political party in the United Kingdom. They presently have 11 Members of Parliament in the House of Commons, 96 members of the House of Lords, and one member of the European Parliament. They also have five Members of the Scottish Parliament and a member each in the Welsh Assembly and London Assembly. The party reached the height of its influence in the early 2010s, forming a junior partner in a coalition government from 2010 to 2015. It is presently led by Vince Cable.
The British National Party (BNP) is a far-right, fascist political party in the United Kingdom. It is headquartered in Wigton, Cumbria, and its current leader is Adam Walker. A minor party, it has no elected representatives at any level of UK government. Founded in 1982, the party reached its greatest level of success in the 2000s, when it had over fifty seats in local government, one seat on the London Assembly, and two Members of the European Parliament.
After the election, the composition of the council was [2]
The Conservative Party, officially the Conservative and Unionist Party, is a centre-right political party in the United Kingdom. Presently led by Theresa May, it has been the governing party since 2010. It presently has 314 Members of Parliament in the House of Commons, 249 members of the House of Lords, and 18 members of the European Parliament. It also has 31 Members of the Scottish Parliament, 12 members of the Welsh Assembly, eight members of the London Assembly and 9,008 local councillors. One of the major parties of UK politics, it has formed the government on 45 occasions, more than any other party.
The Labour Party is a centre-left political party in the United Kingdom which has been described as an alliance of social democrats, democratic socialists and trade unionists. The party's platform emphasises greater state intervention, social justice and strengthening workers' rights.
Party | Seats | Gains | Losses | Net gain/loss | Seats % | Votes % | Votes | +/− | |
---|---|---|---|---|---|---|---|---|---|
Liberal Democrat | 8 | 0 | -1 | -1 | 40.0 | 7039 | |||
Conservative | 5 | 1 | 1 | 0 | 39.9 | 7022 | |||
Labour | 3 | +2 | 0 | +2 | 18.3 | 3213 | |||
English Democrat | 0 | 0 | 0 | 0 | 0 | 1.3 | 234 | ||
UKIP | 0 | 0 | 0 | 0 | 0 | 0.4 | 69 | ||
BNP | 0 | 0 | -1 | -1 | 0 | 0 | 0 | ||
Defending incumbent marked with "*"
Party | Candidate | Votes | % | ± | |
---|---|---|---|---|---|
Liberal Democrat | David MAJOR* | 736 | 61.2 | ||
Conservative | Mehdi MOOSSAVI | 255 | 21.2 | ||
Labour | Joanne Victoria COX | 211 | 17.6 | ||
Majority | 481 | 40.0 | |||
Turnout | 1202 | 32.4 | |||
Liberal Democrat hold | Swing | ||||
Party | Candidate | Votes | % | ± | |
---|---|---|---|---|---|
Labour | Marie-Louise Straub NOLAN | 335 | 48.8 | ||
English Democrat | Seamus DUNNE | 154 | 22.4 | ||
Conservative | Nigel STEWART | 138 | 20.1 | ||
Liberal Democrat | Nena SPELLEN | 60 | 8.7 | ||
Majority | 181 | 26.3 | |||
Turnout | 687 | 25.5 | |||
Labour gain from BNP | Swing | ||||
Party | Candidate | Votes | % | ± | |
---|---|---|---|---|---|
Conservative | Terry DOS RAMOS | 675 | 43.5 | ||
Liberal Democrat | Geoff DUNNE | 674 | 43.4 | ||
Labour | Judith Ann WALKER | 203 | 13.1 | ||
Majority | 1 | 0.1 | |||
Turnout | 1552 | 38.1 | |||
Conservative gain from Liberal Democrat | Swing | ||||
Party | Candidate | Votes | % | ± | |
---|---|---|---|---|---|
Conservative | Chris HAYWARD* | 815 | 78.0 | ||
Liberal Democrat | Raj KHIROYA | 158 | 15.1 | ||
Labour | David WILLIAMS | 72 | 6.9 | ||
Majority | 657 | 62.9 | |||
Turnout | 1045 | 30.6 | |||
Conservative hold | Swing | ||||
Party | Candidate | Votes | % | ± | |
---|---|---|---|---|---|
Liberal Democrat | Sue STIBBS | 1028 | 50.8 | ||
Conservative | Emma Claire BINDLOSS | 862 | 42.6 | ||
Labour | Fiona Katherine GOBLE | 134 | 6.6 | ||
Majority | 166 | 8.2 | |||
Turnout | 2024 | 45.9 | |||
Liberal Democrat hold | Swing | ||||
Party | Candidate | Votes | % | ± | |
---|---|---|---|---|---|
Liberal Democrat | Brian Richard NORMAN* | 795 | 59.2 | ||
Conservative | Christine Heather JEFFORD | 392 | 29.2 | ||
Labour | Maureen SEDLACEK | 155 | 11.5 | ||
Majority | 403 | 30.0 | |||
Turnout | 1342 | 30.8 | |||
Liberal Democrat hold | Swing | ||||
Party | Candidate | Votes | % | ± | |
---|---|---|---|---|---|
Labour | Stephen Michael James KING | 421 | 72.3 | ||
Conservative | WORRALL Jackie | 128 | 22.0 | ||
Liberal Democrat | Tony HUMPHREYS | 33 | 5.7 | ||
Majority | 293 | 50.3 | |||
Turnout | 582 | 22.6 | |||
Labour hold | Swing | ||||
Party | Candidate | Votes | % | ± | |
---|---|---|---|---|---|
Liberal Democrat | Chris WHATELY-SMITH* | 700 | 61.1 | ||
Conservative | Michelle BAUDIN | 237 | 20.7 | ||
Labour | Philip Edward LOCKETT | 208 | 18.2 | ||
Majority | 463 | 40.4 | |||
Turnout | 1145 | 29.7 | |||
Liberal Democrat hold | Swing | ||||
Party | Candidate | Votes | % | ± | |
---|---|---|---|---|---|
Liberal Democrat | Keith WILLIAMS | 686 | 66.3 | ||
Conservative | Hitesh Kumar TAILOR | 192 | 18.6 | ||
Labour | Colin James GRAY | 157 | 15.2 | ||
Majority | 494 | 47.7 | |||
Turnout | 1035 | 25.1 | |||
Liberal Democrat hold | Swing | ||||
Party | Candidate | Votes | % | ± | |
---|---|---|---|---|---|
Liberal Democrat | Peter WAKELING* | 613 | 54.9 | ||
Conservative | David William RAW | 321 | 28.7 | ||
Labour | Sarah LINHART | 183 | 16.4 | ||
Majority | 292 | 26.1 | |||
Turnout | 1117 | 27.0 | |||
Liberal Democrat hold | Swing | ||||
Party | Candidate | Votes | % | ± | |
---|---|---|---|---|---|
Conservative | Amrit MEDIRATTA* | 955 | 75.6 | ||
Labour | Joan KING | 181 | 14.3 | ||
Liberal Democrat | Jerry ASQUITH | 127 | 10.1 | ||
Majority | 774 | 61.3 | |||
Turnout | 1263 | 27.7 | |||
Conservative hold | Swing | ||||
Party | Candidate | Votes | % | ± | |
---|---|---|---|---|---|
Labour | Ana BAKSHI | 430 | 58.1 | ||
Conservative | Malcolm BUTWICK | 161 | 21.8 | ||
English Democrat | Roger Warwick HOLMES | 80 | 10.8 | ||
Liberal Democrat | Ron SPELLEN | 69 | 9.3 | ||
Majority | 269 | 36.4 | |||
Turnout | 740 | 21.1 | |||
Labour gain from Conservative | Swing | ||||
Party | Candidate | Votes | % | ± | |
---|---|---|---|---|---|
Liberal Democrat | Alison SCARTH* | 545 | 52.3 | ||
Conservative | Diane DAY | 342 | 32.8 | ||
Labour | Brendan O’BRIEN | 87 | 8.3 | ||
UKIP | Michael Ernest MATTHEWSON | 69 | 6.6 | ||
Majority | 203 | 19.5 | |||
Turnout | 1043 | 39.9 | |||
Liberal Democrat hold | Swing | ||||
Party | Candidate | Votes | % | ± | |
---|---|---|---|---|---|
Liberal Democrat | Sarah Jane NELMES* | 294 | 44.5 | ||
Conservative | James Richard DWYER | 202 | 30.6 | ||
Labour | David WARBURTON | 165 | 25.0 | ||
Majority | 92 | 13.9 | |||
Turnout | 661 | 26.0 | |||
Liberal Democrat hold | Swing | ||||
Party | Candidate | Votes | % | ± | |
---|---|---|---|---|---|
Conservative | Paula Elizabeth HISCOCKS* | 694 | 64.9 | ||
Liberal Democrat | Jill Marguerite SWAINSON | 205 | 19.2 | ||
Labour | Karen Ruth MCINTOSH | 171 | 16.0 | ||
Majority | 489 | 45.7 | |||
Turnout | 1070 | 31.0 | |||
Liberal Democrat hold | Swing | ||||
Party | Candidate | Votes | % | ± | |
---|---|---|---|---|---|
Conservative | Russell Owen SMITH* | 653 | 61.1 | ||
Liberal Democrat | Pat HOWELL | 316 | 29.6 | ||
Labour | Bruce PROCHNIK | 100 | 9.4 | ||
Majority | 337 | 31.5 | |||
Turnout | 1069 | 38.0 | |||
Liberal Democrat hold | Swing | ||||
The 1999 Craven District Council election took place on 6 May 1999 to elect members of Craven District Council in North Yorkshire, England. One third of the council was up for election and the Conservative party gained overall control of the council from no overall control.
The 2003 Harlow District Council election took place on 1 May 2003 to elect members of Harlow District Council in Essex, England. One third of the council was up for election and the council stayed under no overall control.
The 2007 Harlow District Council election took place on 3 May 2007 to elect members of Harlow District Council in Essex, England. One third of the council was up for election and the council stayed under no overall control.
Elections to Three Rivers District Council were held on 1 May 2008. One-third of the council was up for election. The Liberal Democrats won the most seats, despite the Conservatives winning more votes. The Conservatives also gained a seat, strengthening their position against the Liberal Democrats, who remained stayed in overall control of Three Rivers.
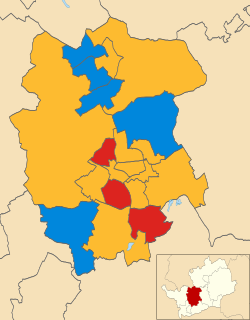
The 2003 St Albans City and District Council election took place on 1 May 2003 to elect members of St Albans District Council in Hertfordshire, England. One third of the council was up for election and the council stayed under no overall control.
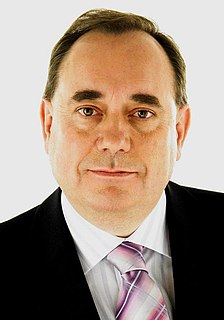
The 2012 Scottish local elections, were held on 3 May, in all 32 local authorities. The Scottish National Party (SNP) overtook Labour to win the highest share of the vote, and retained and strengthened its position as the party with most councillors. Labour also made gains, while the Liberal Democrats experienced meltdown, falling behind the Conservatives. For the first time since the introduction of the Single Transferable Vote system, the SNP won majority control of 2 councils, from no overall control. Labour also won majority control of 2 councils from no overall control, while retaining majority control over 2 councils.
The 2011 Wealden District Council election took place on 5 May 2011 to elect members of Wealden District Council in East Sussex, England. The whole council was up for election and the Conservative party stayed in overall control of the council.
The 2013 United Kingdom local elections took place on Thursday 2 May 2013. Elections were held in 35 English councils: all 27 non-metropolitan county councils and eight unitary authorities, and in one Welsh unitary authority. Direct mayoral elections took place in Doncaster and North Tyneside. These elections last took place on the 4 June 2009 at the same time as the 2009 European Parliament Elections, except for County Durham, Northumberland and the Anglesey where elections last took place in 2008.
Elections to Three Rivers District Council were held on 5 May 2011 to elect one-third of the council of Three Rivers district in England. These seats had been previously defended in 2007.
The 2014 St Albans City and District Council election took place on 22 May 2014 to elect members of St Albans District Council in Hertfordshire, England. One third of the council was up for election and the council stayed under no overall control.
The 2014 Calderdale Metropolitan Borough Council election took place on 22 May 2014 to elect members of Calderdale Metropolitan Borough Council in England. This was on the same day as local elections across the United Kingdom and a European election. One councillor was elected in each of the 17 wards for a four-year term. There are three councillors representing each ward elected on a staggered basis so one third of the councillor seats were up for re-election. The seats had previously been contested in 2010 which was held in conjunction with a general election. The turnout was significantly lower in 2014 than in 2010 which is not unusual when comparing local elections that coincide with general elections to ones that do not. Prior to the election Labour was the largest party in the council with 21 out of 51 seats, 5 seats short of an overall majority. After the election there was no overall control of the council. Labour had 25 seats, only one short of a majority and so Labour continued to operate a minority administration.
The 2012 Pendle Borough Council election took place on 3 May 2012 to elect members of Pendle Borough Council in Lancashire, England. One third of the council was up for election and the council stayed under no overall control.
The 2012 Huntingdonshire District Council election took place on 3 May 2012 to elect members of Huntingdonshire District Council in Cambridgeshire, England. One third of the council was up for election and the Conservative party stayed in overall control of the council.
The 2014 Huntingdonshire District Council election took place on 22 May 2014 to elect members of Huntingdonshire District Council in Cambridgeshire, England. One third of the council was up for election and the Conservative party stayed in overall control of the council.
The 2012 Harlow District Council election took place on 3 May 2012 to elect members of Harlow District Council in Essex, England. One third of the council was up for election and the Labour party gained overall control of the council from the Conservative party.
The 2012 Tandridge District Council election took place on 3 May 2012 to elect members of Tandridge District Council in Surrey, England. One third of the council was up for election and the Conservative party stayed in overall control of the council.
The 2006 West Oxfordshire District Council election took place on 4 May 2006 to elect members of West Oxfordshire District Council in Oxfordshire, England. One third of the council was up for election and the Conservative party stayed in overall control of the council.
The 2007 West Oxfordshire District Council election took place on 3 May 2007 to elect members of West Oxfordshire District Council in Oxfordshire, England. One third of the council was up for election and the Conservative party stayed in overall control of the council.
The 2012 West Oxfordshire District Council election took place on 3 May 2012 to elect members of West Oxfordshire District Council in Oxfordshire, England. One third of the council was up for election and the Conservative party stayed in overall control of the council.
The 2014 West Oxfordshire District Council election took place on 22 May 2014 to elect members of West Oxfordshire District Council in Oxfordshire, England. One third of the council was up for election and the Conservative party stayed in overall control of the council.