| |||||||||||||||||||||||||||||||||
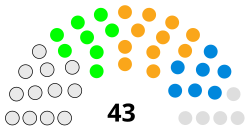
All 43 seats to Tandridge District Council 22 seats needed for a majority | |||||||||||||||||||||||||||||||||
---|---|---|---|---|---|---|---|---|---|---|---|---|---|---|---|---|---|---|---|---|---|---|---|---|---|---|---|---|---|---|---|---|---|
| |||||||||||||||||||||||||||||||||
Results by ward (Residents (various) in pink, OLRDG in lime, independents in grey, Liberal Democrats in orange, and Conservatives in blue) | |||||||||||||||||||||||||||||||||
|
The 2024 Tandridge District Council election was held on Thursday 2 May 2024, alongside the other local elections in the United Kingdom held on the same day. All 43 members of Tandridge District Council in Surrey were elected following boundary changes. The local residents' association (composed of independent councillors and Oxted and Limpsfield Residents Group councillors) managed to increase their seat count, but fell two seats short of gaining majority control of the council. [1]
Tandridge was a historically Conservative council. The Conservatives held a majority on the council until 1990, when the Liberal Democrats became the largest party. [2] They briefly retook the council in 1994, before losing it to no overall control again in 1995. The Conservatives formed a majority administration in 2000, which lasted until 2019. [3]
Following the previous election, independents had a total of 14 seats (up 2), the Liberal Democrats had 11, the Conservatives had 9 (down 2), and the Oxted and Limpsfield Residents Group had 8. The Oxted and Limpsfield Residents Group and 10 independents run the council as a minority administration. [4]
Tandridge usually elects its councillors in thirds, on a 4-year cycle. However, following boundary changes, all councillors will be elected to the new wards. [5] The change increases the number of councillors by 1.
Old wards [6] | No. of seats | New wards | No. of seats |
---|---|---|---|
Bletchingley and Nutfield | 3 | Bletchingley and Nutfield | 3 |
Burstow, Horne and Outwood | 3 | Burstow, Horne and Outwood | 3 |
Chaldon | 1 | Chaldon | 1 |
Dormansland and Felcourt | 2 | Dormansland and Felbridge | 3 |
Felbridge | 1 | Godstone | 3 |
Godstone | 3 | Harestone | 2 |
Harestone | 2 | Limpsfield | 2 |
Limpsfield | 2 | Lingfield and Crowhurst | 3 |
Lingfield and Crowhurst | 2 | Oxted North | 3 |
Oxted North and Tandridge | 3 | Oxted South | 3 |
Oxted South | 3 | Portley and Queens Park | 3 |
Portley | 2 | Tatsfield and Titsey | 1 |
Queens Park | 2 | Valley | 2 |
Tatsfield and Titsey | 1 | Warlingham East and Chelsham and Farleigh | 3 |
Valley | 2 | Warlingham West | 2 |
Warlingham East and Chelsham and Farleigh | 3 | Westway | 3 |
Warlingham West | 2 | Whyteleafe | 2 |
Westway | 2 | Woldingham | 1 |
Whyteleafe | 2 | ||
Woldingham | 1 |
No council seats changed hands between the previous election and this election.
After 2023 election | After 2024 election [7] [8] | ||||
---|---|---|---|---|---|
Party | Seats | Party | Seats | ||
Independent (Residents’ Alliance) | 10 | Independent (Residents’ Alliance) | 12 | ||
Oxted and Limpsfield Residents Group (OLRG) | 8 | Oxted and Limpsfield Residents Group (OLRG) | 8 | ||
RA total | 18 | RA total | 20 | ||
Liberal Democrats | 11 | Liberal Democrats | 11 | ||
Conservative | 9 | Conservative | 7 | ||
Independent | 4 | Independent | 5 | ||
Total | 42 | Total | 43 |
The results were as follows, with an asterisk(*) indicating a sitting councillor standing for re-election. [1]
Party | Candidate | Votes | % | ±% | |
---|---|---|---|---|---|
Independent | Helena Windsor* | 640 | |||
Bletchingley & Nutfield Residents | Louise Case | 518 | |||
Liberal Democrats | Richard Fowler | 501 | |||
Conservative | Liam Hammond* | 495 | |||
Liberal Democrats | Susan Hickson | 366 | |||
Liberal Democrats | Martin Redman | 348 | |||
Conservative | Iain Carter | 343 | |||
Green | Emily Malkin | 271 | |||
Labour | Linda Baharier | 218 | |||
Labour | Barbara Wantling | 195 | |||
Heritage | Graham Bailey | 168 | |||
Labour | Graham Powell | 145 | |||
Turnout | 35.9 | ||||
Registered electors | |||||
Independent win (new seat) | |||||
Residents win (new seat) | |||||
Liberal Democrats win (new seat) |
Party | Candidate | Votes | % | ±% | |
---|---|---|---|---|---|
Burstow, Horne & Outwood Residents | Ashleigh Bolton | 825 | |||
Burstow, Horne & Outwood Residents | Sue Farr* | 800 | |||
Burstow, Horne & Outwood Residents | Richard Smith* | 799 | |||
Conservative | Theo Harris | 361 | |||
Labour | Stephen Case-Green | 197 | |||
Green | Elliott McLean de Boer | 189 | |||
Labour | Matthew Allen | 180 | |||
Liberal Democrats | Judy Wilkinson | 171 | |||
Labour | Andrew McLean | 147 | |||
Turnout | 29.2 | ||||
Registered electors | |||||
Residents win (new seat) | |||||
Residents win (new seat) |
Party | Candidate | Votes | % | ±% | |
---|---|---|---|---|---|
Conservative | Lewis Sharp* | 367 | 65.8 | ||
Liberal Democrats | Neil Parker | 113 | 20.3 | ||
Green | Rebecca Gower | 78 | 14.0 | ||
Turnout | 558 | 39.8 | |||
Registered electors | |||||
Conservative win (new seat) |
Party | Candidate | Votes | % | ±% | |
---|---|---|---|---|---|
Conservative | Lesley Steeds* | 705 | |||
Dormansland & Felbridge Residents | Nicholas White* | 655 | |||
Dormansland & Felbridge Residents | Nicola O'Riordan* | 591 | |||
Independent | Judy Moore* | 565 | |||
Conservative | Maureen Young | 458 | |||
Conservative | Nigel Lea | 328 | |||
Green | Becky Peterson | 273 | |||
Liberal Democrats | David Nickols | 193 | |||
Liberal Democrats | Roger Martin | 179 | |||
Labour | Richard Clarke | 168 | |||
Labour | Emba Jones | 145 | |||
Turnout | 37.3 | ||||
Registered electors | |||||
Conservative win (new seat) | |||||
Residents win (new seat) | |||||
Residents win (new seat) |
Party | Candidate | Votes | % | ±% | |
---|---|---|---|---|---|
Godstone Residents | Mike Crane* | 1,051 | |||
Godstone Residents | Chris Farr* | 1,037 | |||
Godstone Residents | Colin White* | 1,018 | |||
Labour | Amy Hare | 207 | |||
Conservative | Oliver Watkins | 205 | |||
Conservative | Hoong-Wai Cheah | 175 | |||
Turnout | 32.3 | ||||
Registered electors | |||||
Residents win (new seat) | |||||
Residents win (new seat) |
Party | Candidate | Votes | % | ±% | |
---|---|---|---|---|---|
Liberal Democrats | Annette Evans* | 697 | |||
Liberal Democrats | Robin Spencer | 531 | |||
Conservative | Michael Casebourne | 468 | |||
Conservative | Mark Winsbury | 378 | |||
Labour | Carron Walker | 127 | |||
Labour | Thomas Holloway | 101 | |||
Turnout | 39.4 | ||||
Registered electors | |||||
Liberal Democrats win (new seat) | |||||
Liberal Democrats win (new seat) |
Party | Candidate | Votes | % | ±% | |
---|---|---|---|---|---|
OLRG | Claire Blackwell* | 1,051 | |||
OLRG | Ian Booth* | 996 | |||
Conservative | Robert Brewer | 144 | |||
Conservative | Bernice Milton | 116 | |||
Liberal Democrats | Rupert McCann | 113 | |||
Turnout | 44.7 | ||||
Registered electors | |||||
OLRG win (new seat) | |||||
OLRG win (new seat) |
Party | Candidate | Votes | % | ±% | |
---|---|---|---|---|---|
Lingfield & Crowhurst Residents | Julie Duggan | 739 | |||
Lingfield & Crowhurst Residents | Peter Killick | 684 | |||
Independent | Liz Lockwood | 584 | |||
Lingfield & Crowhurst Residents | Alan Schmidt | 521 | |||
Labour | Ryan Howard | 360 | |||
Labour | Freyja Chapman | 305 | |||
Labour | Joseph Pettitt | 272 | |||
Conservative | Anthony Beck | 253 | |||
Conservative | Paul Greenhalgh | 241 | |||
Liberal Democrats | Dave Wilkes | 190 | |||
Conservative | Arman Shahjid | 161 | |||
Turnout | 36.3 | ||||
Registered electors | |||||
Residents win (new seat) | |||||
Independent win (new seat) |
Party | Candidate | Votes | % | ±% | |
---|---|---|---|---|---|
OLRG | Catherine Sayer* | 1,570 | |||
OLRG | Peter Damesick* | 1,531 | |||
OLRG | Chris Bassett | 1,481 | |||
Conservative | Janet Brealey | 186 | |||
Green | Ian Giddings | 186 | |||
Labour | Louis Labrosse | 170 | |||
Conservative | Laurence Hatchwell | 153 | |||
Conservative | Matthew Hatchwell | 149 | |||
Labour | Philip Son | 146 | |||
Heritage | Christopher Dean | 21 | |||
Turnout | 44.4 | ||||
Registered electors | |||||
OLRG win (new seat) | |||||
OLRG win (new seat) |
Party | Candidate | Votes | % | ±% | |
---|---|---|---|---|---|
OLRG | Deb Shiner* | 1,096 | |||
OLRG | Chris Langton* | 1,079 | |||
OLRG | Bryan Black* | 1,071 | |||
Labour | David Halliwell | 265 | |||
Labour | Patricia Hunter | 263 | |||
Labour | Mark Dean | 254 | |||
Conservative | Elizabeth Parker | 235 | |||
Conservative | Nicolas Cook | 144 | |||
Conservative | Marjory Budgen | 126 | |||
Turnout | 35.8 | ||||
Registered electors | |||||
OLRG win (new seat) | |||||
OLRG win (new seat) |
Party | Candidate | Votes | % | ±% | |
---|---|---|---|---|---|
Liberal Democrats | Ben Horne | 767 | |||
Conservative | Michael Cooper* | 637 | |||
Conservative | Richard Mark | 499 | |||
Caterham Residents | Susan Berns | 493 | |||
Conservative | Linda Jenkins | 468 | |||
Labour | Jane Lopez | 352 | |||
Labour | Nick Bray | 336 | |||
Labour | Steven Willmott | 277 | |||
Turnout | 35.3 | ||||
Registered electors | |||||
Liberal Democrats win (new seat) | |||||
Conservative win (new seat) | |||||
Conservative win (new seat) |
Party | Candidate | Votes | % | ±% | |
---|---|---|---|---|---|
Independent | Martin Allen* | 423 | 70.0 | ||
Conservative | Kenneth Budgen | 129 | 21.4 | ||
Green | Sarah Stewart | 52 | 8.6 | ||
Turnout | 604 | 39.6 | |||
Registered electors | |||||
Independent win (new seat) |
Party | Candidate | Votes | % | ±% | |
---|---|---|---|---|---|
Liberal Democrats | Alun Jones* | 628 | |||
Liberal Democrats | Jenny Gaffney* | 584 | |||
Caterham Residents | Peter Roberts | 302 | |||
Conservative | Max Barry | 155 | |||
Labour | Anne Watson | 134 | |||
Labour | Nicole Morrigan | 116 | |||
Turnout | 32.6 | ||||
Registered electors | |||||
Liberal Democrats win (new seat) | |||||
Liberal Democrats win (new seat) |
Party | Candidate | Votes | % | ±% | |
---|---|---|---|---|---|
Independent | Jeremy Pursehouse* | 850 | |||
Liberal Democrats | Perry Chotai* | 506 | |||
Liberal Democrats | Anna Patel* | 499 | |||
Independent | Martin Strzebrakowski | 495 | |||
Conservative | Nathan Adams | 494 | |||
Conservative | Marc Lamont | 268 | |||
Conservative | Michael Whittington | 246 | |||
Labour | Julian Cresswell | 200 | |||
Labour | Daniel Mann | 118 | |||
Turnout | 38.2 | ||||
Registered electors | |||||
Independent win (new seat) | |||||
Liberal Democrats win (new seat) | |||||
Liberal Democrats win (new seat) |
Party | Candidate | Votes | % | ±% | |
---|---|---|---|---|---|
Conservative | Robin Bloore* | 596 | |||
Conservative | Keith Prew* | 492 | |||
Liberal Democrats | Ed Ralph | 333 | |||
Liberal Democrats | Don Mackinlay | 277 | |||
Independent | Martin Haley | 144 | |||
Labour | Steven Bracey | 132 | |||
Labour | Andrew Waters | 131 | |||
Turnout | 36.8 | ||||
Registered electors | |||||
Conservative win (new seat) | |||||
Conservative win (new seat) |
Party | Candidate | Votes | % | ±% | |
---|---|---|---|---|---|
Liberal Democrats | James Rujbally | 622 | |||
Liberal Democrats | Sarah Sowambur | 571 | |||
Conservative | Ankita Sharma | 423 | |||
Conservative | Charlie Kelly | 412 | |||
Conservative | Mike Steddy | 406 | |||
Labour | Robin Clements | 405 | |||
Labour | Roy Stewart | 360 | |||
Labour | Adam Avery | 345 | |||
Turnout | 28.2 | ||||
Registered electors | |||||
Liberal Democrats win (new seat) | |||||
Conservative win (new seat) |
Party | Candidate | Votes | % | ±% | |
---|---|---|---|---|---|
Whyteleafe Residents | Deano Cline | 441 | |||
Liberal Democrats | Jeffrey Gray* | 313 | |||
Whyteleafe Residents | Marcus Jones | 302 | |||
Liberal Democrats | Dave Evans | 233 | |||
Labour | Rosa Knight | 116 | |||
Conservative | Joseph Eve | 97 | |||
Conservative | Harry Millar | 85 | |||
Green | Jessica Hibberd | 53 | |||
Labour | Annie Weller | 52 | |||
Turnout | 30.2 | ||||
Registered electors | |||||
Residents win (new seat) | |||||
Liberal Democrats win (new seat) |
Party | Candidate | Votes | % | ±% | |
---|---|---|---|---|---|
Independent | Deborah Sherry | 477 | 70.8 | ||
Conservative | Sakina Bradbury | 120 | 17.8 | ||
Labour | Nathan Manning | 46 | 6.8 | ||
Liberal Democrats | Nick Pomery | 31 | 4.6 | ||
Turnout | 674 | 42.2 | |||
Registered electors | |||||
Independent win (new seat) |
Tandridge is a local government district in east Surrey, England. Its council is based in Oxted, although the largest settlement is Caterham; other notable settlements include Warlingham, Godstone and Lingfield. In mid-2019, the district had an estimated population of 88,129.
The Borough of Guildford is a local government district with borough status in Surrey, England. With around half of the borough's population, Guildford is its largest settlement and only town, and is where the council is based.
Oxted is a town and civil parish in the Tandridge district of Surrey, England, at the foot of the North Downs, 9 miles (14 km) south-east of Croydon, 9 miles (14 km) west of Sevenoaks, and 9 miles (14 km) north of East Grinstead.
East Surrey is a constituency represented in the House of Commons of the UK Parliament since 2019 by Claire Coutinho, a Conservative who formerly served as Secretary of State for Energy Security and Net Zero. The seat covers an affluent area in the English county of Surrey.
Limpsfield is a village and civil parish in Surrey, England, at the foot of the North Downs close to Oxted railway station and the A25. The composer Frederick Delius, orchestral conductor Sir Thomas Beecham and clarinettist Jack Brymer are buried in the village churchyard. The village contains 89 listed buildings.
Surrey County Council is the county council for the non-metropolitan county of Surrey, England. The council is composed of 81 elected councillors, and in all but one election since 1974 the Conservative Party has held the majority. The leader of the council is Tim Oliver.
East Hampshire District Council elections are held every four years to elect councillors to East Hampshire District Council in Hampshire, England. Since the last boundary changes in 2019 the council has comprised 43 councillors representing 31 wards, with each ward electing one, two or three councillors.
One third of Tandridge District Council in Surrey, England is elected each year, followed by one year when there is an election to Surrey County Council instead. Since the last boundary changes in 2000, 42 councillors have been elected from 20 wards.
The 2000 Tandridge District Council election took place on 4 May 2000 to elect members of Tandridge District Council in Surrey, England. The whole council was up for election, rather than the normal election by thirds, following boundary changes since the last election in 1999. There remained 42 seats on the council: six three-member wards, ten two-member wards and four one-member wards. The Conservative Party gained overall control of the council from no overall control.
The 2008 Tandridge District Council election took place on 1 May 2008 to elect members of Tandridge District Council in Surrey, England. One third of the council was up for election and the Conservative Party stayed in overall control of the council.
One third of Woking Borough Council in Surrey, England is elected each year, followed by one year without election. Since the last boundary changes in 2016, 30 councillors have been elected from 10 wards.
The 2010 Tandridge District Council election took place on 6 May 2010 to elect members of Tandridge District Council in Surrey, England. One third of the council was up for election and the Conservative Party stayed in overall control of the council.
The 2011 Tandridge District Council election took place on 5 May 2011 to elect members of Tandridge District Council in Surrey, England. One third of the council was up for election and the Conservative Party stayed in overall control of the council.
The 2012 Tandridge District Council election took place on 3 May 2012 to elect members of Tandridge District Council in Surrey, England. One third of the council was up for election and the Conservative Party stayed in overall control of the council.
The 2014 Tandridge District Council election took place on 22 May 2014 to elect members of Tandridge District Council in Surrey, England. One third of the council was up for election and the Conservative Party stayed in overall control of the council.
The 2016 Tandridge District Council election took place on 5 May 2016 to elect members of Tandridge District Council in England. This was on the same day as other local elections.
The 2018 Tandridge District Council election took place on 3 May 2018 to elect members of Tandridge District Council in Surrey, England. One third of the council was up for election and the Conservative Party narrowly stayed in overall control of the council.
The 2019 Tandridge District Council election took place on 2 May 2019 to elect one third of members to Tandridge District Council in England coinciding with other local elections
The 2023 Tandridge District Council election took place on 4 May 2023 to elect 14 members (one-third) of Tandridge District Council in Surrey, England. This was on the same day as other local elections across England.
The 2024 Fareham Borough Council election was held on Thursday 2 May 2024, alongside the other local elections in the United Kingdom. All 32 members of Fareham Borough Council in Hampshire were elected following boundary changes.