This article needs more links to other articles to help integrate it into the encyclopedia . (May 2015) (Learn how and when to remove this template message) |
The 2015 Cambridge City Council election took place on 7 May 2015 to elect members of Cambridge City Council in England as part of the English local elections of that year coinciding with the 2015 General Election. [1]
Cambridge City Council is a district council in the county of Cambridgeshire, based in the city of Cambridge.
A general election is an election in which all or most members of a given political body are chosen. These are usually held for a nation's primary legislative body, as distinguished from by-elections and local elections.
Party | Seats | Gains | Losses | Net gain/loss | Seats % | Votes % | Votes | +/− | |
---|---|---|---|---|---|---|---|---|---|
Labour | 24 [2] | 0 | 0 | 60 | 34.5 | 20,279 | -4.4 | ||
Liberal Democrat | 14 [2] | 0 | 0 | 31 | 27.6 | 16,257 | -3.0 | ||
Conservative | 1 [2] | 0 | 0 | 2 | 17.5 | 10,266 | +3.8 | ||
Green | 1 [2] | 1 | 0 | 2 | 16.5 | 9,675 | +2.8 | ||
Independent | 2 [2] | 0 | 0 | 5 | 0.2 | 89 | -2.7 | ||
UKIP | 0 | 0 | 0 | 0 | 3.8 | 2,261 | +3.8 | ||
Party | Candidate | Votes | % | ± | |
---|---|---|---|---|---|
Labour | Caroline Hart | 1,645 | 42.5 | -5.9 | |
Liberal Democrat | Nichola Martin | 831 | 21.5 | +4.9 | |
Green | Monica Hone | 701 | 18.1 | -2.6 | |
Conservative | David Cowan | 696 | 18.0 | +3.9 | |
Turnout | |||||
Labour hold | Swing | ||||
Party | Candidate | Votes | % | ± | |
---|---|---|---|---|---|
Labour | Carina O'Reilly | 1,673 | 39.1 | -6.5 | |
Liberal Democrat | Tim Ward | 1,165 | 27.2 | +1.9 | |
Conservative | Eric Barrett-Payton | 597 | 13.9 | +0.4 | |
Green | Stephen Lawrence | 568 | 13.3 | -2.3 | |
UKIP | Celia Conway | 281 | 6.6 | N/A | |
Turnout | |||||
Labour hold | Swing | ||||
Party | Candidate | Votes | % | ± | |
---|---|---|---|---|---|
Liberal Democrat | Valerie Holt | 1,288 | 30.1 | +3.6 | |
Labour | Patrick Sheil | 1,084 | 25.4 | -4.5 | |
Conservative | Simon Mitton | 951 | 22.3 | +11.9 | |
Green | Martin Bonner | 920 | 21.5 | +6.4 | |
Turnout | |||||
Liberal Democrat hold | Swing | ||||
Party | Candidate | Votes | % | ± | |
---|---|---|---|---|---|
Labour Co-op | Mark Ashton | 1,839 | 41.5 | -38.5 | |
Conservative | Timothy Haire | 843 | 19.0 | N/A | |
Liberal Democrat | Edward Sexton | 790 | 17.8 | -2.2 | |
UKIP | Alex Crowson | 393 | 8.9 | N/A | |
Green | Phillip Barnett | 364 | 8.2 | N/A | |
Turnout | |||||
Labour hold | Swing | ||||
Party | Candidate | Votes | % | ± | |
---|---|---|---|---|---|
Labour | Jeremy Benstead | 1,606 | 38.1 | -13.5 | |
Liberal Democrat | Simon Cooper | 1,044 | 24.8 | +9.8 | |
Conservative | Samuel Barker | 748 | 17.8 | +1.1 | |
Green | Shaun Esgate | 558 | 13.2 | -0.7 | |
UKIP | Bill Kaminski | 259 | 6.1 | N/A | |
Turnout | |||||
Labour hold | Swing | ||||
Party | Candidate | Votes | % | ± | |
---|---|---|---|---|---|
Labour | Gerri Bird | 1,630 | 38.9 | +3.4 | |
Liberal Democrat | Shahida Rahman | 1,165 | 27.8 | -7.4 | |
Conservative | Alex Boyd | 608 | 14.5 | +5.9 | |
Green | Peter Pope | 466 | 11.1 | +1.2 | |
UKIP | Pater Burkinshaw | 327 | 7.8 | -2.0 | |
Turnout | |||||
Labour hold | Swing | ||||
Party | Candidate | Votes | % | ± | |
---|---|---|---|---|---|
Labour | Kevin Price | 1,367 | 39.0 | -2.2 | |
Liberal Democrat | Hugh Newsam | 726 | 20.7 | -1.2 | |
Conservative | Anette Karimi | 552 | 15.7 | +2.5 | |
UKIP | Dave Corn | 419 | 12.0 | N/A | |
Green | Angela Ditchfield | 355 | 10.1 | -1.9 | |
Turnout | |||||
Labour hold | Swing | ||||
Party | Candidate | Votes | % | ± | |
---|---|---|---|---|---|
Green | Oscar Gillespie | 1,147 | 27.7 | +2.0 | |
Labour | Danielle Greene | 1,140 | 27.5 | -4.7 | |
Liberal Democrat | Dom Weldon | 1,134 | 27.4 | +2.9 | |
Conservative | Daniel Coughlan | 726 | 17.5 | -0.3 | |
Turnout | |||||
Green gain from Liberal Democrat | Swing | ||||
Party | Candidate | Votes | % | ± | |
---|---|---|---|---|---|
Liberal Democrat | Markus Gehring | 1,387 | 32.7 | -2.9 | |
Labour | Ewan McGaughey | 1,203 | 28.4 | -4.9 | |
Green | Kate Honey | 947 | 22.4 | +4.6 | |
Conservative | Sam Carr | 700 | 16.5 | +3.2 | |
Turnout | |||||
Liberal Democrat hold | Swing | ||||
Party | Candidate | Votes | % | ± | |
---|---|---|---|---|---|
Labour | Kevin Blencowe | 1,632 | 44.0 | -9.0 | |
Green | Atus Mariqueo-Russell | 864 | 23.3 | +8.7 | |
Liberal Democrat | Elizabeth Parkin | 795 | 21.4 | -0.6 | |
Conservative | Ben Flook | 422 | 11.4 | +2.5 | |
Turnout | |||||
Labour hold | Swing | ||||
Party | Candidate | Votes | % | ± | |
---|---|---|---|---|---|
Liberal Democrat | George Pippas | 1,502 | 33.7 | -8.9 | |
Labour | Matt Worth | 1,102 | 24.7 | -5.0 | |
Conservative | Andrew Bower | 1,093 | 24.5 | +8.2 | |
Green | Joel Chalfen | 546 | 12.3 | +0.9 | |
UKIP | Candido Channell | 213 | 4.8 | N/A | |
Turnout | |||||
Liberal Democrat hold | Swing | ||||
Party | Candidate | Votes | % | ± | |
---|---|---|---|---|---|
Labour | Anna Smith | 1,636 | 37.7 | -3.9 | |
Liberal Democrat | Donald Adey | 1,314 | 30.3 | -7.5 | |
Green | Jane Carpenter | 951 | 21.9 | +8.0 | |
Conservative | Rahatul Raja | 436 | 10.1 | +3.0 | |
Turnout | |||||
Labour hold | Swing | ||||
Party | Candidate | Votes | % | ± | |
---|---|---|---|---|---|
Liberal Democrat | Zoe O'Connell | 1,498 | 29.9 | -16.3 | |
Conservative | Daniel John | 1,366 | 27.3 | -7.6 | |
Labour | Nick Gay | 1,182 | 23.6 | +4.5 | |
Green | Ceri Galloway | 751 | 15.0 | N/A | |
UKIP | Richard Jeffs | 213 | 4.6 | N/A | |
Turnout | |||||
Liberal Democrat hold | Swing | ||||
Party | Candidate | Votes | % | ± | |
---|---|---|---|---|---|
Liberal Democrat | Damien Tunnacliffe | 1,618 | 37.0 | -2.9 | |
Labour | Mike Sargeant | 1,540 | 35.2 | +4.8 | |
Green | Har Kaur | 537 | 12.3 | +1.7 | |
Conservative | Linda Yeatman | 528 | 12.1 | +1.3 | |
UKIP | Mary King | 156 | 3.6 | N/A | |
Turnout | |||||
Liberal Democrat hold | Swing | ||||
The City of Lancaster is a local government district of Lancashire, England, with the status of a city and non-metropolitan district. It is named after its largest settlement, Lancaster, but covers a far larger area, which includes the towns of Morecambe, Heysham, and Carnforth, as well as outlying villages, farms, rural hinterland and a section of the Yorkshire Dales National Park. The district has a population of 142,500 (mid-2017 est.), and an area of 222.5 square miles (576.2 km2).
The City of Perth is a local government area and body, within the Perth metropolitan area, which is the capital of Western Australia. The local government is commonly known as Perth City Council. The City covers the Perth city centre and surrounding suburbs. The City covers an area of 20.01 square kilometres (8 sq mi) and had an estimated population of 21,092 as at 30 June 2015. On 1 July 2016 the City expanded, absorbing 1,247 residents from the City of Subiaco. The Perth City Council was suspended on 2 March 2018, pending the establishment of a public inquiry into the council, by Local Government Minister David Templeman. The council has been administered by three Commissioners since then.
One third of Cambridge City Council is elected each year, followed by one year without election.
Cambridgeshire County Council is elected every four years by the first past the post system of election. The council currently consists of 69 councillors, representing 60 electoral divisions. The Conservative Party is currently the largest party on the council, having lost overall control in the 2013 local elections. The council meets at Shire Hall in Cambridge, on the site of Cambridge Castle's bailey and a 19th-century prison.
Elections for Cambridge City Council were held on Thursday 4 May 2006. As Cambridge City Council is elected by thirds, one seat in each of the city's 14 wards was up for election. The exception was Romsey, where two seats were up for election as a by-election for the other seat was held on the same day. Therefore, 15 of the 42 seats on the Council were up for election. Overall turnout was 34.4%, down from 37.0% in 2004. The lowest turnout (28.4%) was in Abbey ward and the highest (40.8%) in Queen Edith's.
Westminster City Council, the local authority of the City of Westminster in London, England, is elected every four years. Since the last boundary changes in 2002, 60 councillors have been elected from 20 wards.
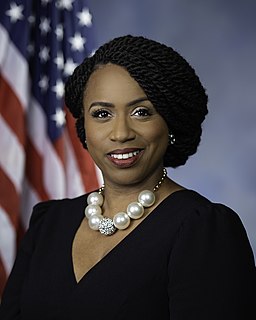
Ayanna Soyini Pressley is an American politician who is the member of the United States House of Representatives from Massachusetts's 7th congressional district. The district, which was once represented by John F. Kennedy and Tip O'Neill, includes the northern three-fourths of Boston, most of Cambridge, and all of Chelsea and Somerville. She is a Democrat.
Elections for Cambridge City Council were held on Thursday 5 May 2011. As the council is elected by thirds, one seat in each of the wards was up for election, with the exception of Cherry Hinton ward where two seats were up for election due to the early retirement of Councillor Stuart Newbold. The vote took place alongside the United Kingdom Alternative Vote referendum, 2011 and a Cambridgeshire County Council by-election for Arbury ward.
Elections for Cambridge City Council were held on Thursday 3 May 2012. One third of the council was up for election and the Liberal Democrats lost overall control of the council, to No Overall Control.
The 2015 by-thirds election to Preston City Council took place on 7 May 2015 as part of the United Kingdom local elections, 2015 on the same day as the general election to elect approximately one-third of councillors for a four-year term.
The 2015 Salford City Council election took place on 7 May 2015 to elect members of Salford City Council in England. This was the same day as other local elections, and the United Kingdom general election, 2015. The last time these seats were contested was in 2011.
The 2015 Liverpool City Council election took take place on 7 May 2015 to elect members of Liverpool City Council in England. This was on the same day as other local elections.
Elections to Manchester City Council were held on 7 May 2015, along with the United Kingdom general election, 2015. One third of the council was up for election, with each successful candidate serving a four-year term of office, expiring in 2019. The Labour Party retained overall control of the council, managing to hold every seat contested.
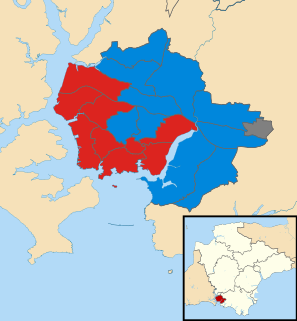
The 2015 Plymouth City Council election took place on 7 May 2015 to elect members of Plymouth City Council in England.
The 2016 Liverpool City Council election took place on 5 May 2016 to elect members of Liverpool City Council in England. This was on the same day as the election for the Elected Mayor of Liverpool and the Police and Crime Commissioner for Merseyside.
The 2016 Cambridge City Council election took place on 5 May 2016 to elect members of Cambridge City Council in England. This was on the same day as other nationwide local elections. The Labour Party grouping gained two seats from the Liberal Democrats, increasing their majority on the council from 6 to 10 seats.
The inaugural Cambridgeshire and Peterborough mayoral election was held on 4 May 2017 to elect the Mayor of Cambridgeshire and Peterborough. The supplementary vote system was used to elect the mayor for a four-year term of office. Subsequent elections will be held in May 2021 and every four years after.
The 2018 Cambridge City Council election took place on 3 May 2018 to elect members of Cambridge City Council in England. This was on the same day as other nationwide local elections.