
The economy of Canada is a highly developed mixed economy, with the world's tenth-largest economy as of 2023, and a nominal GDP of approximately US$2.117 trillion. Canada is one of the world's largest trading nations, with a highly globalized economy. In 2021, Canadian trade in goods and services reached $2.016 trillion. Canada's exports totalled over $637 billion, while its imported goods were worth over $631 billion, of which approximately $391 billion originated from the United States. In 2018, Canada had a trade deficit in goods of $22 billion and a trade deficit in services of $25 billion. The Toronto Stock Exchange is the tenth-largest stock exchange in the world by market capitalization, listing over 1,500 companies with a combined market capitalization of over US$3 trillion.
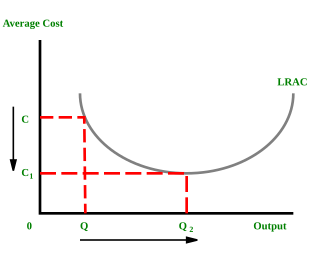
In microeconomics, economies of scale are the cost advantages that enterprises obtain due to their scale of operation, and are typically measured by the amount of output produced per unit of time. A decrease in cost per unit of output enables an increase in scale that is, increased production with lowered cost. At the basis of economies of scale, there may be technical, statistical, organizational or related factors to the degree of market control.

Gross domestic product (GDP) is a monetary measure of the market value of all the final goods and services produced and rendered in a specific time period by a country or countries. GDP is often used to measure the economic health of a country or region. Definitions of GDP are maintained by several national USD international economic organizations, such as the OECD and the International Monetary Fund.

Macroeconomics is a branch of economics that deals with the performance, structure, behavior, and decision-making of an economy as a whole. This includes national, regional, and global economies. Macroeconomists study topics such as output/GDP and national income, unemployment, price indices and inflation, consumption, saving, investment, energy, international trade, and international finance.

The economy of North Macedonia has become more liberalized, with an improved business environment, since its independence from Yugoslavia in 1991, which deprived the country of its key protected markets and the large transfer payments from Belgrade. Prior to independence, North Macedonia was Yugoslavia's poorest republic. An absence of infrastructure, United Nations sanctions on its largest market, and a Greek economic embargo hindered economic growth until 1996.
In economics, a recession is a business cycle contraction that occurs when there is a period of broad decline in economic activity. Recessions generally occur when there is a widespread drop in spending. This may be triggered by various events, such as a financial crisis, an external trade shock, an adverse supply shock, the bursting of an economic bubble, or a large-scale anthropogenic or natural disaster. But there is no official definition of a recession, according to the IMF.

In economics, inflation is a general increase in the prices of goods and services in an economy. This is usually measured using the consumer price index (CPI). When the general price level rises, each unit of currency buys fewer goods and services; consequently, inflation corresponds to a reduction in the purchasing power of money. The opposite of CPI inflation is deflation, a decrease in the general price level of goods and services. The common measure of inflation is the inflation rate, the annualized percentage change in a general price index. As prices faced by households do not all increase at the same rate, the consumer price index (CPI) is often used for this purpose.
An economic indicator is a statistic about an economic activity. Economic indicators allow analysis of economic performance and predictions of future performance. One application of economic indicators is the study of business cycles. Economic indicators include various indices, earnings reports, and economic summaries: for example, the unemployment rate, quits rate, housing starts, consumer price index, Inverted yield curve, consumer leverage ratio, industrial production, bankruptcies, gross domestic product, broadband internet penetration, retail sales, price index, and changes in credit conditions.
An interest rate is the amount of interest due per period, as a proportion of the amount lent, deposited, or borrowed. The total interest on an amount lent or borrowed depends on the principal sum, the interest rate, the compounding frequency, and the length of time over which it is lent, deposited, or borrowed.

Within the budgetary process, deficit spending is the amount by which spending exceeds revenue over a particular period of time, also called simply deficit, or budget deficit, the opposite of budget surplus. The term may be applied to the budget of a government, private company, or individual. A central point of controversy in economics, government deficit spending was first identified as a necessary economic tool by John Maynard Keynes in the wake of the Great Depression.

X-inefficiency is a concept used in economics to describe instances where firms go through internal inefficiency resulting in higher production costs than required for a given output. This inefficiency is a result of various factors such as outdated technology, inefficient production processes, poor management and lack of competition resulting in lower profits and higher prices for consumers. The concept of X-inefficiency was introduced by Harvey Leibenstein.
Real gross domestic product is a macroeconomic measure of the value of economic output adjusted for price changes. This adjustment transforms the money-value measure, nominal GDP, into an index for quantity of total output. Although GDP is total output, it is primarily useful because it closely approximates the total spending: the sum of consumer spending, investment made by industry, excess of exports over imports, and government spending. Due to inflation, GDP increases and does not actually reflect the true growth in an economy. That is why the GDP must be divided by the inflation rate to get the growth of the real GDP. Different organizations use different types of 'Real GDP' measures, for example, the UNCTAD uses 2015 Constant prices and exchange rates while the FRED uses 2009 constant prices and exchange rates, and recently the World Bank switched from 2005 to 2010 constant prices and exchange rates.
In economics, potential output refers to the highest level of real gross domestic product that can be sustained over the long term. Actual output happens in real life while potential output shows the level that could be achieved.
The Taylor rule is a monetary policy targeting rule. The rule was proposed in 1992 by American economist John B. Taylor for central banks to use to stabilize economic activity by appropriately setting short-term interest rates. The rule considers the federal funds rate, the price level and changes in real income. The Taylor rule computes the optimal federal funds rate based on the gap between the desired (targeted) inflation rate and the actual inflation rate; and the output gap between the actual and natural output level. According to Taylor, monetary policy is stabilizing when the nominal interest rate is higher/lower than the increase/decrease in inflation. Thus the Taylor rule prescribes a relatively high interest rate when actual inflation is higher than the inflation target.

The real interest rate is the rate of interest an investor, saver or lender receives after allowing for inflation. It can be described more formally by the Fisher equation, which states that the real interest rate is approximately the nominal interest rate minus the inflation rate.

The industrial sector comprises 39.4% of the gross domestic product (GDP) of the People's Republic of China in 2022. In 2007, industry contributed 46.7 percent of GDP in 2010 and occupied 27 percent of the workforce. In 2015, the manufacturing industrial sectors contributed to 40% of China's GDP. The manufacturing sector produced 44.1 percent of GDP in 2004 and accounted for 11.3 percent of total employment in 2006.

The 1965 Soviet economic reform, sometimes called the Kosygin reform or Liberman reform, named after E.G. Liberman, was a set of planned changes in the economy of the USSR. A centerpiece of these changes was the introduction of profitability and sales as the two key indicators of enterprise success. Some of an enterprise's profits would go to three funds, used to reward workers and expand operations; most would go to the central budget.
In the Philippines, monetary policy is the way the central bank, the Bangko Sentral ng Pilipinas, controls the supply and availability of money, the cost of money, and the rate of interest. With fiscal policy, monetary policy allows the government to influence the economy, control inflation, and stabilize currency.
Inflation rate in India was 4.83% as of April 2024, as per the Indian Ministry of Statistics and Programme Implementation. This represents a modest reduction from the previous figure of 5.69% for December 2023. CPI for the months of January, February and March 2024 are 5.10, 5.09 and 4.85 respectively. Inflation rates in India are usually quoted as changes in the Consumer Price Index (CPI), for all commodities.
This glossary of economics is a list of definitions of terms and concepts used in economics, its sub-disciplines, and related fields.
