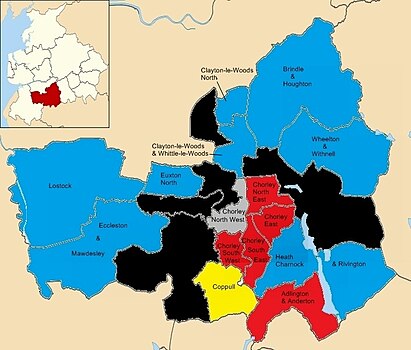
Elections to Chorley Borough Council were held on 3 May 2012. One third of the council was up for election and the Labour party won majority control from the Conservative-Liberal Democrat Coalition. Labour gaining control of this council was notable as David Cameron visited the town in 2006 when the Conservative Party gained control saying "this is the beginning." [1] Nick Robinson of the BBC asked on the election coverage, "then what is it now?"
An election is a formal group decision-making process by which a population chooses an individual to hold public office. Elections have been the usual mechanism by which modern representative democracy has operated since the 17th century. Elections may fill offices in the legislature, sometimes in the executive and judiciary, and for regional and local government. This process is also used in many other private and business organizations, from clubs to voluntary associations and corporations.
The Labour Party is a centre-left political party in the United Kingdom which has been described as an alliance of social democrats, democratic socialists and trade unionists. The party's platform emphasises greater state intervention, social justice and strengthening workers' rights.
The Conservative Party, officially the Conservative and Unionist Party, is a centre-right political party in the United Kingdom. Presently led by Theresa May, it has been the governing party since 2010. It presently has 314 Members of Parliament in the House of Commons, 249 members of the House of Lords, and 18 members of the European Parliament. It also has 31 Members of the Scottish Parliament, 12 members of the Welsh Assembly, eight members of the London Assembly and 9,008 local councillors. One of the major parties of UK politics, it has formed the government on 45 occasions, more than any other party.
After the election, the composition of the council was:
Party | Seats | Current Council (2012) | |||||||||||||||||||||||||||||||||||||||||||||||||
---|---|---|---|---|---|---|---|---|---|---|---|---|---|---|---|---|---|---|---|---|---|---|---|---|---|---|---|---|---|---|---|---|---|---|---|---|---|---|---|---|---|---|---|---|---|---|---|---|---|---|---|
2010 | 2011 | 2012 | |||||||||||||||||||||||||||||||||||||||||||||||||
Labour | 15 | 20 | 24 | ||||||||||||||||||||||||||||||||||||||||||||||||
Conservative | 27 | 23 | 20 | ||||||||||||||||||||||||||||||||||||||||||||||||
Independent | 2 | 2 | 2 | ||||||||||||||||||||||||||||||||||||||||||||||||
Lib Dems | 3 | 2 | 1 |
Party | Seats | Gains | Losses | Net gain/loss | Seats % | Votes % | Votes | +/− | |
---|---|---|---|---|---|---|---|---|---|
Labour | 11 | 4 | 0 | +4 | 68.8 | 53.4 | 14,194 | +3.4 | |
Conservative | 4 | 0 | 3 | −3 | 25.0 | 32.1 | 8,531 | −5.9 | |
Independent | 1 | 0 | 0 | 0 | 6.3 | 7.2 | 1,906 | +5.2 | |
UKIP | 0 | 0 | 0 | 0 | 0 | 4.1 | 1,088 | +0.1 | |
Liberal Democrat | 0 | 0 | 1 | −1 | 0 | 2.1 | 555 | −3.9 | |
Green | 0 | 0 | 0 | 0 | 0 | 1.1 | 293 | +1.1 | |
Party | Candidate | Votes | % | ± | |
---|---|---|---|---|---|
Labour | 1,290 | ||||
Labour | 1,241 | ||||
Conservative | Mike Devaney | 580 | |||
Conservative | Elliot Matthews | 473 | |||
UKIP | Hayden Clewlow | 340 | |||
Turnout | 3,924 | ||||
Labour hold | Swing | ||||
Party | Candidate | Votes | % | ± | |
---|---|---|---|---|---|
Conservative | 430 | 63.7 | −17.9 | ||
Labour | Chris Caton | 244 | 36.3 | +17.9 | |
Majority | 186 | 27.6 | |||
Turnout | 674 | 39.2 | |||
Conservative hold | Swing | −17.9 | |||
Party | Candidate | Votes | % | ± | |
---|---|---|---|---|---|
Labour Co-op | 1,151 | 74.4 | −2.0 | ||
Conservative | Simon Parkinson | 253 | 16.5 | +1 | |
Green | Alan Leach | 144 | 9.3 | N/A | |
Majority | 898 | 58.0 | −2.0 | ||
Turnout | 1,548 | 31.9 | |||
Labour hold | Swing | −1.0 | |||
Party | Candidate | Votes | % | ± | |
---|---|---|---|---|---|
Labour | 1,068 | 63.9 | −2.0 | ||
Conservative | Sandra Mercer | 311 | 18.6 | −15.0 | |
UKIP | Tommy Shorrock | 223 | 13.3 | N/A | |
Green | Stephen Cross | 69 | 4.1 | N/A | |
Majority | 757 | 45.3 | +13 | ||
Turnout | 1,671 | 33.4 | |||
Labour hold | Swing | +7 | |||
Party | Candidate | Votes | % | ± | |
---|---|---|---|---|---|
Independent | 1,755 | 72 | −11.0 | ||
Labour | Geoffrey O'Donoghue | 476 | 19 | +19 | |
Conservative | David Metcalfe | 218 | 9 | −3.0 | |
Majority | 1279 | 52 | |||
Turnout | 2,449 | 51.9 | |||
Independent hold | Swing | −15.0 | |||
N.B. Percentage change is taken from when a Snape last faced the electorate.
Party | Candidate | Votes | % | ± | |
---|---|---|---|---|---|
Labour Co-op | 1,079 | 59.4 | +8 | ||
Conservative | Samuel Andrew Chapman | 505 | 27.8 | −6 | |
Independent | Glynn Hughes | 151 | 8.3 | N/A | |
Green | Alistair James Straw | 80 | 4.4 | N/A | |
Majority | 574 | 31.6 | +14 | ||
Turnout | 1,815 | 36.2 | |||
Labour hold | Swing | +7 | |||
Party | Candidate | Votes | % | ± | |
---|---|---|---|---|---|
Labour | 1,087 | 70.2 | +13 | ||
Conservative | Terry Cook | 462 | 29.8 | +5 | |
Majority | 625 | 40.3 | +8 | ||
Turnout | 1,549 | 26.7 | |||
Labour hold | Swing | +4 | |||
Party | Candidate | Votes | % | ± | |
---|---|---|---|---|---|
Conservative | 1,220 | 58.6 | +10 | ||
Labour | Frances Maguire | 861 | 41.4 | +8 | |
Majority | 359 | 17.3 | |||
Turnout | 2,081 | 34.5 | |||
Conservative hold | Swing | +1 | |||
Party | Candidate | Votes | % | ± | |
---|---|---|---|---|---|
Labour | 1,000 | 58.4 | +13 | ||
Conservative | Alan Cullens | 711 | 41.6 | +6 | |
Majority | 289 | 17 | +8 | ||
Turnout | 1,711 | 33.2 | |||
Labour gain from Conservative | Swing | +4 | |||
Party | Candidate | Votes | % | ± | |
---|---|---|---|---|---|
Labour | 1,017 | 57.3 | +2 | ||
Liberal Democrat | Stella Walsh | 555 | 31.3 | −2.0 | |
Conservative | Peter Malpas | 201 | 11.3 | −1 | |
Majority | 462 | 26.1 | +4 | ||
Turnout | 1,773 | 36.9 | |||
Labour gain from Liberal Democrat | Swing | +2 | |||
Party | Candidate | Votes | % | ± | |
---|---|---|---|---|---|
Conservative | 1,009 | 46.6 | −10.1 | ||
Labour | Stanley Joseph Ely | 914 | 42.2 | −0.1 | |
UKIP | Robert Keane | 241 | 11.1 | N/A | |
Majority | 95 | 4.4 | −10.0 | ||
Turnout | 2,164 | 45.0 | |||
Conservative hold | Swing | −5 | |||
Party | Candidate | Votes | % | ± | |
---|---|---|---|---|---|
Labour | 847 | 53.8 | +7 | ||
Conservative | Debra Platt | 549 | 34.9 | −12 | |
UKIP | Jeffrey Flinders Mallinson | 179 | 11.4 | N/A | |
Majority | 298 | 18.9 | +26 | ||
Turnout | 1,575 | 45.1 | |||
Labour gain from Conservative | Swing | +10 | |||
Party | Candidate | Votes | % | ± | |
---|---|---|---|---|---|
Labour | 475 | 55.4 | +27 | ||
Conservative | Barbara Catterall | 278 | 32.4 | −40.0 | |
UKIP | Nigel Cecil | 105 | 12.2 | N/A | |
Majority | 197 | 23.0 | +68 | ||
Turnout | 858 | 48.8 | |||
Labour gain from Conservative | Swing | +34 | |||
Party | Candidate | Votes | % | ± | |
---|---|---|---|---|---|
Conservative | 708 | 56.0 | +13 | ||
Labour | Alan Whittaker | 556 | 44.0 | +24 | |
Majority | 152 | 12.0 | +6 | ||
Turnout | 1,264 | 37.4 | |||
Conservative hold | Swing | −6.0 | |||
Party | Candidate | Votes | % | ± | |
---|---|---|---|---|---|
Labour | 888 | 58.8 | +12.0 | ||
Conservative | David Morgan | 623 | 41.2 | −12.0 | |
Majority | 265 | 17.5 | +24 | ||
Turnout | 1,511 | 47.2 | |||
Labour hold | Swing | +12.0 | |||
Bassetlaw is the northernmost district of Nottinghamshire, England, with a population of 114,143 according to the mid-2014 estimate by the Office for National Statistics. The borough is predominantly rural, with two towns: Worksop, site of the borough council offices, and Retford. The district was formed on 1 April 1974 by the merger of the boroughs of Worksop and East Retford and most of Worksop Rural District and most of East Retford Rural District. It is named after the historic Bassetlaw wapentake of Nottinghamshire.
In the context of local authorities in the United Kingdom, the term no overall control refers to a situation in which no single political group achieves a majority of seats; and is analogous to a hung parliament. Of the 310 councils who had members up for election in the 2007 local elections, 85 resulted in a NOC administration.
Local elections took place in some parts of the UK on 7 June 2001. Elections took place for all of the English shire counties, some English unitary authorities and all of the Northern Ireland districts. The elections were delayed from the usual date of the first Thursday in May due to the 2001 UK foot and mouth crisis and were held on the same day as the general election.
Elections to Chorley Borough Council were held on 4 May 2006. One third of the council was up for election and the Conservative party gained overall control of the council from no overall control.
The 2003 South Lakeland District Council election took place on 1 May 2003 to elect members of South Lakeland District Council in Cumbria, England. One third of the council was up for election and the council stayed under no overall control.
The 1999 Craven District Council election took place on 6 May 1999 to elect members of Craven District Council in North Yorkshire, England. One third of the council was up for election and the Conservative party gained overall control of the council from no overall control.
Elections to Rossendale Borough Council were held on 1 May 2008. One third of the council was up for election and the Conservative party gained overall control of the council from no overall control. Overall turnout was up by one per cent from the last election in 2007 at 36.3%.
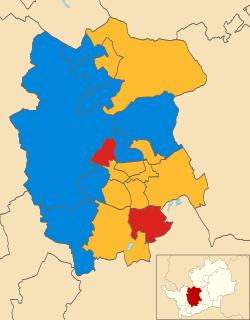
The 2006 St Albans City and District Council election took place on 4 May 2006 to elect members of St Albans District Council in Hertfordshire, England. One third of the council was up for election and the Liberal Democrats gained overall control of the council from no overall control.
Local elections were held in the United Kingdom on 3 May 1979. The results provided some source of comfort to the Labour Party (UK), who recovered some lost ground from local election reversals in previous years, despite losing the general election to the Conservative Party on the same day.
The 2010 West Lancashire Borough Council election took place on 6 May 2010 to elect members of West Lancashire Borough Council in Lancashire, England. One third of the council was up for election and the Conservative party stayed in overall control of the council.
Elections to Broxtowe Borough Council were held on 5 May 2011 to elect all 44 members to the Council.
The 1999 Solihull Metropolitan Borough Council election took place on 6 May 1999 to elect members of Solihull Metropolitan Borough Council in the West Midlands, England. One third of the council was up for election and the council stayed under no overall control.
The 2008 Sandwell Metropolitan Borough Council election took place on 1 May 2008 to elect members of Sandwell Metropolitan Borough Council in the West Midlands, England. One third of the council was up for election and the Labour party stayed in overall control of the council.
The 2011 Gedling Borough Council election took place on 5 May 2011 to elect members of Gedling Borough Council in Nottinghamshire, England. The whole council was up for election and the Labour party gained overall control of the council from the Conservative party.
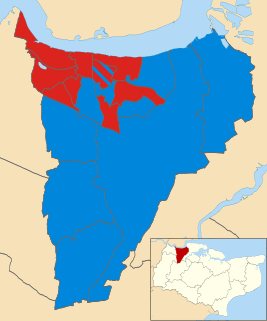
The 2011 Gravesham Borough Council election took place on 5 May 2011 to elect members of Gravesham Borough Council in Kent, England. The whole council was up for election and the Labour party gained overall control of the council from the Conservative party.
The 2012 Harlow District Council election took place on 3 May 2012 to elect members of Harlow District Council in Essex, England. One third of the council was up for election and the Labour party gained overall control of the council from the Conservative party.
The 2014 Harlow District Council election took place on 22 May 2014 to elect members of Harlow District Council in Essex, England. One third of the council was up for election and the Labour party stayed in overall control of the council.
The 2010 Brent London Borough Council election took place on 6 May 2010 to elect members of Brent London Borough Council in London, England. The whole council was up for election and the Labour party gained overall control of the council from no overall control.
The 2014 Brent London Borough Council election took place on 22 May 2014 to elect members of Brent London Borough Council in London, England. The whole council was up for election and the Labour Party stayed in overall control of the council.
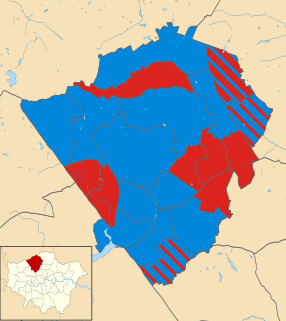
The 2018 Barnet Council election took place on 3 May 2018 to elect members of Barnet Borough Council in England. It took place on the same day as other local elections in 2018. In the last election, the Conservatives won control of the council with 32 seats, compared to 30 for Labour and 1 for the Liberal Democrats. On 15 March 2018, following the resignation of a Conservative councillor, the council was in a state of no overall control. The election on 3 May 2018 saw the Conservatives take back overall control with a majority of 13.