Emalahleni Local Municipality, Mpumalanga

Last updated
Emalahleni
Ezinambeni
Enambeni
Emalahleni Mpumalanga CoA.png
Map of Mpumalanga with Emalahleni highlighted.svg
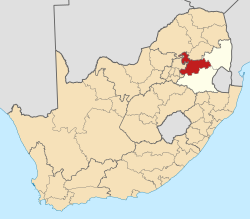
Location in Mpumalanga
Coordinates: 26°0′S29°10′E / 26.000°S 29.167°E / -26.000; 29.167
Country South Africa
Province Mpumalanga
District Nkangala
Seat eMalahleni
Wards 34
Government
[1]
  Type Municipal council
  Mayor Connie Kantshalintshali (ANC)
Area
  Total
2,678 km2 (1,034 sq mi)
Population
 (2023) [2]
  Total
395,466
  Density147.7/km2 (382.5/sq mi)
Racial makeup (2023)
[2]
   Black African 81.3%
   White 15.7%
   Coloured 1.7%
   Indian/Asian 0.9%
First languages (2011)
[3]
   IsiZulu 38.6%
   Afrikaans 14.9%
   Sepedi 11.3%
   IsiNdebele 8.9%
   SiSwati 5.8%
   English 5.6%
   Xitsonga 3.5%
   Sesotho 3.2%
   IsiXhosa 3.1%
  Other4%
Time zone UTC+2 (SAST)
Municipal codeMP312

Emalahleni Municipality (Zulu : UMasipala wase Malahleni; Afrikaans : Emlahleni Munisipaliteit; Northern Sotho : Mmasepala wa Emalahleni) is a local municipality within the Nkangala District Municipality, in the Mpumalanga province of South Africa. eMalahleni is a Nguni word meaning place of coal. [4]

Contents

Main places

The 2001 census divided the municipality into the following main places:

PlaceCodeArea (km2)PopulationMost spoken language
Boschmans Colliery 80901 0.633 Xhosa
Clewer 80902 36.522,657 Zulu
Coalville 80903 1.33154 Afrikaans
Cologne 80904 0.45120Zulu
Coronation 80905 0.966 Southern Ndebele
eMalahleni 80948 240.3961,093Afrikaans
Greenside Colliery 80907 10.861,314Afrikaans
Hlalanikahle 80908 4.3827,092Zulu
Ikageng 80909 0.46311Zulu
Kendal 80910 32.65285Zulu
Khutala Colliery 80911 0.580-
Klarinet 80912 0.52195 Northern Sotho
Klipplaat 80913 0.14249Zulu
Klippoortjie 80914 0.99382Zulu
Kriel 80915 37.8711,695Afrikaans
KwaGuqa Part 1 80916 1.878,005Northern Sotho
KwaGuqa Part 2 80918 8.5767,461Zulu
KwaGuqa Part 3 80919 0.09189Zulu
KwaGuqa Part 4 80920 0.211,997Northern Sotho
KwaGuqa Part 5 80917 0.05510Northern Sotho
Landau Colliery 80921 4.711,707Zulu
Lehlaka Park 80922 1.852,867Zulu
Lekama 80923 0.48283Zulu
Madressa 80924 0.63189Zulu
Matla Coal Mine 80925 1.041,207Xhosa
Naauwpoort 80926 0.501,782Zulu
New Largo 80927 26.50797Zulu
Ogies 80928 1.50897Afrikaans
Pambili 80929 0.43108Northern Sotho
Paxton 80930 1.001,410Zulu
Phoenix Colliery 80931 2.6999Afrikaans
Phola 80932 3.2622,864Zulu
Pine Ridge 80933 1.07898 English
Reedstream Park 80934 1.19905Zulu
Rethabile 80935 1.12762Xhosa
Rietspruit Opencast Mine 80936 51.22292Southern Ndebele
Saaiwater 80937 0.12270Zulu
Soetvelde 80938 0.21118Zulu
Springbok 80939 0.90369Afrikaans
Tavistock Colliery 80940 0.660-
Thubelihle 80941 0.965,746Zulu
Travistock South 80943 0.47307Afrikaans
Travistock 80942 0.47709Zulu
Tweefontein 80944 0.93650Afrikaans
Vandyksdrif 80945 2.562,010 Sotho
Voltargo 80946 0.43237Zulu
Vosman 80947 2.1513,126Zulu
Witbank Consolidated Colliery 80949 0.13249 Tsonga
Witcons 80950 0.63184Afrikaans
Wolwekrans 80951 1.40463Afrikaans
Zaaiwater 80952 0.2321Southern Ndebele
Remainder of the municipality 80906 2,182.0631,209Zulu

Politics

The municipal council consists of sixty-eight members elected by mixed-member proportional representation. Thirty-four are elected by first-past-the-post voting in thirty-four wards, while the remaining thirty-four are chosen from party lists so that the total number of party representatives is proportional to the number of votes received. In the election of 1 November 2021 the African National Congress (ANC) won a majority of thirty-five seats on the council.

The following table shows the results of the election. [5]

PartyWardListTotal
seats
Votes%SeatsVotes%Seats
African National Congress 36,30250.332836,66550.83735
Economic Freedom Fighters 14,53620.15014,99420.791414
Democratic Alliance 13,27618.41613,19818.30713
Freedom Front Plus 4,0395.6003,9445.4744
Independent candidates 1,7782.4600
African Independent Congress 6140.8507801.0811
African Christian Democratic Party 6640.9206350.8811
10 other parties9231.2801,9212.6600
Total72,132100.003472,137100.003468
Valid votes72,13298.2272,13798.10
Invalid/blank votes1,3071.781,3981.90
Total votes73,439100.0073,535100.00
Registered voters/turnout186,76339.32186,76339.37

References

  1. "Contact list: Executive Mayors". Government Communication & Information System. Archived from the original on 14 July 2010. Retrieved 22 February 2012.
  2. 1 2 "Local Municipality". Statistics South Africa. Retrieved 11 September 2013.
  3. "Statistics by place". Statistics South Africa. Retrieved 27 September 2015.
  4. South African Languages - Place names
  5. "Election Result Table for LGE2021 — Emalahleni". wikitable.frith.dev. Retrieved 2022-06-27.