Flushing, Ohio

Last updated

Flushing, Ohio
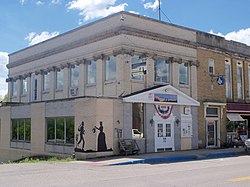
Underground Railroad Museum, Flushing, Ohio.JPG
The Underground Railroad Museum on High Street
OHMap-doton-Flushing.png
Location of Flushing, Ohio
Map of Belmont County Ohio Highlighting Flushing Village.png
Location of Flushing in Belmont County
Coordinates: 40°08′53″N81°03′52″W / 40.14806°N 81.06444°W / 40.14806; -81.06444
Country United States
State Ohio
County Belmont
Township Flushing
Area
[1]
  Total
0.61 sq mi (1.59 km2)
  Land0.61 sq mi (1.59 km2)
  Water0.00 sq mi (0.00 km2)
Elevation
[2]
1,273 ft (388 m)
Population
 (2020)
  Total
830
  Estimate 
(2023) [3]
807
  Density1,351.79/sq mi (522.31/km2)
Time zone UTC-5 (Eastern (EST))
  Summer (DST) UTC-4 (EDT)
ZIP code
43977
Area code 740
FIPS code 39-27552 [4]
GNIS feature ID2398890 [2]

Flushing is a village in Belmont County, Ohio, United States. The population was 830 at the 2020 census.

Contents

History

Flushing was platted in 1813. [5] The village was incorporated in 1849. [6]

Geography

According to the United States Census Bureau, the village has a total area of 0.61 square miles (1.58 km2), all land. [7]

Demographics

Historical population
CensusPop.Note
1850 325
1870 206
1880 33462.1%
1890 52858.1%
1900 65323.7%
1910 86832.9%
1920 1,02618.2%
1930 1,1199.1%
1940 1,2178.8%
1950 1,158−4.8%
1960 1,1892.7%
1970 1,2071.5%
1980 1,2664.9%
1990 1,042−17.7%
2000 900−13.6%
2010 879−2.3%
2020 830−5.6%
2023 (est.)807 [3] −2.8%
U.S. Decennial Census [8]
Flushing Municipal Building Flushing, Ohio Municipal Building.JPG
Flushing Municipal Building

2010 census

As of the census [9] of 2010, there were 879 people, 384 households, and 225 families living in the village. The population density was 1,441.0 inhabitants per square mile (556.4/km2). There were 426 housing units at an average density of 698.4 per square mile (269.7/km2). The racial makeup of the village was 97.6% White, 1.4% African American, 0.2% Native American, and 0.8% from two or more races. Hispanic or Latino of any race were 0.7% of the population.

There were 384 households, of which 27.3% had children under the age of 18 living with them, 45.1% were married couples living together, 10.9% had a female householder with no husband present, 2.6% had a male householder with no wife present, and 41.4% were non-families. 35.2% of all households were made up of individuals, and 16.4% had someone living alone who was 65 years of age or older. The average household size was 2.29 and the average family size was 2.94.

The median age in the village was 40.7 years. 22.5% of residents were under the age of 18; 5.7% were between the ages of 18 and 24; 27.7% were from 25 to 44; 27.9% were from 45 to 64; and 16.3% were 65 years of age or older. The gender makeup of the village was 49.1% male and 50.9% female.

2000 census

As of the census [4] of 2000, there were 900 people, 380 households, and 250 families living in the village. The population density was 1,491.0 inhabitants per square mile (575.7/km2). There were 434 housing units at an average density of 719.0 per square mile (277.6/km2). The racial makeup of the village was 98.56% White, 1.00% African American, 0.11% Native American, 0.11% from other races, and 0.22% from two or more races.

There were 380 households, out of which 25.5% had children under the age of 18 living with them, 50.0% were married couples living together, 11.1% had a female householder with no husband present, and 34.2% were non-families. 30.0% of all households were made up of individuals, and 15.5% had someone living alone who was 65 years of age or older. The average household size was 2.37 and the average family size was 2.93.

In the village, the population was spread out, with 20.6% under the age of 18, 10.3% from 18 to 24, 28.9% from 25 to 44, 23.1% from 45 to 64, and 17.1% who were 65 years of age or older. The median age was 39 years. For every 100 females there were 96.5 males. For every 100 females age 18 and over, there were 93.2 males.

The median income for a household in the village was $26,875, and the median income for a family was $35,972. Males had a median income of $28,523 versus $17,768 for females. The per capita income for the village was $14,917. About 14.8% of families and 17.4% of the population were below the poverty line, including 29.3% of those under age 18 and 9.6% of those age 65 or over.
Education

Flushing has a public library on East High Street, the Victoria Read Public Library, a branch of the Belmont County District Library. [10]

Attraction

The Underground Railroad Museum -Ohio Valley, founded in 1993 by Dr. John Mattox and his wife Rosalind, is on East High Street in the village. [11]

Notable people

Footnotes

  1. "ArcGIS REST Services Directory". United States Census Bureau. Retrieved September 20, 2022.
  2. 1 2 U.S. Geological Survey Geographic Names Information System: Flushing, Ohio
  3. 1 2 "Annual Estimates of the Resident Population for Incorporated Places in Ohio: April 1, 2020 to July 1, 2023". United States Census Bureau. Retrieved June 25, 2024.
  4. 1 2 "U.S. Census website". United States Census Bureau . Retrieved January 31, 2008.
  5. Overman, William Daniel (1958). Ohio Town Names. Akron, OH: Atlantic Press. p. 45.
  6. McKelvey, A. T. (1903). Centennial History of Belmont County, Ohio, and Representative Citizens. Biographical Publishing Company. pp.  274.
  7. "US Gazetteer files 2010". United States Census Bureau. Archived from the original on January 25, 2012. Retrieved January 6, 2013.
  8. "Census of Population and Housing". Census.gov. Retrieved June 4, 2015.
  9. "U.S. Census website". United States Census Bureau . Retrieved January 6, 2013.
  10. "Locations & Hours". Belmont County District Library. Retrieved February 25, 2018.
  11. Michael Pramik, Ohio Department of Development TourismOhio, January 13, 2023 'Touring the Underground Railroad Museum in Flushing' https://ohio.org/travel-inspiration/articles/unique-museum-tourism-the-underground-railroad-museum-flushing-ohio