Politics of Saarland

Last updated

The politics of Saarland takes place within a framework of a federal parliamentary representative democratic republic, where the Federal Government of Germany exercises sovereign rights with certain powers reserved to the states of Germany including Saarland. The state has a multi-party system where the two main parties are the Social Democratic Party of Germany (SPD) on the left and the Christian Democratic Union on the right.

Contents

Every five years, all Germans residing in the State over the age of 18 elect the members of the Saarland Landtag. This regional parliament or legislature then elects the minister-president and confirms the cabinet members.

History pre-1957

League of Nations

The "Territory of the Saar Basin" was governed by the League of Nations under the Treaty of Versailles from 1920 until 1935. The Chairmen of the Commission of Government were:

Nazi Germany

Saarland voted to rejoin Germany in 1935. The German-appointed Reichskommissar were:

Saar protectorate

From 1947 to 1956, Saarland was controlled by France as a protectorate. Elections were held but pro-German parties were banned.

Minister-Presidents in this time were:

List of minister-presidents

Saarland joined the Federal Republic of Germany in 1957. Since then, its minister-presidents have been:

Landtag of Saarland

Party strength in Landtag

A darkened box under a party in any given year denotes that the party had either not yet been founded, or the party had become defunct, by the date of that election.

Prior to joining Germany

Election yearTotal
seats
Seats won
CVP SPS DPS KP CDU DSP
194750281732
19525029174
195550132122147

Since joining the Federal Republic of Germany

Election yearTotal
seats
Seats won
CDU SPD FDP Grüne Linke AfD Other
1960 50191678 [a]
1965 50232142 [b]
1970 502723
1975 5025223
1980 5123244
1985 5120265
1990 5118303
1994 5121273
1999 512625
2004 51271833
2009 5119135311
2012 511917294 [c]
2017 51241773
2022 5119293

State Landtag compositions

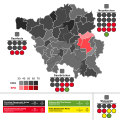
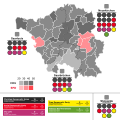
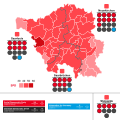
State election results maps

Constituencies in the Landtag

Vote share

The election results have been:

YearCDUSPDFDP/DPSGrüneDie Linke [1] PiratenAfD TSP CVP SPS DPS KP DDU Others
1947-------51,2 %*32,8%7,6%8,4%--
1952-------54,7 %32,4%-9,5%-3,4%
195525,4 %14,3 %-----21,8%5,8%24,2 %6,8%0,9%1,0%
196036,6 %30,0%-----11,4%-13,6 %-5,0%3,4%
196542,7 %40,7%8,3 %----5,2%----3,1%
197047,8 %40,8%4,4%---------7,0%
197549,1 %41,8%7,4%---------1,7%
198044,0 %45,4%6,9 %2,9%--------0,8%
198537,3%49,2 %10,0%2,5%--------1,0%
199033,4%54,4 %5,6%2,6%--------4,0%
199438,6%49,4 %2,1%5,5%--------4,5%
199945,5 %44,4%2,6%3,2%--------4,3%
200447,5 %30,8%5,2%5,6%2,3%-------8,6%
2009 34,5 %24,5%9,2 %5,9 %21,5%-------4,4%
2012 35,2%30,6%1,2%5,0%16,1%7,4%------4,5%
2017 40,7%29,6%3,3%4,0%12,9%0,7%6,2%-----2,6%
2022 28,5%43,5%5,7%5,0%2,6%0,3%5,7%2,3%-----6,4%

Constituencies in the Bundestag

NoConstituencyMember [2] 2021Voters20172013200920052002199819941990
296 Saarbrücken Josephine Ortleb SPD192,929SPDCDU CDU SPDSPDSPDSPD SPD
297 Saarlouis Heiko Maas SPD203,279CDUCDU CDU SPDSPDSPDSPD SPD
298 St. Wendel Christian Petry SPD173,074CDUCDU CDU SPDSPDSPDSPD SPD
299 Homburg Esra Limbacher SPD185,941CDUCDU CDU SPDSPDSPDSPD SPD

Notes

References

  1. 2004: PDS
  2. "Wahlkreise - Die Bundeswahlleiterin". www.bundeswahlleiterin.de. Retrieved 2025-08-25.