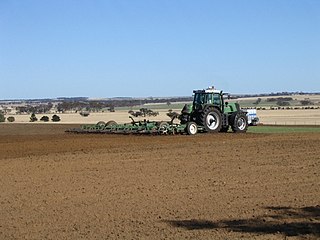
Tillage is the agricultural preparation of soil by mechanical agitation of various types, such as digging, stirring, and overturning. Examples of human-powered tilling methods using hand tools include shoveling, picking, mattock work, hoeing, and raking. Examples of draft-animal-powered or mechanized work include ploughing, rototilling, rolling with cultipackers or other rollers, harrowing, and cultivating with cultivator shanks (teeth).
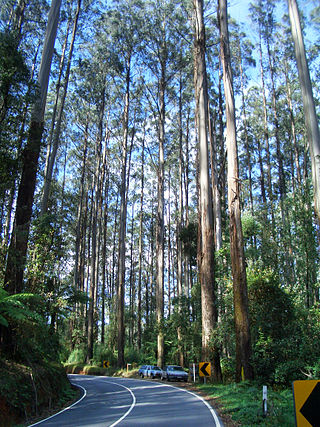
Eucalyptus regnans, known variously as mountain ash, swamp gum, or stringy gum, is a species of medium-sized to very tall forest tree that is native to the Australia states of Tasmania and Victoria. It is a straight-trunked tree with smooth grey bark, but with a stocking of rough brown bark at the base, glossy green, lance-shaped to curved adult leaves, flower buds in groups of between nine and fifteen, white flowers, and cup-shaped or conical fruit. It is the tallest of all flowering plants; the tallest measured living specimen, named Centurion, stands 102 metres tall in Tasmania.

The snowshoe hare, also called the varying hare or snowshoe rabbit, is a species of hare found in North America. It has the name "snowshoe" because of the large size of its hind feet. The animal's feet prevent it from sinking into the snow when it hops and walks. Its feet also have fur on the soles to protect it from freezing temperatures.

The western tanager, is a medium-sized American songbird. Formerly placed in the tanager family (Thraupidae), other members of its genus and it are classified in the cardinal family (Cardinalidae). The species's plumage and vocalizations are similar to other members of the cardinal family.
Silviculture is the practice of controlling the growth, composition/structure, as well as quality of forests to meet values and needs, specifically timber production.

Diameter at breast height, or DBH, is a standard method of expressing the diameter of the trunk or bole of a standing tree. DBH is one of the most common dendrometric measurements.
The following outline is provided as an overview of and guide to forestry:
Basal area is the cross-sectional area of trees at breast height. It is a common way to describe stand density. In forest management, basal area usually refers to merchantable timber and is given on a per hectare or per acre basis. If you cut down all the merchantable trees on an acre at 4 ½ feet off the ground and measured the square inches on the top of each stump (πr*r), added them all together and divided by square feet, that would be the basal area on that acre. In forest ecology, basal area is used as a relatively easily-measured surrogate of total forest biomass and structural complexity, and change in basal area over time is an important indicator of forest recovery during succession .
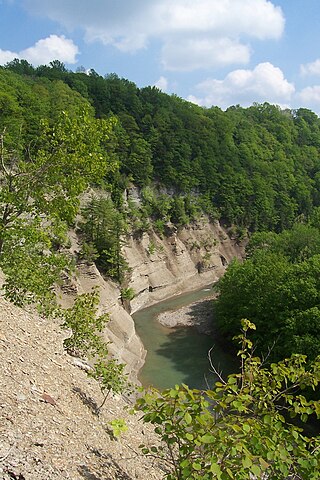
Zoar Valley is an area of deep gorges along the Main and South branches of Cattaraugus Creek in western New York, United States. The valley is located along the border of Erie County and Cattaraugus County, roughly between the villages of Gowanda to the west and Springville to the east.
Site index is a term used in forestry to describe the potential for forest trees to grow at a particular location or "site". Site is defined as "The average age of dominate and/or codominate trees of an even-aged, undisturbed site of intolerant trees at a base age"; furthermore, the word site is used in forestry to refer to a distinct area where trees are found. Site index is used to measure the productivity of the site and the management options for that site and reports the height of dominant and co-dominant trees in a stand at a base age such as 25, 50 and 100 years. For example, a red oak with an age of 50 years and a height of 70 feet (21 m) will have a site index of 70. Site index is species specific. Common methods used to determine site index are based on tree height, plant composition and the use of soil maps.
A diameter tape (D-tape) is a measuring tape used to estimate the diameter of a cylinder object, typically the stem of a tree or pipe. A diameter tape has either metric or imperial measurements reduced by the value of π. This means the tape measures the diameter of the object. It is assumed that the cylinder object is a perfect circle. The diameter tape provides an approximation of diameter; most commonly used in dendrometry.

Tree allometry establishes quantitative relations between some key characteristic dimensions of trees and other properties. To the extent these statistical relations, established on the basis of detailed measurements on a small sample of typical trees, hold for other individuals, they permit extrapolations and estimations of a host of dendrometric quantities on the basis of a single measurements.
A Volume table is a chart to aid in the estimation of standing timber volume. These tables are based on volume equations and use correlations between certain aspects of a tree to estimate the volume to a degree of certainty. The diameter at breast height (DBH) and the merchantable height are used to determine the total volume. Difficulties occur when estimating the form class of the tree in question. The Mesavage and Girard form classes used to classify the trees to decide which volume table should be used. These volume tables are also based on different log rules such a Scribner, Doyle, and International ¼” scale. In order to be effective, the proper form class must be selected as well as accurate DBH and height measurements.
Forest inventory is the systematic collection of data and forest information for assessment or analysis. An estimate of the value and possible uses of timber is an important part of the broader information required to sustain ecosystems. When taking forest inventory the following are important things to measure and note: species, diameter at breast height (DBH), height, site quality, age, and defects. From the data collected one can calculate the number of trees per acre, the basal area, the volume of trees in an area, and the value of the timber. Inventories can be done for other reasons than just calculating the value. A forest can be cruised to visually assess timber and determine potential fire hazards and the risk of fire. The results of this type of inventory can be used in preventive actions and also awareness. Wildlife surveys can be undertaken in conjunction with timber inventory to determine the number and type of wildlife within a forest. The aim of the statistical forest inventory is to provide comprehensive information about the state and dynamics of forests for strategic and management planning. Merely looking at the forest for assessment is called taxation.
A stand density management diagram is a simple biological model relating forest yield to forest density at any stage of a particular forest stand's development. Stand density management diagrams are used in forest management and designed to use a current stand's density to project its future yield. One major reason for the effectiveness of density management diagrams is the relatively low effect of site variance on the diagram's shape. Density management diagrams have transformed ideas long held in traditional stocking diagrams. In 1967, Samuel F. Gingrich published his idea of comparing basal area per acre, trees per acre, and quadratic mean diameter in one graph. He called this the stocking diagram. These same principles are used to make the stand density management diagram work. Basal area and density are plotted against one another and quadratic mean diameter lines are plotted through the plot.

An angle gauge is a tool used by foresters to determine which trees to measure when using a variable radius plot design in forest inventory. Using this tool a forester can quickly measure the trees that are in or out of the plot. An angle gauge is similar to a wedge prism though it must be held a fixed distance from the eye to work properly. Unlike the wedge prism, which is held over the plot center, the surveyor's eye is kept over plot-center when using an angle gauge.
The wedge prism is a prism with a shallow angle between its input and output surfaces. This angle is usually 3 degrees or less. Refraction at the surfaces causes the prism to deflect light by a fixed angle. When viewing a scene through such a prism, objects will appear to be offset by an amount that varies with their distance from the prism.
The Biltmore stick is a tool used by foresters to estimate tree trunk diameter at breast height. The tool very often includes a hypsometer scale to estimate height as well. It looks much like an everyday yardstick. With practice a Biltmore stick is considered to be exceptionally accurate, more often within 13 millimetres on diameters. Some foresters use the tool regularly, however, many prefer to use more accurate tools such as a diameter tape to measure diameter at breast height (DBH) and a clinometer to measure height. On the other end of the spectrum, some foresters consider the use of a Biltmore stick to be no more accurate than their own visual estimates, and make it practice for their surveys to be largely completed in this manner.
Stocking is a quantitative measure of the area occupied by trees, usually measured in terms of well-spaced trees or basal area per hectare, relative to an optimum or desired level of density. It is also known as a measure of the growth potential of a site that may be affected by vegetation in the area along with other nearby trees. Stocking can be shown as a ratio of the current stand density to the stand density of a maximally-occupied site. Stocking measures account for three things: the cover type and species mixture in the stand, the basal area per acre, and the number of trees per acre.
In forestry, quadratic mean diameter or QMD is a measure of central tendency which is considered more appropriate than arithmetic mean for characterizing the group of trees which have been measured. For n trees, QMD is calculated using the quadratic mean formula:
