The Monument Airport | |||||||||||
|---|---|---|---|---|---|---|---|---|---|---|---|
| Summary | |||||||||||
| Airport type | Private | ||||||||||
| Operator | Southern Cross Fertilisers Pty Ltd | ||||||||||
| Serves | Phosphate Hill, Queensland, Australia | ||||||||||
| Elevation AMSL | 949 ft / 289 m | ||||||||||
| Coordinates | 21°48′42″S139°55′24″E / 21.81167°S 139.92333°E | ||||||||||
| Map | |||||||||||
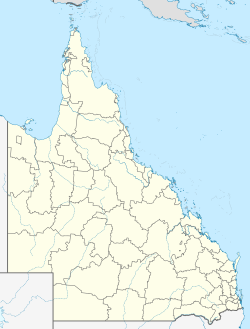 YTMO Location in Queensland | |||||||||||
| Runways | |||||||||||
| |||||||||||
| Sources: Australian AIP and aerodrome chart [1] | |||||||||||
The Monument Airport( IATA : PHQ, ICAO : YTMO), a.k.a. Phosphate Hill Airport is located at Phosphate Hill, Queensland, Australia.