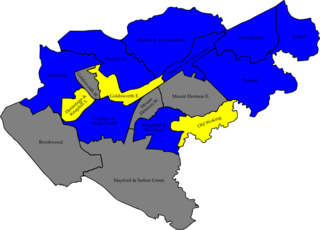
Elections to Watford Borough Council were held on 6 May 2010. Three years in every four, a third of the council (13 councillors) retires and elections are held (in the fourth year, elections are held for county councillors). The council election was held on the same day as the national General Election, when the Labour Party government lost power and the Watford parliamentary constituency was won by the Conservative Party.
Watford is a town and borough in Hertfordshire, England, 15 miles (24 km) northwest of central London.
Watford is a constituency represented in the House of Commons of the UK Parliament since 2010 by Richard Harrington, a member of the Conservative Party.
The Conservative Party, officially the Conservative and Unionist Party, is a centre-right political party in the United Kingdom. The governing party since 2010, it is the largest in the House of Commons, with 313 Members of Parliament, and also has 249 members of the House of Lords, 18 members of the European Parliament, 31 Members of the Scottish Parliament, 12 members of the Welsh Assembly, eight members of the London Assembly and 8,916 local councillors.
In this council election, the Labour Party gained one seat and the Liberal Democrats lost one. However. the Liberal Democrats remained firmly in control of the council. [1]
The Liberal Democrats are a liberal political party in the United Kingdom. It is currently led by Vince Cable. They have 11 Members of Parliament in the House of Commons, 96 members of the House of Lords, one member of the European Parliament, five Members of the Scottish Parliament and one member in the Welsh Assembly and London Assembly. At the height of its influence, the party formed a coalition government with the Conservative Party from 2010 to 2015 with its leader Nick Clegg serving as Deputy Prime Minister.
After the election, the composition of the council was
The Labour Party is a centre-left political party in the United Kingdom that has been described as an alliance of social democrats, democratic socialists and trade unionists. The party's platform emphasises greater state intervention, social justice and strengthening workers' rights.
The Green Party of England and Wales is a green, left-wing political party in England and Wales. Headquartered in London, since September 2018, its co-leaders are Siân Berry and Jonathan Bartley. The Green Party has one representative in the House of Commons, one in the House of Lords, and three in the European Parliament. In addition, it has various councillors in UK local government and two members of the London Assembly.
Party | Seats | Gains | Losses | Net gain/loss | Seats % | Votes % | Votes | +/− | |
---|---|---|---|---|---|---|---|---|---|
Liberal Democrat | 7 | 0 | 1 | -1 | 58.3 | 38.0 | 16,361 | ||
Conservative | 2 | 0 | 0 | - | 16.7 | 30.0 | 12,934 | ||
Labour | 2 | 1 | 0 | +1 | 16.7 | 25.0 | 10,769 | ||
Green | 1 | - | - | - | 8.3 | 7.1 | 3,040 | ||
Watford Mayoral Election 6 May 2010 [2] | ||||||||
---|---|---|---|---|---|---|---|---|
Party | Candidate | 1st round | 2nd round | First round votes Transfer votes | ||||
Total | Of round | Transfers | Total | Of round | ||||
Liberal Democrat | Dorothy Thornhill | 19,153 | 45.9% | 4,276 | 23,429 | {{{totalpercent}}} | | |
Conservative | Stephen Johnson | 10,403 | 24.9% | 1,105 | 11,508 | {{{totalpercent}}} | | |
Labour | Nigel Bell | 10,029 | 24.0% | | ||||
Green | Alex MacGregor-Mason | 2,173 | 5.2% | | ||||
Liberal Democrat hold | ||||||||
Party | Candidate | Votes | % | ± | |
---|---|---|---|---|---|
Green | Ann Lovejoy | 930 | 27.6 | ||
Liberal Democrat | Tricia Gollop | 859 | 25.5 | ||
Labour | Guru Awasthi | 854 | 25.4 | ||
Conservative | Guy Miller | 723 | 21.5 | ||
Majority | 71 | 2.1 | |||
Turnout | 3366 | 61 | |||
Green hold | Swing | ||||
Party | Candidate | Votes | % | ± | |
---|---|---|---|---|---|
Liberal Democrat | Christopher Leslie | 1,211 | 36.8 | ||
Labour | Ian Lowery | 1,140 | 34.6 | ||
Conservative | Richard Bamford | 731 | 22.2 | ||
Green | Caryn Argun | 212 | 6.4 | ||
Majority | 71 | 2.2 | |||
Turnout | 3294 | 54.3 | |||
Liberal Democrat hold | Swing | ||||
Party | Candidate | Votes | % | ± | |
---|---|---|---|---|---|
Labour | Jackie Connal | 1,495 | 43.3 | ||
Liberal Democrat | Janet Baddeley | 1,200 | 34.7 | ||
Conservative | Carole Bamford | 639 | 18.5 | ||
Green | Alison Wiesner | 121 | 3.5 | ||
Majority | 295 | 8.5 | |||
Turnout | 3455 | 54.8 | |||
Labour gain from Liberal Democrat | Swing | ||||
Party | Candidate | Votes | % | ± | |
---|---|---|---|---|---|
Conservative | Stephen Johnson | 1,098 | 31.5 | ||
Labour | Ahsan Khan | 995 | 28.5 | ||
Liberal Democrat | Zaheer Ahmed | 935 | 26.8 | ||
Green | Ian Brandon | 459 | 13.2 | ||
Majority | 103 | 3.0 | |||
Turnout | 3487 | 64.3 | |||
Conservative hold | Swing | ||||
Party | Candidate | Votes | % | ± | |
---|---|---|---|---|---|
Liberal Democrat | Kareen Hastrick | 1,185 | 33.8 | ||
Conservative | Pamela Bell | 1,156 | 33.0 | ||
Labour | Geoffrey O'Connell | 992 | 28.3 | ||
Green | Michael Argun | 168 | 4.8 | ||
Majority | 29 | 0.8 | |||
Turnout | 3501 | 63.3 | |||
Liberal Democrat hold | Swing | ||||
Party | Candidate | Votes | % | ± | |
---|---|---|---|---|---|
Liberal Democrat | Mark Watkin | 1,779 | 43.5 | ||
Conservative | Miles Bennington | 1,610 | 39.3 | ||
Labour | Joanna Grindrod | 509 | 12.4 | ||
Green | Sally Ivins | 196 | 4.8 | ||
Majority | 169 | 4.1 | |||
Turnout | 4094 | 72.2 | |||
Liberal Democrat hold | Swing | ||||
Party | Candidate | Votes | % | ± | |
---|---|---|---|---|---|
Liberal Democrat | Iain Sharpe | 1,924 | 53.6 | ||
Conservative | Sarah Son | 1,044 | 29.1 | ||
Labour | Ann Akubue | 482 | 13.4 | ||
Green | Christine Chandler | 141 | 3.9 | ||
Majority | 880 | 24.5 | |||
Turnout | 3591 | 69.1 | |||
Liberal Democrat hold | Swing | ||||
Party | Candidate | Votes | % | ± | |
---|---|---|---|---|---|
Conservative | Malcolm Meerabux | 2,006 | 45.7 | ||
Liberal Democrat | Peter Jeffree | 1,645 | 37.4 | ||
Labour | Mike Jones | 586 | 13.3 | ||
Green | Alex MacGregor Mason | 156 | 3.6 | ||
Majority | 361 | 8.2 | |||
Turnout | 4393 | 74.8 | |||
Conservative hold | Swing | ||||
Party | Candidate | Votes | % | ± | |
---|---|---|---|---|---|
Liberal Democrat | Keith Crout | 1,687 | 47.4 | ||
Conservative | Linda Topping | 1,072 | 30.12 | ||
Labour | Frederick Oshunniyi | 643 | 18.1 | ||
Green | Kevin Pettifer | 157 | 4.4 | ||
Majority | 615 | 17.3 | |||
Turnout | 3559 | 67 | |||
Liberal Democrat hold | Swing | ||||
Party | Candidate | Votes | % | ± | |
---|---|---|---|---|---|
Liberal Democrat | Lindsey Scudder | 1,352 | 39.6 | ||
Conservative | Richard Southern | 1,220 | 35.7 | +2.1 | |
Labour | Mark Xerri | 685 | 20.1 | ||
Green | Clare Pitkin | 159 | 4.7 | ||
Majority | 132 | 3.9 | |||
Turnout | 3416 | 72.1 | |||
Liberal Democrat hold | Swing | ||||
Party | Candidate | Votes | % | ± | |
---|---|---|---|---|---|
Labour | Jagtar Singh Dhindsa | 1,652 | 45.5 | ||
Liberal Democrat | Bobby Amin | 1,133 | 31.2 | ||
Conservative | David Ealey | 642 | 17.7 | ||
Green | Helen Wynne | 201 | 5.5 | ||
Majority | 519 | 14.3 | |||
Turnout | 3628 | 64.7 | |||
Labour gain from Liberal Democrat | Swing | ||||
Party | Candidate | Votes | % | ± | |
---|---|---|---|---|---|
Liberal Democrat | Karen Collett | 1,451 | 43.7 | ||
Conservative | Joseph Harrison | 1,610 | 29.9 | ||
Labour | John Young | 736 | 22.2 | ||
Green | Iain Wadey | 140 | 4.2 | ||
Majority | 458 | 13.8 | |||
Turnout | 3320 | 63.5 | |||
Liberal Democrat hold | Swing | ||||
The 2007 Woking Council election took place on 3 May 2007 to elect members of Woking Borough Council in Surrey, England. One third of the council was up for election and the Conservative party gained overall control of the council from no overall control.
The 2008 Woking Council election took place on 1 May 2008 to elect members of Woking Borough Council in Surrey, England. One third of the council was up for election and the Conservative party stayed in overall control of the council.
The 2007 Welwyn Hatfield Borough Council election took place on 3 May 2007 to elect members of Welwyn Hatfield Borough Council in Hertfordshire, England. One third of the council was up for election and the Conservative party stayed in overall control of the council.
The 2010 Barnet Council election took place on 6 May 2010 to elect members of Barnet London Borough Council in London, England. The whole council was up for election and the Conservative party stayed in overall control of the council.
The 1999 Pendle Borough Council election took place on 6 May 1999 to elect members of Pendle Borough Council in Lancashire, England. One third of the council was up for election and the Liberal Democrats lost overall control of the council to no overall control.
The 2007 Pendle Borough Council election took place on 3 May 2007 to elect members of Pendle Borough Council in Lancashire, England. One third of the council was up for election and the Liberal Democrats stayed in overall control of the council.
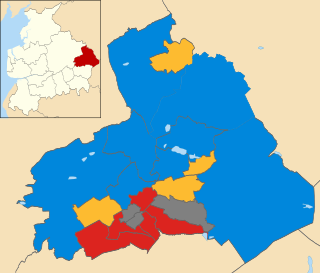
The 2010 Pendle Borough Council election took place on 6 May 2010 to elect members of Pendle Borough Council in Lancashire, England. One third of the council was up for election and the council stayed under no overall control.
The 2011 council elections in Guildford saw the Conservatives retain control over Guildford Borough Council with an increased majority of 20 seats. Full results for each ward can be found at Guildford Council election, full results, 2011.
The 2006 Hertsmere Borough Council election took place on 4 May 2006 to elect members of Hertsmere Borough Council in Hertfordshire, England. One third of the council was up for election and the Conservative party stayed in overall control of the council.
Elections to Watford Borough Council were held on 3 May 2012. Three years in every four, a third of the council retires and elections are held.
Elections to Watford Borough Council in England were held on 5 May 2011. Three years in every four, a third of the council retires and elections are held.
The 2008 Colchester Borough Council election took place on 1 May 2008 to elect members of Colchester Borough Council in Essex, England. One third of the council was up for election and the Conservative party lost overall control of the council to no overall control.
The 2011 Pendle Borough Council election took place on 5 May 2011 to elect members of Pendle Borough Council in Lancashire, England. One third of the council was up for election and the council stayed under no overall control.
The 2012 Pendle Borough Council election took place on 3 May 2012 to elect members of Pendle Borough Council in Lancashire, England. One third of the council was up for election and the council stayed under no overall control.
The 2014 Pendle Borough Council election took place on 22 May 2014 to elect members of Pendle Borough Council in Lancashire, England. One third of the council was up for election and the council stayed under no overall control.
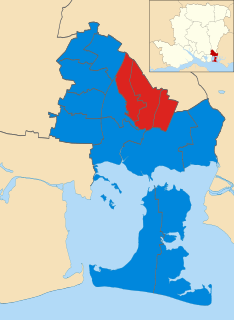
The 2012 Havant Borough Council election took place on 3 May 2012 to elect members of Havant Borough Council in Hampshire, England. One third of the council was up for election and the Conservative party stayed in overall control of the council.
The 2006 Brent London Borough Council election took place on 4 May 2006 to elect members of Brent London Borough Council in London, England. The whole council was up for election and the Labour Party lost overall control of the council to no overall control.
The 2014 Brent London Borough Council election took place on 22 May 2014 to elect members of Brent London Borough Council in London, England. The whole council was up for election and the Labour Party stayed in overall control of the council.
The 2012 St Helens Metropolitan Borough Council election took place on 3 May 2012 to elect members of St Helens Metropolitan Borough Council in Merseyside, England. One third of the council was up for election and the Labour party stayed in overall control of the council.
The 2010 Swale Borough Council election took place on 6 May 2010 to elect members of Swale Borough Council in Kent, England. One third of the council was up for election and the Conservative party stayed in overall control of the council.