Elections to Ashford Borough Council were held on 3 May 2007. The whole council was up for election and the Conservative party held on to overall control of the council.
The Conservative Party, officially the Conservative and Unionist Party, is a centre-right political party in the United Kingdom. Presently led by Theresa May, it has been the governing party since 2010. It presently has 314 Members of Parliament in the House of Commons, 249 members of the House of Lords, and 18 members of the European Parliament. It also has 31 Members of the Scottish Parliament, 12 members of the Welsh Assembly, eight members of the London Assembly and 9,008 local councillors. One of the major parties of UK politics, it has formed the government on 45 occasions, more than any other party.
Party | Seats | Gains | Losses | Net gain/loss | Seats % | Votes % | Votes | +/− | |
---|---|---|---|---|---|---|---|---|---|
Conservative | 28 | 4 | 1 | +3 | 65.1 | 52.8 | 20,825 | +4.1% | |
Liberal Democrat | 8 | 3 | 0 | +3 | 18.6 | 27.9 | 11,025 | +8.5% | |
Independent | 5 | 2 | 6 | -4 | 11.6 | 11.3 | 4,449 | -3.9% | |
Labour | 2 | 0 | 2 | -2 | 4.7 | 7.1 | 2,798 | -7.7% | |
Green | 0 | 0 | 0 | 0 | 0 | 0.9 | 355 | -0.6% |
2 Conservatives were unopposed.
Party | Candidate | Votes | % | ± | |
---|---|---|---|---|---|
Liberal Democrat | Brian Norris | 209 | 40.3 | +20.8 | |
Independent | Jim Gower | 199 | 38.4 | +4.9 | |
Conservative | James Holtum | 110 | 21.2 | +10.8 | |
Majority | 10 | 1.9 | |||
Turnout | 518 | 28.2 | +1.9 | ||
Liberal Democrat gain from Independent | Swing | ||||
Party | Candidate | Votes | % | ± | |
---|---|---|---|---|---|
Labour | Brendan Naughton | 554 | |||
Labour | Allen Wells | 545 | |||
Conservative | Jenny Wedgbury | 377 | |||
Conservative | James Barrow | 369 | |||
Liberal Democrat | Jill Norris | 184 | |||
Liberal Democrat | Gwendoline Thornton | 175 | |||
Turnout | 2,204 | 28.7 | +4.4 | ||
Labour hold | Swing | ||||
Party | Candidate | Votes | % | ± | |
---|---|---|---|---|---|
Conservative | Neil Bell | 615 | 74.0 | -3.5 | |
Liberal Democrat | Paddy Platt | 216 | 26.0 | +3.5 | |
Majority | 399 | 48.0 | -7.0 | ||
Turnout | 831 | 42.7 | +8.5 | ||
Conservative hold | Swing | ||||
Party | Candidate | Votes | % | ± | |
---|---|---|---|---|---|
Conservative | Michael Claughton | 391 | 62.1 | +2.3 | |
Labour | Shafi Khan | 146 | 23.2 | -17.0 | |
Liberal Democrat | Josephine Took | 93 | 14.8 | +14.8 | |
Majority | 245 | 38.9 | +19.3 | ||
Turnout | 630 | 35.4 | +3.2 | ||
Conservative hold | Swing | ||||
Party | Candidate | Votes | % | ± | |
---|---|---|---|---|---|
Liberal Democrat | Rita Hawes | 511 | 67.9 | -3.7 | |
Conservative | Michael Lloyd | 242 | 32.1 | +3.7 | |
Majority | 269 | 35.8 | -7.4 | ||
Turnout | 753 | 35.5 | +5.6 | ||
Liberal Democrat hold | Swing | ||||
Party | Candidate | Votes | % | ± | |
---|---|---|---|---|---|
Conservative | Marlon Martin | 411 | 54.6 | -8.2 | |
Liberal Democrat | Jeremy Adby | 342 | 45.4 | +45.4 | |
Majority | 69 | 9.2 | -16.4 | ||
Turnout | 753 | 39.7 | +8.1 | ||
Conservative hold | Swing | ||||
Party | Candidate | Votes | % | ± | |
---|---|---|---|---|---|
Conservative | Gerry Clarkson | 564 | 73.1 | +5.7 | |
Liberal Democrat | George Whyte | 208 | 26.9 | -5.7 | |
Majority | 356 | 46.2 | +11.4 | ||
Turnout | 772 | 40.0 | +16.6 | ||
Conservative hold | Swing | ||||
Party | Candidate | Votes | % | ± | |
---|---|---|---|---|---|
Conservative | Jane Marriott | 511 | 59.9 | 19.2 | |
Green | Jan Cormack | 240 | 28.1 | +28.1 | |
Liberal Democrat | Leonard Micklewight | 102 | 12.0 | -8.9 | |
Majority | 271 | 31.8 | -26.4 | ||
Turnout | 853 | 45.4 | +5.8 | ||
Conservative hold | Swing | ||||
Party | Candidate | Votes | % | ± | |
---|---|---|---|---|---|
Conservative | Neil Wallace | 470 | 67.0 | +10.1 | |
Liberal Democrat | John Hawes | 152 | 21.7 | -11.7 | |
Labour | Chris Twydell | 79 | 11.3 | +1.6 | |
Majority | 318 | 55.3 | +31.8 | ||
Turnout | 701 | 38.8 | +0.6 | ||
Conservative hold | Swing | ||||
Party | Candidate | Votes | % | ± | |
---|---|---|---|---|---|
Conservative | Peter Feacey | 798 | |||
Conservative | Bernard Heyes | 753 | |||
Liberal Democrat | Patricia Packham | 340 | |||
Labour | Arthur Young | 201 | |||
Liberal Democrat | Paul Taig | 200 | |||
Turnout | 2,292 | 33.1 | +4.5 | ||
Conservative hold | Swing | ||||
Party | Candidate | Votes | % | ± | |
---|---|---|---|---|---|
Conservative | Jessamy Blanford | 347 | 48.5 | +12.6 | |
Independent | Ian McClintock | 172 | 24.0 | -32.5 | |
Liberal Democrat | Christopher Atkins | 123 | 17.2 | +9.6 | |
Labour | Katherine Manning | 74 | 10.3 | +10.3 | |
Majority | 175 | 24.5 | +3.9 | ||
Turnout | 716 | 33.0 | -7.4 | ||
Conservative gain from Independent | Swing | ||||
Party | Candidate | Votes | % | ± | |
---|---|---|---|---|---|
Liberal Democrat | Susan Heaton | 290 | 40.6 | +14.1 | |
Conservative | Steven Davis | 277 | 38.7 | +12.4 | |
Independent | Ieda Hogarth | 148 | 20.7 | -26.5 | |
Majority | 13 | 1.9 | |||
Turnout | 715 | 36.4 | +3.7 | ||
Liberal Democrat gain from Independent | Swing | ||||
Party | Candidate | Votes | % | ± | |
---|---|---|---|---|---|
Conservative | Michael Burgess | 722 | 77.7 | +11.0 | |
Liberal Democrat | Bob Rawlings | 207 | 22.3 | +1.2 | |
Majority | 515 | 55.4 | +9.8 | ||
Turnout | 929 | 45.5 | +2.0 | ||
Conservative hold | Swing | ||||
Party | Candidate | Votes | % | ± | |
---|---|---|---|---|---|
Conservative | John Kemp | uncontested | |||
Conservative hold | Swing | ||||
Party | Candidate | Votes | % | ± | |
---|---|---|---|---|---|
Conservative | Norman Ayres | 535 | 73.5 | +6.3 | |
Liberal Democrat | Anthony Hardwick | 193 | 26.5 | +6.9 | |
Majority | 342 | 47.0 | -0.6 | ||
Turnout | 728 | 37.0 | +4.0 | ||
Conservative hold | Swing | ||||
Party | Candidate | Votes | % | ± | |
---|---|---|---|---|---|
Liberal Democrat | David Bradberry | 228 | 38.6 | +9.2 | |
Independent | Melvyn Elliff | 179 | 30.3 | -5.4 | |
Conservative | Janet Rymer-Jones | 109 | 18.5 | +7.0 | |
Independent | Abbie Burt | 74 | 12.5 | +12.5 | |
Majority | 49 | 8.3 | +2.0 | ||
Turnout | 590 | 30.4 | -1.0 | ||
Liberal Democrat gain from Independent | Swing | ||||
Party | Candidate | Votes | % | ± | |
---|---|---|---|---|---|
Liberal Democrat | George Koowaree | 897 | |||
Liberal Democrat | Bob Davidson | 846 | |||
Conservative | Alan Hutchinson | 401 | |||
Conservative | Josephine Masters | 367 | |||
Independent | Stephen Horn | 207 | |||
Turnout | 2,718 | 38.4 | +2.0 | ||
Liberal Democrat hold | Swing | ||||
Party | Candidate | Votes | % | ± | |
---|---|---|---|---|---|
Conservative | Tina Heyes | 463 | 66.0 | +40.2 | |
Liberal Democrat | Ruth Kirby | 134 | 19.1 | +12.0 | |
Labour | Harriet Yeo | 105 | 15.0 | +15.0 | |
Majority | 329 | 46.9 | |||
Turnout | 702 | 30.2 | +3.0 | ||
Conservative gain from Independent | Swing | ||||
Party | Candidate | Votes | % | ± | |
---|---|---|---|---|---|
Conservative | Jim Wedgbury | 371 | 81.0 | +19.2 | |
Labour | Angharad Yeo | 48 | 10.5 | +10.5 | |
Liberal Democrat | Nicholas Fawcett | 39 | 8.5 | +8.5 | |
Majority | 323 | 70.5 | +46.9 | ||
Turnout | 458 | 30.0 | +2.1 | ||
Conservative hold | Swing | ||||
Party | Candidate | Votes | % | ± | |
---|---|---|---|---|---|
Conservative | Jill Hutchinson | 765 | 81.6 | +4.6 | |
Liberal Democrat | Terrence Brown | 172 | 18.4 | +5.2 | |
Majority | 593 | 63.2 | -0.6 | ||
Turnout | 937 | 48.6 | -15.2 | ||
Conservative hold | Swing | ||||
Party | Candidate | Votes | % | ± | |
---|---|---|---|---|---|
Conservative | Peter Wood | 1,139 | |||
Conservative | Richard Honey | 1,137 | |||
Liberal Democrat | Stuart Dove | 506 | |||
Liberal Democrat | Anne Baxter | 486 | |||
Turnout | 3,268 | 41.3 | -2.3 | ||
Conservative hold | Swing | ||||
Party | Candidate | Votes | % | ± | |
---|---|---|---|---|---|
Conservative | Amanda Hodgkinson | 335 | 47.0 | +11.6 | |
Liberal Democrat | Chris Took | 203 | 28.5 | +28.5 | |
Independent | Carol Brunger | 93 | 13.0 | -25.6 | |
Labour | Andrew Pharoah | 82 | 11.5 | -14.6 | |
Majority | 132 | 18.5 | |||
Turnout | 713 | 36.6 | +9.3 | ||
Conservative gain from Independent | Swing | ||||
Party | Candidate | Votes | % | ± | |
---|---|---|---|---|---|
Independent | David Smith | 274 | 43.8 | -43.8 | |
Liberal Democrat | Ian Smith | 138 | 22.1 | +0.1 | |
Conservative | Miranda Kelly | 109 | 17.4 | +8.0 | |
Independent | Malcolm Eke | 104 | 16.6 | -52.0 | |
Majority | 136 | 21.7 | |||
Turnout | 625 | 27.2 | -3.6 | ||
Independent hold | Swing | ||||
Party | Candidate | Votes | % | ± | |
---|---|---|---|---|---|
Conservative | John Link | 543 | 75.0 | -5.4 | |
Liberal Democrat | Patricia Rickwood | 181 | 25.0 | +5.4 | |
Majority | 462 | 50.0 | -10.8 | ||
Turnout | 724 | 38.2 | +3.6 | ||
Conservative hold | Swing | ||||
Party | Candidate | Votes | % | ± | |
---|---|---|---|---|---|
Independent | Palma Laughton | 245 | 68.2 | +68.2 | |
Conservative | Robert Ackfield | 57 | 15.9 | +1.8 | |
Liberal Democrat | Gill Stone | 57 | 15.9 | -11.5 | |
Majority | 188 | 52.3 | |||
Turnout | 359 | 20.3 | +1.7 | ||
Independent gain from Labour | Swing | ||||
Party | Candidate | Votes | % | ± | |
---|---|---|---|---|---|
Conservative | William Howard | 597 | |||
Conservative | Matthew French | 573 | |||
Labour | Les Lawrie | 413 | |||
Labour | Chris Clark | 344 | |||
Liberal Democrat | Steve Smith | 340 | |||
Liberal Democrat | Kevin Rochester | 278 | |||
Turnout | 2,635 | 35.8 | +5.6 | ||
Conservative gain from Labour | Swing | ||||
Conservative hold | Swing | ||||
Party | Candidate | Votes | % | ± | |
---|---|---|---|---|---|
Conservative | Paul Clokie | 528 | 69.1 | +2.2 | |
Liberal Democrat | Barry Wright | 236 | 30.9 | -2.2 | |
Majority | 292 | 38.2 | +4.4 | ||
Turnout | 764 | 43.7 | +5.0 | ||
Conservative hold | Swing | ||||
Party | Candidate | Votes | % | ± | |
---|---|---|---|---|---|
Conservative | Peter Goddard | 433 | 59.2 | -6.9 | |
Liberal Democrat | John Miller | 299 | 40.8 | +20.9 | |
Majority | 134 | 18.4 | -27.8 | ||
Turnout | 732 | 40.1 | +5.1 | ||
Conservative hold | Swing | ||||
Party | Candidate | Votes | % | ± | |
---|---|---|---|---|---|
Liberal Democrat | Robert Packham | 529 | |||
Liberal Democrat | Robert Cowley | 522 | |||
Conservative | Felicitie Sykes | 218 | |||
Conservative | Irene Hitchings | 217 | |||
Independent | Terry Stock | 215 | |||
Independent | Tony Serretiello | 158 | |||
Labour | Preeti Farooki | 109 | |||
Turnout | 1,968 | 30.4 | +4.7 | ||
Liberal Democrat hold | Swing | ||||
Party | Candidate | Votes | % | ± | |
---|---|---|---|---|---|
Independent | John Holland | 260 | 38.6 | +4.1 | |
Conservative | Stephen Bates | 245 | 36.4 | +3.0 | |
Labour | Perry Calvert | 98 | 14.5 | -17.6 | |
Liberal Democrat | Shaun Chamberlain | 71 | 10.5 | +10.5 | |
Majority | 15 | 2.2 | +1.1 | ||
Turnout | 674 | 30.1 | +2.6 | ||
Independent hold | Swing | ||||
Party | Candidate | Votes | % | ± | |
---|---|---|---|---|---|
Conservative | Robert Taylor | 950 | |||
Conservative | Clair Bell | 891 | |||
Independent | Keith Brannan | 534 | |||
Liberal Democrat | Ann Murray | 371 | |||
Liberal Democrat | Jon Heuch | 224 | |||
Turnout | 2,970 | 42.8 | +3.1 | ||
Conservative hold | Swing | ||||
Party | Candidate | Votes | % | ± | |
---|---|---|---|---|---|
Conservative | Paul Bartlett | uncontested | |||
Conservative hold | Swing | ||||
Party | Candidate | Votes | % | ± | |
---|---|---|---|---|---|
Conservative | Hugh Ellison | 663 | 71.9 | +13.9 | |
Liberal Democrat | Clare Hardwick | 144 | 15.6 | -8.6 | |
Green | Hilary Jones | 115 | 12.5 | +12.5 | |
Majority | 519 | 56.3 | +22.5 | ||
Turnout | 922 | 60.1 | +10.5 | ||
Conservative hold | Swing | ||||
Party | Candidate | Votes | % | ± | |
---|---|---|---|---|---|
Independent | Peter Davison | 998 | |||
Conservative | Aline Hicks | 991 | |||
Conservative | Neil Shorter | 955 | |||
Liberal Democrat | Rosemary Davies | 449 | |||
Turnout | 3,393 | 46.1 | +0.9 | ||
Independent hold | Swing | ||||
Conservative hold | Swing | ||||
Party | Candidate | Votes | % | ± | |
---|---|---|---|---|---|
Independent | Jack Woodford | 589 | 65.1 | +65.1 | |
Conservative | Ian Cooling | 276 | 30.5 | -29.8 | |
Liberal Democrat | David Berrie | 40 | 4.4 | -2.9 | |
Majority | 313 | 34.6 | |||
Turnout | 905 | 49.9 | +6.3 | ||
Independent gain from Conservative | Swing | ||||
Ashford is a town and suburb of London almost entirely in the Surrey borough of Spelthorne, but with a small part in the London Borough of Hounslow, England. Mostly residential, Ashford is 13 1⁄2 miles (22 km) WSW of Charing Cross, London, forms part of the London commuter belt, with a minor stop on the Waterloo to Reading Line and has a long commercial high street. It is centred 2 1⁄2 miles (4 km) south of London Heathrow Airport, to which a portion of its economy relates, including business premises relating to aviation and the distribution of air freight – the main cargo depot being next to an adjoining village, Stanwell.
Ashford Borough Council in Kent, England is elected every four years. Since the last boundary changes in 2003, 43 councillors have been elected from 35 wards.
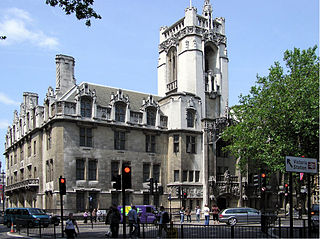
Middlesex County Council was the principal local government body in the administrative county of Middlesex from 1889 to 1965.
Harriet Bronwen Yeo is a British trade unionist, a former Treasurer and President of Transport Salaried Staffs' Association (TSSA), and a UKIP politician who stood unsuccessfully for parliament in Folkestone and Hythe at the 2015 general election.
The Maldon by-election, 1942 was a parliamentary by-election held on 25 June 1942 for the British House of Commons constituency of Maldon in Essex. It was one a series of by-elections in World War II won by radical independent candidates.
Elections to the Borough Council in Slough, England, were held on 3 May 2007. One third of the council was up for election. This was the 122nd Slough general local authority election since Slough became a local government unit in 1863.
The 1999 Ashford Borough Council election took place on 6 May 1999 to elect members of Ashford Borough Council in Kent, England. The whole council was up for election and the council stayed under no overall control.
Elections to Ashford Borough Council were held on 1 May 2003. The whole council was up for election with boundary changes since the last election in 1999 reducing the number of seats by 6. The Conservative party gained control of the council from no overall control.
Elections to Hyndburn Borough Council were held on 3 May 2007. One third of the council was up for election and the Conservative party stayed in overall control of the council. Labour had held one by election and won another from the Conservatives (Rishton) in Autumn 2006.
The Henley by-election, 1932 was a parliamentary by-election held on 25 February 1932 for the British House of Commons constituency of Henley.
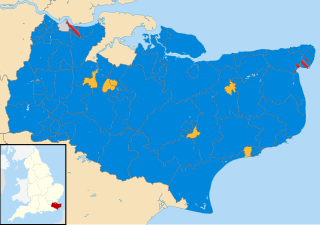
The Kent County Council election, 2013 was an election to all 84 seats on Kent County Council held on 2 May as part of the United Kingdom local elections, 2009. 84 councillors were elected from 72 electoral divisions, which returned either one or two county councillors each by first-past-the-post voting for a four-year term of office. The electoral divisions were the same as those used at the previous election in 2005. No elections were held in Medway, which is a unitary authority outside the area covered by the County Council.
Ashford Borough Council is the local authority for the Borough of Ashford in Kent.
Spelthorne Borough Council in Surrey, England is elected every four years. Since the last boundary changes in 2003, 39 councillors are elected from 13 wards.
Elections to Broxtowe Borough Council were held on 5 May 2011 to elect all 44 members to the Council.
The 2011 Wealden District Council election took place on 5 May 2011 to elect members of Wealden District Council in East Sussex, England. The whole council was up for election and the Conservative party stayed in overall control of the council.
The 2011 Ashford Borough Council election took place on 5 May 2011 to elect members of Ashford Borough Council in Kent, England. The whole council was up for election and the Conservative party stayed in overall control of the council.
The Kent County Council election, 2013 was an election to all 84 seats on Kent County Council held on Thursday 2 May as part of the United Kingdom local elections, 2013. 84 councillors were elected from 72 electoral divisions, which returned either one or two county councillors each by first-past-the-post voting for a four-year term of office. The electoral divisions were the same as those used at the previous election in 2009. No elections were held in Medway, which is a unitary authority outside the area covered by the County Council. The election saw the Conservative Party narrowly retain overall control of the council.
The Tonbridge by-election of 1937 was held on 23 March 1937. The by-election was held due to the death of the incumbent Conservative MP, Herbert Spender-Clay. It was won by the Conservative candidate Adrian Baillie.
The Ashford by-election of 1943 was held on 10 February 1943. The by-election was held due to the appointment as Chief Justice of India of the incumbent Conservative MP, Patrick Spens. It was won by the Conservative candidate Edward Percy Smith.
The 2007 Castle Point Borough Council election took place on 3 May 2007 to elect members of Castle Point Borough Council in Essex, England. One third of the council was up for election and the Conservative party stayed in overall control of the council.