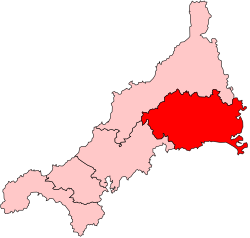
Bodmin | |
---|---|
Former borough constituency for the House of Commons | |
1295–1885 | |
Seats | 1295–1868: two 1868–1885: one |
Replaced by | Bodmin |
Bodmin division of Cornwall | |
---|---|
Former county constituency for the House of Commons | |
1885–1983 | |
Seats | One |
Created from | Bodmin, East Cornwall and Liskeard |
Replaced by | North Cornwall and South East Cornwall |
Bodmin was the name of a parliamentary constituency in Cornwall from 1295 until 1983. Initially, it was a parliamentary borough, which returned two Members of Parliament to the House of Commons of England and later the House of Commons of the Parliament of the United Kingdom until the 1868 general election, when its representation was reduced to one member.
The old borough was abolished with effect from the 1885 general election, but the name was transferred to a county constituency, which elected a single member until the constituency was abolished with effect from the 1983 general election, when it was largely replaced by the new South East Cornwall, thought some areas, including the town of Bodmin]] itself, was transferred to the existing North Cornwall.
1885–1918: The Boroughs of Bodmin and Liskeard, the Sessional Division of East, South, and West Hundred, part of the Sessional Division of Powder Tywardreath, and the parishes of Bodmin, Helland, and Lanivet.
1918–1950: The Boroughs of Bodmin, Fowey, Liskeard, Lostwithiel, and Saltash, the Urban Districts of Callington, Looe, and Torpoint, the Rural Districts of Liskeard and St Germans, in the Rural District of St Austell the parishes of St Sampson and Tywardreath, and part of the Rural District of Bodmin.
1950–1974: The Boroughs of Bodmin, Fowey, Liskeard, Lostwithiel, and Saltash, the Urban Districts of Looe and Torpoint, the Rural Districts of Liskeard and St Germans, in the Rural District of St Austell the parishes of Lanlivery, Luxulyan, and St Sampson, and in the Rural District of Wadebridge the parishes of Blisland, Cardinham, Helland, Lanhydrock, Lanivet, and Withiel.
1974–1983: The Boroughs of Bodmin, Liskeard, and Saltash, the Urban Districts of Looe and Torpoint, the Rural Districts of Liskeard and St Germans, the Rural Borough of Lostwithiel, in the Rural District of St Austell the parishes of Lanlivery, Luxulyan, and St Sampson, and in the Rural District of Wadebridge and Padstow the parishes of Blisland, Cardinham, Helland, Lanhydrock, Lanivet, and Withiel.
The borough which was represented from the time of the Model Parliament consisted of the town of Bodmin though not the whole of the parish. Unlike many of the boroughs in Cornwall which were represented in the Unreformed House of Commons, Bodmin was a town of reasonable size and retained some importance; for most purposes, indeed, it was considered the county town of Cornwall. In 1831, the population of the borough was 3,375, and contained 596 houses.
The right to vote, however, was held not by the residents at large but by the town's corporation, consisting of a Mayor, 11 aldermen and 24 common councilmen. Contested elections were quite unknown before the Reform Act, the choice of the two MPs being left entirely to the "patron". However, this power did not arise, as in many rotten boroughs, from the patron being able to coerce the voters; in Bodmin, the patron was expected to meet the public and private expenses of the corporation and its members in return for their acquiescence at election time.
Early in the 18th century, the Robartes family (Earls of Radnor) were the accepted patrons. Their interest was inherited by George Hunt, whose mother was the Robartes heiress, but he ran into difficulties and could not afford to retain complete control. By the 1760s another local magnate, Sir William Irby, secured enough of the town's goodwill to have a say in the choice of one member, while Hunt continued to select the other. [1] In 1816, the patron was Lord de Dunstanville, nominating both MPs, but he found himself so overburdened with debts that he was forced to give it up, and The Marquess of Hertford was induced to take over the patronage, and the corporation's debts.
While the MP was not expected to assume the same financial obligations as the patron, nor to attend to the needs of his constituents in the manner of a modern MP, they were expected to attend the election ball, a high point in the social calendar for the wives and daughters of the otherwise undistinguished corporation members. John Wilson Croker, elected in 1820, described the Bodmin ball as "tumultuous and merry " but "at once tiresome and foolish".
Bodmin retained both its MPs under the Reform Act, but its boundaries were extended to bring in more of Bodmin parish and the whole of the neighbouring parishes of Lanivet, Lanhydrock and Helland. This increased the population to 5,258, although only 252 were qualified to vote.
By the time of the second Reform Act in 1867, Bodmin's electorate was still below 400, and consequently its representation was halved with effect from the 1868 general election. The extension of the franchise more than doubled the electorate, but Bodmin was still far too small to survive as a borough, and was abolished in 1885.
The Bodmin constituency from 1885 until 1918, strictly called the South-Eastern or Bodmin Division of Cornwall, covered the whole of the south-east corner of the county, including as well as Bodmin itself the towns of Liskeard, Fowey, Lostwithiel and Saltash. Although predominantly rural, the string of small ports along its coast gave it a maritime as well as agricultural character. Through most of this period the constituency was marginal, the Unionists being helped by the popularity of their candidate Leonard Courtney, who had been Liberal MP for Liskeard when it was still a separate borough before joining the Liberal Unionists when the party split in 1886. Looe and the other fishing ports were predominantly Liberal and Fowey a Unionist stronghold, while the areas within the ambit of Plymouth's dockyards tended to vote against whichever was the sitting government. Another factor was the strength of non-conformist religion, as elsewhere in Cornwall, and this was thought to be the explanation for the Liberal gain in 1906, when agricultural seats elsewhere mostly remained with the Tories.
The boundary changes at the 1918 general election, which established what was now called Cornwall, Bodmin Division, and later Bodmin County Constituency, extended the constituency somewhat towards the centre of the county, taking in Callington and the surrounding district. These boundaries remained essentially unchanged for the remainder of the constituency's existence, except that Fowey was moved into the Truro constituency in 1974. As elsewhere in Cornwall, Labour never established a foothold in Bodmin, and the Liberals remained the main challengers to the Conservatives. The Conservatives held it continuously from 1945 to 1964, and at one point might have considered it a safe seat, but by the mid-1960s the Liberal revival had established it as a Liberal-Conservative marginal, which it remained until its abolition.
The Bodmin constituency ceased to exist as a result of the boundary changes implemented in 1983. Although the bulk of the constituency survived, Bodmin itself had been moved, enforcing a change of name: Bodmin joined North Cornwall, while the rest of the constituency was reunited with Fowey to become South East Cornwall. Bodmin's last Member, Robert Hicks, stood and was elected for the latter constituency.
Parliament | First member | Second member | |
---|---|---|---|
1351–52 | Johannes De Tremayn [2] [a 1] | ||
Parliament of 1386 | John Breton II | Henry Baudyn | |
First Parliament of 1388 (Feb) | Stephen Bant | John Syreston | |
Second Parliament of 1388 (Sep) | John Breton I | Henry Baudyn | |
First Parliament of 1390 (Jan) | John Breton I | Henry Baudyn | |
Second Parliament of 1390 (Nov) | ? | ? | |
Parliament of 1391 | John Breton I | Thomas Bere | |
Parliament of 1393 | John Breton I | John Drewe | |
Parliament of 1394 | ? | ? | |
Parliament of 1395 | John Tregoose | Thomas Bere | |
First Parliament of 1397 (Jan) | Stephen Trenewith | Thomas Bere | |
Second Parliament of 1397 (Sep) | John Trelawny I | John Breton I | |
Parliament of 1399 | John Burgh I | James Halappe | |
Parliament of 1401 | ? | ? | |
Parliament of 1402 | John Nicoll | William Slingsby | |
First Parliament of 1404 (Jan) | |||
Second Parliament of 1404 (Oct) | |||
Parliament of 1406 | Richard Allet | Benedict Burgess | |
Parliament of 1407 | Michael Froden | Michael Hoge | |
Parliament of 1410 | Otto Tregonan | William Moyle | |
Parliament of 1411 | Otto Tregonan | John Wyse | |
First Parliament of 1413 (Feb) | |||
Second Parliament of 1413 (May) | John But | Robert Treage | |
First Parliament of 1414 (Apr) | John But | Otto Tregonan | |
Second Parliament of 1414 (Nov) | John Clink | John But | |
Parliament of 1415 or 1416 (Mar) | Nicholas Jop | Otto Tregonan | |
Parliament of 1416 (Oct) | |||
Parliament of 1417 | Otto Tregonan | John Trewoofe | |
Parliament of 1419 | Nicholas Bouy | John Trewoofe | |
Parliament of 1420 | John Lawhire | Robert Treage | |
First Parliament of 1421 (May) | Otto Tregonan | David Urban | |
Second Parliament of 1421 (Dec) | William Chentleyn | Philip Motty | |
Parliament of 1437 | James Flamank | Thomas Lanhergy | |
Parliament of 1515 | John Flamank | Thomas Trott | |
Parliament of 1529 | Thomas Treffry I | Gilbert Flamank | |
Parliament of 1545 | Thomas Treffry II | Henry Chiverton | |
Parliament of 1547 | Henry Chiverton | John Caplyn | |
First Parliament of 1553 (Mar) | John Caplyn | Ralph Cholmley | |
Second Parliament of 1553 | Henry Chiverton | Thomas Mildmay | |
First Parliament of 1554 (Apr) | John Sulyard | ||
Second Parliament of 1554 (Nov) | John Courtney | Ralph Michell | |
Parliament of 1555 | Thomas Williams | Humphrey Cavill | |
Parliament of 1558 | Walter Hungerford | John Norreys | |
Parliament of 1558–9 | Nicholas Carminowe | Digory Chamond | |
Parliament of 1562 | John Mallett | Francis Browne | |
Parliament of 1563–1567 | |||
Parliament of 1571 | Humphrey Smith | John Kestall | |
Parliament of 1572–1581 | Thomas Cromwell | Edmund Pooley | |
Parliament of 1584–1585 | John Audley | Gilbert Mitchell | |
Parliament of 1586–1587 | Emmanuel Chamond | Brutus Browne | |
Parliament of 1588–1589 | Hugh Beeston | ||
Parliament of 1593 | Anthony Bennet | Richard Cannock | |
Parliament of 1597–1598 | Sir Bernard Grenville | John Herbert | |
Parliament of 1601 | William Lower | John Pigot | |
Parliament of 1604–1611 | John Stone | Richard Spray | |
Addled Parliament (1614) | Christopher Spray | Richard Edgecumbe | |
Parliament of 1621–1622 | Sir John Trevor | James Bagge, junior | |
Happy Parliament (1624–1625) | Sir Thomas Stafford | Charles Berkeley | |
Useless Parliament (1625) | Henry Jermyn | Robert Caesar | |
Parliament of 1625–1626 | Sir Richard Weston | ||
Parliament of 1628–1629 | Sir Robert Killigrew | Humphrey Nicholls | |
No Parliament summoned 1629–1640 | |||
Election | Member | Party | |
---|---|---|---|
1868 | Representation reduced to one member | ||
1868 | Hon. Frederick Leveson-Gower | Liberal | |
1885 | Leonard Courtney | Liberal | |
1886 | Liberal Unionist | ||
1900 | Sir Lewis Molesworth | Liberal Unionist | |
1906 | Thomas Agar-Robartes | Liberal | |
1906 by-election | Freeman Freeman-Thomas | Liberal | |
1910 | Cecil Grenfell | Liberal | |
1910 | Sir Reginald Pole-Carew | Liberal Unionist | |
1916 by-election | Charles Hanson | Coalition Conservative | |
1922 by-election | Isaac Foot | Liberal | |
1924 | Gerald Harrison | Conservative | |
1929 | Isaac Foot | Liberal | |
1935 | John Rathbone | Conservative | |
1941 by-election | Beatrice Rathbone (later Wright) | Conservative | |
1945 | Sir Douglas Marshall | Conservative | |
1964 | Peter Bessell | Liberal | |
1970 | Robert Hicks | Conservative | |
Feb 1974 | Paul Tyler | Liberal | |
Oct 1974 | Robert Hicks | Conservative | |
1983 | constituency abolished |
Party | Candidate | Votes | % | ±% | |
---|---|---|---|---|---|
Tory | Davies Gilbert | Unopposed | |||
Tory | Horace Seymour | Unopposed | |||
Tory hold | |||||
Tory hold |
Party | Candidate | Votes | % | ±% | |
---|---|---|---|---|---|
Tory | Davies Gilbert | Unopposed | |||
Tory | Horace Seymour | Unopposed | |||
Tory hold | |||||
Tory hold |
Party | Candidate | Votes | % | ±% | |
---|---|---|---|---|---|
Whig | William Peter | 171 | 43.7 | New | |
Whig | Samuel Thomas Spry | 114 | 29.2 | New | |
Whig | Charles Vivian | 106 | 27.1 | New | |
Majority | 8 | 1.9 | N/A | ||
Turnout | 222 | 88.1 | N/A | ||
Registered electors | 252 | ||||
Whig gain from Tory | Swing | N/A | |||
Whig gain from Tory | Swing | N/A |
Party | Candidate | Votes | % | ±% | |
---|---|---|---|---|---|
Whig | Charles Vivian | 170 | 39.9 | +12.8 | |
Whig | Samuel Thomas Spry | 138 | 32.4 | +3.2 | |
Conservative | Edward Eliot | 118 | 27.7 | New | |
Majority | 20 | 4.7 | +2.8 | ||
Turnout | 234 | 74.8 | −13.3 | ||
Registered electors | 313 | ||||
Whig hold | Swing | N/A | |||
Whig hold | Swing | N/A |
Party | Candidate | Votes | % | ±% | |
---|---|---|---|---|---|
Whig | Charles Vivian | 200 | 46.7 | +6.8 | |
Conservative | Samuel Thomas Spry | 130 | 30.4 | +2.7 | |
Whig | Carteret John William Ellis [23] | 98 | 22.9 | −9.5 | |
Turnout | 250 | 75.1 | +0.3 | ||
Registered electors | 333 | ||||
Majority | 70 | 16.3 | +11.6 | ||
Whig hold | Swing | +2.7 | |||
Majority | 32 | 7.5 | N/A | ||
Conservative gain from Whig | Swing | +2.7 |
Party | Candidate | Votes | % | ±% | |
---|---|---|---|---|---|
Whig | Charles Vivian | 224 | 44.7 | −24.9 | |
Conservative | John Townshend | 142 | 28.3 | +13.1 | |
Conservative | Samuel Thomas Spry | 135 | 26.9 | +11.7 | |
Majority | 82 | 16.4 | ±0.0 | ||
Turnout | 227 | 61.7 | −13.4 | ||
Registered electors | 368 | ||||
Whig hold | Swing | −24.9 | |||
Conservative hold | Swing | +12.8 |
Vivian succeeded to the peerage, becoming 2nd Baron Vivian and causing a by-election.
Party | Candidate | Votes | % | ±% | |
---|---|---|---|---|---|
Conservative | Samuel Thomas Spry | 165 | 50.6 | −4.6 | |
Whig | Charles Graves-Sawle | 161 | 49.4 | +4.7 | |
Majority | 4 | 1.2 | N/A | ||
Turnout | 326 | 80.5 | +18.8 | ||
Registered electors | 405 | ||||
Conservative gain from Whig | Swing | −4.7 |
Party | Candidate | Votes | % | ±% | |
---|---|---|---|---|---|
Radical | James Wyld | 297 | 44.1 | New | |
Whig | Henry Lacy | 259 | 38.5 | −6.2 | |
Conservative | Samuel Thomas Spry | 117 | 17.4 | −37.8 | |
Turnout | 337 (est) | 83.9 (est) | +22.2 | ||
Registered electors | 401 | ||||
Majority | 38 | 5.6 | N/A | ||
Radical gain from Conservative | Swing | N/A | |||
Majority | 142 | 21.1 | +4.7 | ||
Whig hold | Swing | +6.4 |
Party | Candidate | Votes | % | ±% | |
---|---|---|---|---|---|
Conservative | William Michell | 273 | 38.2 | +29.5 | |
Whig | Charles Graves-Sawle | 157 | 22.0 | −16.5 | |
Conservative | William Henderson [24] | 149 | 20.8 | +12.1 | |
Radical | Edward Capel Whitehurst [25] | 82 | 11.5 | −32.6 | |
Peelite | Henry Carr [26] [27] [28] | 54 | 7.6 | N/A | |
Turnout | 358 (est) | 97.4 (est) | +13.5 | ||
Registered electors | 367 | ||||
Majority | 116 | 16.2 | N/A | ||
Conservative gain from Radical | Swing | +22.9 | |||
Majority | 8 | 1.2 | −19.9 | ||
Whig hold | Swing | −18.7 |
Party | Candidate | Votes | % | ±% | |
---|---|---|---|---|---|
Whig | John Vivian | 244 | 38.5 | '+16.5 | |
Radical | James Wyld | 190 | 30.0 | +18.5 | |
Conservative | William Michell [29] | 169 | 26.7 | −11.5 | |
Whig | Harvey Lewis [30] [31] | 31 | 4.9 | N/A | |
Turnout | 317 (est) | 81.3 (est) | −16.1 | ||
Registered electors | 390 | ||||
Majority | 54 | 8.5 | +7.3 | ||
Whig hold | Swing | N/A | |||
Majority | 21 | 3.3 | N/A | ||
Radical gain from Conservative | Swing | +15.0 |
Party | Candidate | Votes | % | ±% | |
---|---|---|---|---|---|
Liberal | Frederick Leveson-Gower | 215 | 37.1 | N/A | |
Conservative | William Michell | 198 | 34.1 | +7.4 | |
Liberal | James Wyld | 167 | 28.8 | −1.2 | |
Turnout | 290 (est) | 74.4 (est) | −6.9 | ||
Registered electors | 390 | ||||
Majority | 17 | 3.0 | −0.3 | ||
Liberal hold | Swing | N/A | |||
Majority | 31 | 5.3 | N/A | ||
Conservative gain from Liberal | Swing | +4.3 |
Michell resigned by accepting the office of Steward of the Manor of Northstead, causing a by-election.
Party | Candidate | Votes | % | ±% | |
---|---|---|---|---|---|
Liberal | James Wyld | Unopposed | |||
Liberal gain from Conservative |
Party | Candidate | Votes | % | ±% | |
---|---|---|---|---|---|
Liberal | Frederick Leveson-Gower | 263 | 42.8 | +5.7 | |
Liberal | James Wyld | 238 | 38.7 | +9.9 | |
Conservative | Charles Locock Webb [32] | 114 | 18.5 | −15.6 | |
Majority | 124 | 20.2 | +17.2 | ||
Turnout | 365 (est) | 91.8 (est) | +17.4 | ||
Registered electors | 397 | ||||
Liberal hold | Swing | +6.8 | |||
Liberal gain from Conservative | Swing | +8.9 |
The seat was reduced to one member for the 1868 election.
Party | Candidate | Votes | % | ±% | |
---|---|---|---|---|---|
Liberal | Frederick Leveson-Gower | 424 | 55.9 | +13.1 | |
Liberal | James Wyld | 334 | 44.1 | +5.4 | |
Majority | 90 | 11.8 | −8.4 | ||
Turnout | 758 | 85.6 | −6.2 | ||
Registered electors | 886 | ||||
Liberal hold | Swing | N/A |
Party | Candidate | Votes | % | ±% | |
---|---|---|---|---|---|
Liberal | Frederick Leveson-Gower | 464 | 57.5 | +1.6 | |
Liberal | Charles Eldon Sargeant [33] | 230 | 28.5 | −15.6 | |
Conservative | Charles Locock Webb [32] | 113 | 14.0 | New | |
Majority | 234 | 29.0 | +17.2 | ||
Turnout | 807 | 84.2 | −1.4 | ||
Registered electors | 959 | ||||
Liberal hold | Swing | N/A |
Party | Candidate | Votes | % | ±% | |
---|---|---|---|---|---|
Liberal | Frederick Leveson-Gower | 418 | 52.7 | −4.8 | |
Liberal | James Ross Farquharson [35] | 375 | 47.3 | +18.8 | |
Majority | 43 | 5.4 | −23.6 | ||
Turnout | 793 | 87.8 | +3.6 | ||
Registered electors | 903 | ||||
Liberal hold | Swing | −11.8 |
Party | Candidate | Votes | % | ±% | |
---|---|---|---|---|---|
Liberal | Leonard Courtney | 4,254 | 57.8 | +5.1 | |
Conservative | Charles Ernest Edgcumbe | 3,101 | 42.2 | New | |
Majority | 1,153 | 15.6 | +10.2 | ||
Turnout | 7,355 | 80.3 | −7.5 | ||
Registered electors | 9,158 | ||||
Liberal hold | Swing | N/A |
Party | Candidate | Votes | % | ±% | |
---|---|---|---|---|---|
Liberal Unionist | Leonard Courtney | 3,763 | 64.2 | +22.0 | |
Liberal | John Abraham [38] | 2,101 | 35.8 | −22.0 | |
Majority | 1,662 | 28.4 | N/A | ||
Turnout | 5,864 | 64.0 | −16.3 | ||
Registered electors | 9,158 | ||||
Liberal Unionist gain from Liberal | Swing | +22.0 |
Party | Candidate | Votes | % | ±% | |
---|---|---|---|---|---|
Liberal Unionist | Leonard Courtney | 3,809 | 51.6 | −12.6 | |
Liberal | John McDougall | 3,578 | 48.4 | +12.6 | |
Majority | 231 | 3.2 | −25.2 | ||
Turnout | 7,387 | 79.7 | +15.7 | ||
Registered electors | 9,263 | ||||
Liberal Unionist hold | Swing | −12.6 |
Party | Candidate | Votes | % | ±% | |
---|---|---|---|---|---|
Liberal Unionist | Leonard Courtney | 4,035 | 53.6 | +2.0 | |
Liberal | John McDougall | 3,492 | 46.4 | −2.0 | |
Majority | 543 | 7.2 | +4.0 | ||
Turnout | 7,527 | 78.3 | −1.4 | ||
Registered electors | 9,607 | ||||
Liberal Unionist hold | Swing | +2.0 |
Party | Candidate | Votes | % | ±% | |
---|---|---|---|---|---|
Liberal Unionist | Lewis Molesworth | 4,280 | 56.9 | +3.3 | |
Liberal | Thomas Snape | 3,248 | 43.1 | −3.3 | |
Majority | 1,032 | 13.8 | +6.6 | ||
Turnout | 7,528 | 75.1 | −3.2 | ||
Registered electors | 10,026 | ||||
Liberal Unionist hold | Swing | +3.3 |
Party | Candidate | Votes | % | ±% | |
---|---|---|---|---|---|
Liberal | Thomas Agar-Robartes | 5,201 | 56.3 | +13.2 | |
Liberal Unionist | H. B. Grylls | 4,029 | 43.7 | −13.2 | |
Majority | 1,172 | 12.6 | N/A | ||
Turnout | 9,230 | 86.0 | +10.9 | ||
Registered electors | 10,731 | ||||
Liberal gain from Liberal Unionist | Swing | +13.2 |
Party | Candidate | Votes | % | ±% | |
---|---|---|---|---|---|
Liberal | Freeman Freeman-Thomas | 4,969 | 56.2 | −0.1 | |
Liberal Unionist | George Sandys | 3,876 | 43.8 | +0.1 | |
Majority | 1,093 | 12.4 | −0.2 | ||
Turnout | 8,845 | 82.4 | −3.6 | ||
Registered electors | 10,731 | ||||
Liberal hold | Swing | −0.1 |
Party | Candidate | Votes | % | ±% | |
---|---|---|---|---|---|
Liberal | Cecil Grenfell | 5,133 | 50.2 | −6.1 | |
Liberal Unionist | Reginald Pole-Carew | 5,083 | 49.8 | +6.1 | |
Majority | 50 | 0.4 | −12.2 | ||
Turnout | 10,216 | 88.4 | +2.4 | ||
Registered electors | 11,553 | ||||
Liberal hold | Swing | −6.1 |
Party | Candidate | Votes | % | ±% | |
---|---|---|---|---|---|
Liberal Unionist | Reginald Pole-Carew | 5,021 | 50.2 | +0.4 | |
Liberal | Isaac Foot | 4,980 | 49.8 | −0.4 | |
Majority | 41 | 0.4 | N/A | ||
Turnout | 10,001 | 86.6 | −1.8 | ||
Registered electors | 11,553 | ||||
Liberal Unionist gain from Liberal | Swing | +0.4 |
General election 1914–15:
Another general election was required to take place before the end of 1915. The political parties had been making preparations for an election to take place and by July 1914, the following candidates had been selected;
Party | Candidate | Votes | % | ±% | |
---|---|---|---|---|---|
Unionist | Charles Hanson | Unopposed | |||
Unionist hold |
Party | Candidate | Votes | % | ±% | |
---|---|---|---|---|---|
C | Unionist | Charles Hanson | 12,228 | 58.4 | +8.2 |
Liberal | Isaac Foot | 8,705 | 41.6 | −8.2 | |
Majority | 3,523 | 16.8 | +16.4 | ||
Turnout | 20,933 | 69.1 | −17.5 | ||
Unionist hold | Swing | +8.2 | |||
Cindicates candidate endorsed by the coalition government. |
Party | Candidate | Votes | % | ±% | |
---|---|---|---|---|---|
Liberal | Isaac Foot | 13,751 | 56.4 | +14.8 | |
C | Unionist | Frederick Poole | 10,610 | 43.6 | −14.8 |
Majority | 3.141 | 12.8 | N/A | ||
Turnout | 24,361 | 74.8 | +5.7 | ||
Liberal gain from Unionist | Swing | +14.8 | |||
Cindicates candidate endorsed by the coalition government. |
Party | Candidate | Votes | % | ±% | |
---|---|---|---|---|---|
Liberal | Isaac Foot | 14,292 | 53.4 | −3.0 | |
Unionist | Frederick Poole | 12,467 | 46.6 | +3.0 | |
Majority | 1,825 | 6.8 | −6.0 | ||
Turnout | 26,759 | 80.4 | +5.6 | ||
Liberal hold | Swing | −3.0 |
Party | Candidate | Votes | % | ±% | |
---|---|---|---|---|---|
Liberal | Isaac Foot | 14,536 | 53.6 | +0.2 | |
Unionist | Frederick Poole | 12,574 | 46.4 | −0.2 | |
Majority | 1,962 | 7.2 | +0.4 | ||
Turnout | 27,110 | 82.0 | +1.6 | ||
Liberal hold | Swing | +0.2 |
Party | Candidate | Votes | % | ±% | |
---|---|---|---|---|---|
Unionist | Gerald Harrison | 14,163 | 51.1 | +4.7 | |
Liberal | Isaac Foot | 13,548 | 48.9 | −4.7 | |
Majority | 615 | 2.2 | N/A | ||
Turnout | 27,711 | 82.4 | +0.4 | ||
Unionist gain from Liberal | Swing | +4.7 |
Party | Candidate | Votes | % | ±% | |
---|---|---|---|---|---|
Liberal | Isaac Foot | 16,002 | 46.3 | −2.6 | |
Unionist | Gerald Harrison | 15,088 | 43.7 | −7.4 | |
Labour | Paul Reed | 3,437 | 10.0 | New | |
Majority | 914 | 2.6 | N/A | ||
Turnout | 34,527 | 84.9 | +2.5 | ||
Liberal gain from Unionist | Swing | +2.4 |
Party | Candidate | Votes | % | ±% | |
---|---|---|---|---|---|
Liberal | Isaac Foot | Unopposed | N/A | N/A | |
Liberal hold |
Party | Candidate | Votes | % | ±% | |
---|---|---|---|---|---|
Conservative | John Rathbone | 17,485 | 50.4 | New | |
Liberal | Isaac Foot | 14,732 | 42.4 | N/A | |
Labour | Harold E. J. Falconer | 2,496 | 7.2 | New | |
Majority | 2,753 | 8.0 | N/A | ||
Turnout | 34,713 | 82.3 | N/A | ||
Conservative gain from Liberal | Swing | N/A |
General election 1939–40: Another general election was required to take place before the end of 1940. The political parties had been making preparations for an election to take place from 1939 and by the end of this year, the following candidates had been selected;
Party | Candidate | Votes | % | ±% | |
---|---|---|---|---|---|
Conservative | Beatrice Rathbone | Unopposed | N/A | N/A | |
Conservative hold |
Party | Candidate | Votes | % | ±% | |
---|---|---|---|---|---|
Conservative | Douglas Marshall | 15,396 | 43.8 | −6.6 | |
Liberal | John Foot | 13,349 | 38.0 | −4.4 | |
Labour | Jack Hubert Pitts | 6,401 | 18.2 | +11.0 | |
Majority | 2,047 | 5.8 | −2.2 | ||
Turnout | 35,146 | 76.1 | −6.2 | ||
Conservative hold | Swing |
Party | Candidate | Votes | % | ±% | |
---|---|---|---|---|---|
Conservative | Douglas Marshall | 19,441 | 49.2 | +5.4 | |
Liberal | John Foot | 11,649 | 29.5 | –8.5 | |
Labour | William Royle | 8,434 | 21.3 | +3.1 | |
Majority | 7,792 | 19.7 | +13.9 | ||
Turnout | 39,524 | 84.3 | +8.2 | ||
Conservative hold | Swing |
Party | Candidate | Votes | % | ±% | |
---|---|---|---|---|---|
Conservative | Douglas Marshall | 20,086 | 50.9 | +1.7 | |
Liberal | T. Stuart Roseveare | 10,088 | 25.6 | −3.9 | |
Labour | William Royle | 9,244 | 23.5 | +2.2 | |
Majority | 9,998 | 25.3 | +5.6 | ||
Turnout | 39,418 | 84.6 | +0.3 | ||
Conservative hold | Swing |
Party | Candidate | Votes | % | ±% | |
---|---|---|---|---|---|
Conservative | Douglas Marshall | 17,858 | 49.2 | −1.7 | |
Liberal | T. Stuart Roseveare | 10,199 | 28.0 | +2.4 | |
Labour | E. Fraser Wilde | 8,304 | 22.8 | −0.7 | |
Majority | 7,659 | 21.2 | −4.1 | ||
Turnout | 36,361 | 79.5 | −5.1 | ||
Conservative hold | Swing |
Party | Candidate | Votes | % | ±% | |
---|---|---|---|---|---|
Conservative | Douglas Marshall | 16,853 | 46.0 | −3.2 | |
Liberal | Peter Bessell | 14,052 | 38.3 | +10.3 | |
Labour | Thomas F. Mitchell | 5,769 | 15.7 | −7.1 | |
Majority | 2,801 | 7.7 | −13.5 | ||
Turnout | 36,674 | 81.5 | +2.0 | ||
Conservative hold | Swing |
Party | Candidate | Votes | % | ±% | |
---|---|---|---|---|---|
Liberal | Peter Bessell | 18,046 | 48.6 | +10.3 | |
Conservative | Douglas Marshall | 14,910 | 40.2 | −5.8 | |
Labour | Thomas F. Mitchell | 4,172 | 11.2 | −4.5 | |
Majority | 3,136 | 8.45 | N/A | ||
Turnout | 37,128 | 82.7 | +1.2 | ||
Liberal gain from Conservative | Swing |
Party | Candidate | Votes | % | ±% | |
---|---|---|---|---|---|
Liberal | Peter Bessell | 18,144 | 46.6 | −2.0 | |
Conservative | John Gorst | 16,121 | 41.4 | +1.2 | |
Labour | Robert Blank | 4,674 | 12.0 | +0.8 | |
Majority | 2,023 | 5.2 | −3.2 | ||
Turnout | 38,939 | 84.4 | +1.7 | ||
Liberal hold | Swing |
Party | Candidate | Votes | % | ±% | |
---|---|---|---|---|---|
Conservative | Robert Hicks | 20,187 | 48.3 | +6.9 | |
Liberal | Paul Tyler | 16,267 | 38.9 | −7.7 | |
Labour | Alfred F. Long | 5,350 | 12.8 | +0.8 | |
Majority | 3,920 | 9.4 | N/A | ||
Turnout | 41,804 | 80.6 | −3.8 | ||
Conservative gain from Liberal | Swing |
Party | Candidate | Votes | % | ±% | |
---|---|---|---|---|---|
Liberal | Paul Tyler | 20,283 | 44.2 | +5.3 | |
Conservative | Robert Hicks | 20,274 | 44.2 | −4.1 | |
Labour | G. Lonsdale | 5,328 | 11.61 | −1.2 | |
Majority | 9 | 0.0 | N/A | ||
Turnout | 45,885 | 83.3 | +2.7 | ||
Liberal gain from Conservative | Swing |
Party | Candidate | Votes | % | ±% | |
---|---|---|---|---|---|
Conservative | Robert Hicks | 20,756 | 45.5 | +1.3 | |
Liberal | Paul Tyler | 20,091 | 44.0 | −0.2 | |
Labour | P. C. Knight | 4,814 | 10.5 | −1.1 | |
Majority | 665 | 1.5 | N/A | ||
Turnout | 45,661 | 82.3 | −1.0 | ||
Conservative gain from Liberal | Swing |
Party | Candidate | Votes | % | ±% | |
---|---|---|---|---|---|
Conservative | Robert Hicks | 27,922 | 54.9 | +9.4 | |
Liberal | Paul Tyler | 17,893 | 35.2 | −8.8 | |
Labour | Nigel Knowles | 3,508 | 6.9 | −3.6 | |
Mebyon Kernow | Roger Holmes | 865 | 1.7 | New | |
Ecology | C. Retallack | 465 | 0.9 | New | |
National Front | M. Carter | 235 | 0.5 | New | |
Majority | 10,029 | 19.7 | +18.2 | ||
Turnout | 50,023 | 82.5 | +0.2 | ||
Conservative hold | Swing |
Lostwithiel is a civil parish and small town in Cornwall, England, United Kingdom at the head of the estuary of the River Fowey. According to the 2001 census it had a population of 2,739, increasing to 2,899 at the 2011 census. The Lostwithiel electoral ward had a population of 4,639 at the 2011 census. The name Lostwithiel comes from the Cornish "lostwydhyel" which means "tail of a wooded area".
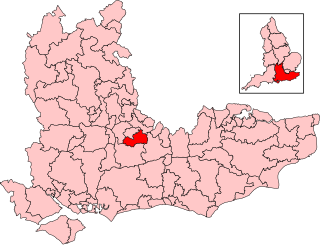
Guildford is a constituency in Surrey represented in the House of Commons of the UK Parliament since 2024 by Zöe Franklin, a Liberal Democrat.
Winchester is a constituency in Hampshire represented in the House of Commons of the UK Parliament since 2024 by Danny Chambers, a Liberal Democrat.
North Cornwall is a constituency represented in the House of Commons of the UK Parliament by Ben Maguire, a Liberal Democrat since the 2024 general election. Like all British constituencies, the seat elects one Member of Parliament (MP) by the first past the post system of election at least every five years. The seat was created in 1918. Since 1950, the constituency has been held by MPs from either the Conservative Party or the Liberal Democrats.
South East Cornwall is a constituency represented in the House of Commons of the UK Parliament since 2024 by Anna Gelderd, a Labour politician.
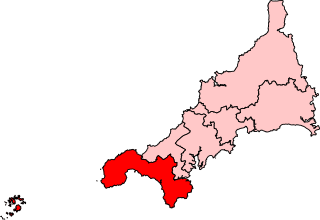
St Ives is a parliamentary constituency covering the western end of Cornwall and the Isles of Scilly. The constituency has been represented in the House of Commons of the UK Parliament since 2024 by Andrew George, a Lib Dem MP; George previously represented the constituency from 1997 to 2015.
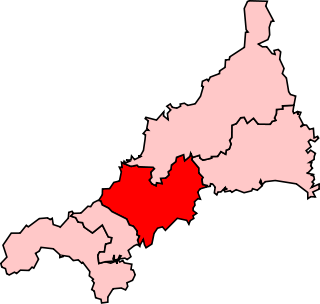
Truro was the name of a parliamentary constituency in Cornwall represented in the House of Commons of England and later of Great Britain from 1295 until 1800, then in the Parliament of the United Kingdom from 1801 to 1918 and finally from 1950 to 1997. Until 1885 it was a parliamentary borough, electing two members of parliament (MPs) by the plurality-at-large system of election; the name was then transferred to the surrounding county constituency, which elected a single Member by the first past the post system. In 1997, although there had been no changes to its boundaries, it was renamed as Truro and St Austell, reflecting the fact that St Austell by then had a larger population than Truro.
Lancaster was a constituency of the House of Commons of the Parliament of England then of the Parliament of Great Britain from 1707 to 1800 and of the Parliament of the United Kingdom from 1801 to 1867, centred on the historic city of Lancaster in north-west England. It was represented by two Members of Parliament until the constituency was disenfranchised for corruption in 1867.
Bewdley was the name of a constituency of the House of Commons of the Parliament of the United Kingdom from 1605 until 1950. Until 1885 it was a parliamentary borough in Worcestershire, represented by one Member of Parliament; the name was then transferred to a county constituency from 1885 until 1950. Its MPs included the former Prime Minister Stanley Baldwin, who represented the seat from 1908 to 1937, and afterwards took the name of the constituency as part of his title when he was raised to the peerage.
Hertford was the name of a parliamentary constituency in Hertfordshire, which elected Members of Parliament (MPs) from 1298 until 1974.
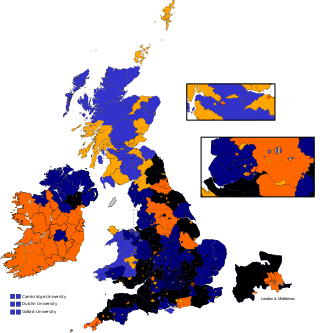
East Cornwall was a county constituency in the House of Commons of the Parliament of the United Kingdom. It elected two Members of Parliament (MPs) by the bloc vote system of election.
West Cornwall was a county constituency in the House of Commons of the Parliament of the United Kingdom. It elected two Members of Parliament (MPs) by the bloc vote system of election.
Penryn and Falmouth was the name of a constituency in Cornwall, England, UK, represented in the House of Commons of the Parliament of the United Kingdom from 1832 until 1950. From 1832 to 1918 it was a parliamentary borough, initially returning two Members of Parliament (MPs), elected by the bloc vote system.
The Cornish rotten and pocket boroughs were one of the most striking anomalies of the Unreformed House of Commons in the Parliament of the United Kingdom before the Reform Act 1832. Immediately before the Act, Cornwall had twenty boroughs, each electing two members of parliament, as well as its two knights of the shire, a total of 42 members, far in excess of the number to which its wealth, population or other importance would seem to entitle it. Until 1821, there was yet another borough which sent two men to parliament, giving Cornwall only one fewer member in the House of Commons than the whole of Scotland.
Liskeard was a parliamentary borough in Cornwall, which elected two Members of Parliament (MPs) to the House of Commons from 1295 until 1832, and then one member from 1832 until 1885. The constituency was abolished by the Redistribution of Seats Act 1885.
A civil parish is a country subdivision, forming the lowest unit of local government in England. There are 218 civil parishes in the ceremonial county of Cornwall, which includes the Isles of Scilly. The county is effectively parished in its entirety; only the unpopulated Wolf Rock is unparished. At the 2001 census, there were 501,267 people living in the current parishes, accounting for the whole of the county's population. The final unparished areas of mainland Cornwall, around St Austell, were parished on 1 April 2009 to coincide with the structural changes to local government in England.
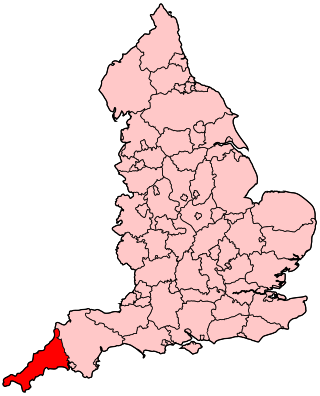
The following outline is provided as an overview of and topical guide to Cornwall: Cornwall – ceremonial county and unitary authority area of England within the United Kingdom. Cornwall is a peninsula bordered to the north and west by the Celtic Sea, to the south by the English Channel, and to the east by the county of Devon, over the River Tamar. Cornwall is also a royal duchy of the United Kingdom. It has an estimated population of half a million and it has its own distinctive history and culture.
Presented below is an alphabetical index of articles related to Cornwall: