Elections to Colchester Borough Council took place in 1994.
Party | Seats | Gains | Losses | Net gain/loss | Seats % | Votes % | Votes | +/− | |
---|---|---|---|---|---|---|---|---|---|
Liberal Democrat | 32 | 4 | 1 | 47.6 | 20,961 | +5.8 | |||
Conservative | 19 | 0 | 2 | 25.8 | 11,349 | -11.7 | |||
Labour | 7 | 1 | 2 | 24.4 | 10,744 | +7.6 | |||
Tiptree Residents | 1 | 0 | 1 | N/A* | N/A* | N/A* | |||
Green | 0 | 0 | 0 | 1.7 | 765 | +0.4 | |||
Independent | 0 | 0 | 0 | 0.6 | 252 | N/A | |||
* Tiptree Residents Association did not stand candidates at the election, but held their one seat on the council which was not up for election this year.
Party | Candidate | Votes | % | ± | |
---|---|---|---|---|---|
Liberal Democrat | W. Sutton | 1,187 | 52.1 | -3.2 | |
Labour | P. Bishop | 819 | 36.0 | +15.1 | |
Conservative | N. Peckston | 272 | 11.9 | -10.9 | |
Majority | |||||
Turnout | |||||
Liberal Democrat hold | Swing | ||||
Party | Candidate | Votes | % | ± | |
---|---|---|---|---|---|
Conservative | P. Crowe | 608 | 50.7 | -0.3 | |
Liberal Democrat | U. Jones | 330 | 27.5 | +4.8 | |
Labour | Julie Young | 261 | 21.8 | -4.5 | |
Majority | |||||
Turnout | |||||
Conservative hold | Swing | ||||
Party | Candidate | Votes | % | ± | |
---|---|---|---|---|---|
Liberal Democrat | Chris Hall | 1,362 | 53.0 | +11.4 | |
Labour | J. Dodge | 689 | 26.8 | -3.3 | |
Conservative | J. Lucas | 415 | 16.1 | -10.1 | |
Green | C. Shaw | 105 | 4.1 | +2.1 | |
Majority | |||||
Turnout | |||||
Liberal Democrat hold | Swing | ||||
Party | Candidate | Votes | % | ± | |
---|---|---|---|---|---|
Liberal Democrat | P. Blandon | 1,244 | 50.3 | -5.7 | |
Labour | J. Bird | 958 | 38.8 | +14.8 | |
Conservative | M. Cole | 206 | 8.3 | -10.3 | |
Green | N. Mills | 63 | 2.5 | +1.1 | |
Majority | |||||
Turnout | |||||
Liberal Democrat gain from Labour | Swing | ||||
Party | Candidate | Votes | % | ± | |
---|---|---|---|---|---|
Liberal Democrat | Ian Trusler | 1,270 | 52.3 | +7.2 | |
Conservative | D. Hensall | 980 | 40.4 | -9.6 | |
Labour | L. Barrett | 176 | 7.3 | +3.2 | |
Majority | |||||
Turnout | |||||
Liberal Democrat hold | Swing | ||||
Party | Candidate | Votes | % | ± | |
---|---|---|---|---|---|
Liberal Democrat | S. Ambury | 1,702 | 49.8 | +19.1 | |
Conservative | J. Fulford | 1,122 | 32.8 | -23.4 | |
Labour | Kim Naish | 499 | 14.6 | +3.7 | |
Green | B. Smith | 93 | 2.7 | +0.5 | |
Majority | |||||
Turnout | |||||
Liberal Democrat gain from Conservative | Swing | ||||
Party | Candidate | Votes | % | ± | |
---|---|---|---|---|---|
Liberal Democrat | Bob Russell | 1,615 | 66.8 | +8.4 | |
Labour | S. Pygott | 587 | 24.3 | -0.9 | |
Conservative | D. McBean | 132 | 5.5 | -7.9 | |
Green | P. Wareham | 85 | 3.5 | +0.5 | |
Majority | |||||
Turnout | |||||
Liberal Democrat hold | Swing | ||||
Party | Candidate | Votes | % | ± | |
---|---|---|---|---|---|
Liberal Democrat | D. Goss | 1,858 | 65.4 | +10.1 | |
Conservative | Ron Levy | 601 | 21.2 | -15.0 | |
Labour | T. Pearson | 339 | 11.9 | +4.1 | |
Green | D. Smith | 43 | 1.5 | +0.9 | |
Majority | |||||
Turnout | |||||
Liberal Democrat hold | Swing | ||||
Party | Candidate | Votes | % | ± | |
---|---|---|---|---|---|
Conservative | R. Lord | 449 | 46.6 | -6.8 | |
Liberal Democrat | Justin Knight | 385 | 39.9 | -6.7 | |
Labour | S. Manning-Press | 96 | 10.0 | N/A | |
Green | Walter Schwarz | 34 | 3.5 | N/A | |
Majority | |||||
Turnout | |||||
Conservative hold | Swing | ||||
Party | Candidate | Votes | % | ± | |
---|---|---|---|---|---|
Liberal Democrat | W. Sandford | 799 | 54.4 | -16.9 | |
Labour | F. Wilkin | 482 | 32.8 | N/A | |
Conservative | S. Wilson | 189 | 12.9 | -15.4 | |
Majority | |||||
Turnout | |||||
Liberal Democrat hold | Swing | ||||
Party | Candidate | Votes | % | ± | |
---|---|---|---|---|---|
Labour | A. Prosser | 846 | 52.7 | +4.5 | |
Liberal Democrat | J. Gary | 588 | 36.6 | +17.9 | |
Conservative | E. Winney | 134 | 8.3 | -20.9 | |
Green | S. Kelly | 37 | 2.3 | -1.6 | |
Majority | |||||
Turnout | |||||
Labour hold | Swing | ||||
Party | Candidate | Votes | % | ± | |
---|---|---|---|---|---|
Liberal Democrat | J. Gamble | 1,208 | 46.8 | +0.5 | |
Labour | M. Frank | 1,180 | 45.7 | +9.5 | |
Conservative | N. Elcombe | 193 | 7.5 | -8.9 | |
Majority | |||||
Turnout | |||||
Liberal Democrat gain from Labour | Swing | ||||
Party | Candidate | Votes | % | ± | |
---|---|---|---|---|---|
Liberal Democrat | J. Barker | 1,668 | 64.3 | +7.2 | |
Conservative | N. Taylor | 605 | 23.3 | -15.2 | |
Labour | T. Pringle | 322 | 12.4 | +9.4 | |
Majority | |||||
Turnout | |||||
Liberal Democrat hold | Swing | ||||
Party | Candidate | Votes | % | ± | |
---|---|---|---|---|---|
Liberal Democrat | N. Silverwood-Cope | 1,116 | 45.2 | -3.7 | |
Conservative | R. Spendlove | 735 | 29.8 | -10.5 | |
Labour | M. Lee | 309 | 12.5 | +3.4 | |
Independent | R. Hudson | 252 | 10.2 | N/A | |
Green | J. Hebbern | 55 | 2.2 | +0.5 | |
Majority | |||||
Turnout | |||||
Liberal Democrat gain from Conservative | Swing | ||||
Party | Candidate | Votes | % | ± | |
---|---|---|---|---|---|
Liberal Democrat | J. Ellis | 1,489 | 58.5 | +1.8 | |
Conservative | I. McCord | 691 | 27.1 | -8.0 | |
Labour | E. Plowright | 366 | 14.4 | +6.2 | |
Majority | |||||
Turnout | |||||
Liberal Democrat hold | Swing | ||||
Party | Candidate | Votes | % | ± | |
---|---|---|---|---|---|
Labour | N. Holland | 879 | 34.8 | +1.4 | |
Conservative | M. Hope | 830 | 32.8 | -10.3 | |
Liberal Democrat | A. Seaman | 717 | 28.4 | N/A | |
Green | V. Bannister | 101 | 4.0 | N/A | |
Majority | |||||
Turnout | |||||
Labour gain from Tiptree Residents | Swing | ||||
Party | Candidate | Votes | % | ± | |
---|---|---|---|---|---|
Liberal Democrat | S. Baldwin | 1,092 | 61.1 | +18.7 | |
Conservative | E. Blundell | 516 | 28.9 | -18.7 | |
Labour | M. Nice | 178 | 10.0 | N/A | |
Majority | |||||
Turnout | |||||
Liberal Democrat hold | Swing | ||||
Party | Candidate | Votes | % | ± | |
---|---|---|---|---|---|
Conservative | M. Kimberley | 1,032 | 51.3 | -23.9 | |
Liberal Democrat | J. Pipe | 640 | 31.8 | +14.2 | |
Labour | Alison Inman | 340 | 16.9 | +9.7 | |
Majority | |||||
Turnout | |||||
Conservative hold | Swing | ||||
Party | Candidate | Votes | % | ± | |
---|---|---|---|---|---|
Conservative | M. Fairhead | 696 | 64.3 | -1.0 | |
Liberal Democrat | A. Burgess | 297 | 27.4 | -7.3 | |
Labour | J. Coombes | 89 | 8.2 | N/A | |
Majority | |||||
Turnout | |||||
Conservative hold | Swing | ||||
Party | Candidate | Votes | % | ± | |
---|---|---|---|---|---|
Labour | R. Richardson | 1,329 | 47.5 | +14.0 | |
Conservative | J. Woodcock | 943 | 33.7 | -14.8 | |
Liberal Democrat | I. O'Mahoney | 374 | 13.4 | 0.0 | |
Green | P. Samphire | 149 | 5.3 | +0.6 | |
Majority | |||||
Turnout | |||||
Labour hold | Swing | ||||
In many countries, a mayor is the highest-ranking official in a municipal government such as that of a city or a town.
A parish council is a civil local authority found in England and is the first tier of local government. They are elected corporate bodies, have variable tax raising powers, and are responsible for areas known as civil parishes, serving in total 16 million people. A parish council serving a town may be called a town council, and a parish council serving a city is styled a city council; these bodies have the same powers, duties and status as a parish council.
Oxfordshire County Council is elected every four years.
A municipal council is the legislative body of a municipality such as a city council or a town council.
Redbridge London Borough Council is elected every four years.
Elections to the Swiss Federal Assembly, the federal parliament of Switzerland, were held on Sunday, 21 October 2007. In a few cantons, a second round of the elections to the Council of States was held on 11 November, 18 November, and 25 November 2007. For the 48th legislative term of the federal parliament (2007–2011), voters in 26 cantons elected all 200 members of the National Council as well as 43 out of 46 members of the Council of States. The other three members of the Council of States for that term of service were elected at an earlier date.
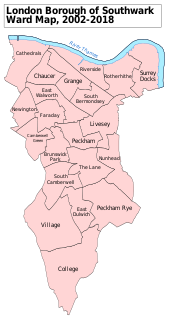
Southwark London Borough Council in London, England is elected every four years. Since the last boundary changes in 2002, 63 councillors have been elected from 21 wards.
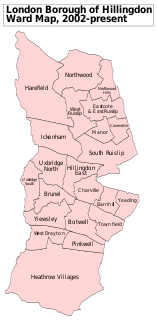
Hillingdon Council in London, England is elected every four years. Since the 2002 boundary changes the council is composed of 65 councillors.
The Tamil Nadu Legislative Assembly alone has powers to legislate laws covering state subjects in the Indian state of Tamil Nadu. It has a strength of 235 members of whom 234 are democratically elected using the First-past-the-post system. The remaining member is nominated as a representative of the Anglo-Indian community. The presiding officer of the Assembly is called the Speaker. The term of the Assembly is five years unless it is dissolved earlier.
Elections for Redbridge London Borough Council were held on 6 May 2010. The 2010 General Election and other local elections took place on the same day.
The 2011 United Kingdom local elections were held on Thursday 5 May 2011. In England, direct elections were held in all 36 Metropolitan boroughs, 194 Second-tier district authorities, 49 unitary authorities and various mayoral posts, meaning local elections took place in all parts of England with the exception of seven unitary authorities, and seven districts and boroughs. For the majority of English districts and the 25 unitary authorities that are elected "all out" these were the first elections since 2007. In Northern Ireland, there were elections to all 26 local councils. Elections also took place to most English parish councils.
The 2014 United Kingdom local elections were held on 22 May 2014. Usually these elections are held on the first Thursday in May but were postponed to coincide with the 2014 European Parliament Elections. Direct elections were held for all 32 London boroughs, all 36 metropolitan boroughs, 74 district/borough councils, 20 unitary authorities and various mayoral posts in England and elections to the new councils in Northern Ireland.
The 2014 Westminster City Council election took place on 22 May 2014 to elect members of Westminster City Council in England. This was on the same day as other local elections.
The 2015 United Kingdom local elections were held on Thursday 7 May 2015, the same day as the general election for the House of Commons of the United Kingdom.
The 2015 Wirral Metropolitan Borough Council election took place on 7 May 2015 to elect members of Wirral Metropolitan Borough Council in England. This election was held on the same day as other local elections.
The 2017 United Kingdom local elections were held on Thursday 4 May 2017. Local elections were held across Great Britain, with elections to 35 English local authorities and all councils in Scotland and Wales.
Council elections in England were held on Thursday 3 May 2018. Elections were held in all 32 London boroughs, 34 metropolitan boroughs, 67 district and borough councils and 17 unitary authorities. There were also direct elections for the mayoralties of Hackney, Lewisham, Newham, Tower Hamlets and Watford.
Local elections in the United Kingdom are scheduled to be held on Thursday 2 May 2019, contesting about 270 English local councils, six directly elected mayors in England, and all 11 local councils in Northern Ireland. Additionally, there will be by-elections for a number of local authority seats.
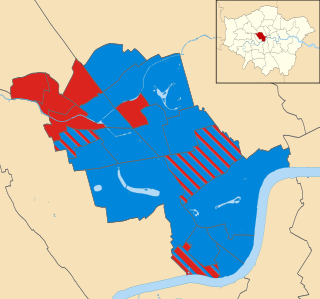
The 2018 Westminster City Council elections were held on 3rd May 2018, the same day as other London Boroughs. All 60 seats were up for election along with the 3 seats of Queen's Park Community Council. Despite initial expectations of Labour gains across the borough, the Conservative party were able to hold the council and only lost 3 seats. The Conservatives won the popular vote across the borough by a small margin of 923 votes (1.7%), but nonetheless won a decisive victory in terms of seats, winning 41 councillors to Labour's 19.