Colwich, Kansas

Last updated

Colwich, Kansas
Sedgwick County Kansas Incorporated and Unincorporated areas Colwich Highlighted.svg
Location within Sedgwick County and Kansas
Map of Sedgwick Co, Ks, USA.png
Coordinates: 37°46′50″N97°32′26″W / 37.78056°N 97.54056°W / 37.78056; -97.54056 [1]
Country United States
State Kansas
County Sedgwick
Founded1887
Incorporated 1887
Area
[2]
  Total
1.34 sq mi (3.46 km2)
  Land1.34 sq mi (3.46 km2)
  Water0 sq mi (0.00 km2)
Elevation
[1]
1,381 ft (421 m)
Population
 (2020) [3]
  Total
1,455
  Density1,090/sq mi (421/km2)
Time zone UTC-6 (CST)
  Summer (DST) UTC-5 (CDT)
ZIP code
67030
Area code 316
FIPS code 20-15100 [1]
GNIS ID 473814 [1]
Website colwichks.org

Colwich is a city in Sedgwick County, Kansas, United States, [1] located northwest of Wichita. As of the 2020 census, the population of the city was 1,455. [3]

Contents

History

Colwich was founded in 1887. [4] The name is a portmanteau of Colorado and Wichita, or the Colorado & Wichita Railroad. [5]

Geography

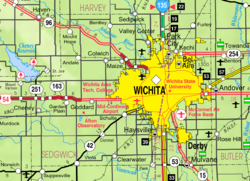
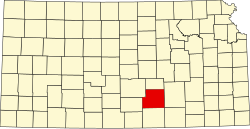
Colwich is northwest of Wichita and centered around the intersection of 53rd St North and 167th St West. According to the United States Census Bureau, the city has a total area of 1.33 square miles (3.44 km2), all land. [6]

Demographics

Colwich is part of the Wichita, KS Metropolitan Statistical Area.

Historical population
CensusPop.Note
1890 212
1900 2256.1%
1910 25814.7%
1920 2621.6%
1930 260−0.8%
1940 2849.2%
1950 33919.4%
1960 703107.4%
1970 87925.0%
1980 9356.4%
1990 1,09116.7%
2000 1,22912.6%
2010 1,3278.0%
2020 1,4559.6%
U.S. Decennial Census

2020 census

The 2020 United States census counted 1,455 people, 535 households, and 404 families in Colwich. [7] [8] The population density was 1,089.9 per square mile (420.8/km2). There were 561 housing units at an average density of 420.2 per square mile (162.2/km2). [8] [9] The racial makeup was 93.75% (1,364) white or European American (92.16% non-Hispanic white), 0.07% (1) black or African-American, 0.89% (13) Native American or Alaska Native, 0.07% (1) Asian, 0.0% (0) Pacific Islander or Native Hawaiian, 0.55% (8) from other races, and 4.67% (68) from two or more races. [10] Hispanic or Latino of any race was 3.37% (49) of the population. [11]

Of the 535 households, 40.2% had children under the age of 18; 59.1% were married couples living together; 19.3% had a female householder with no spouse or partner present. 22.1% of households consisted of individuals and 8.0% had someone living alone who was 65 years of age or older. [8] The average household size was 2.8 and the average family size was 3.2. [12] The percent of those with a bachelor’s degree or higher was estimated to be 20.6% of the population. [13]

27.2% of the population was under the age of 18, 8.7% from 18 to 24, 27.4% from 25 to 44, 22.8% from 45 to 64, and 13.8% who were 65 years of age or older. The median age was 33.9 years. For every 100 females, there were 99.0 males. [8] For every 100 females ages 18 and older, there were 100.6 males. [8]

The 2016-2020 5-year American Community Survey estimates show that the median household income was $79,250 (with a margin of error of +/- $11,321) and the median family income was $84,750 (+/- $18,572). [14] Males had a median income of $57,708 (+/- $8,052) versus $38,542 (+/- $10,000) for females. The median income for those above 16 years old was $45,707 (+/- $6,379). [15] Approximately, 0.0% of families and 0.3% of the population were below the poverty line, including 0.0% of those under the age of 18 and 1.8% of those ages 65 or over. [16] [17]

2010 census

As of the census [18] of 2010, there were 1,327 people, 466 households, and 348 families living in the city. The population density was 997.7 inhabitants per square mile (385.2/km2). There were 480 housing units at an average density of 360.9 per square mile (139.3/km2). The racial makeup of the city was 97.4% White, 0.2% African American, 0.5% Native American, 1.1% from other races, and 0.9% from two or more races. Hispanic or Latino of any race were 2.5% of the population.[ citation needed ]

There were 466 households, of which 44.6% had children under the age of 18 living with them, 59.7% were married couples living together, 9.9% had a female householder with no husband present, 5.2% had a male householder with no wife present, and 25.3% were non-families. 22.3% of all households were made up of individuals, and 10.7% had someone living alone who was 65 years of age or older. The average household size was 2.85 and the average family size was 3.38.[ citation needed ]

The median age in the city was 32.7 years. 34.3% of residents were under the age of 18; 7.7% were between the ages of 18 and 24; 25.9% were from 25 to 44; 21.1% were from 45 to 64; and 11.1% were 65 years of age or older. The gender makeup of the city was 50.1% male and 49.9% female.[ citation needed ]

Education

The community is served by Renwick USD 267 public school district.[ citation needed ]

Transportation

Colwich had passenger rail service until at least fall 1964 on the Missouri Pacific Railroad, sitting on the line from Wichita to Geneseo. [19] As of 2025, the closest passenger rail service is at the Newton station, served by Amtrak's Southwest Chief.[ citation needed ]

References

  1. 1 2 3 4 5 "Colwich, Kansas", Geographic Names Information System , United States Geological Survey, United States Department of the Interior
  2. "2019 U.S. Gazetteer Files". United States Census Bureau. Retrieved July 24, 2020.
  3. 1 2 "Profile of Colwich, Kansas in 2020". United States Census Bureau. Archived from the original on November 14, 2021. Retrieved November 14, 2021.
  4. Blackmar, Frank Wilson (1912). Kansas: A Cyclopedia of State History, Embracing Events, Institutions, Industries, Counties, Cities, Towns, Prominent Persons, Etc. Standard Publishing Company. pp.  392.
  5. Temple, Robert D. Edge Effects: The Border-Name Places, (2nd edition, 2009), iUniverse, ISBN   978-0-595-47758-6, page 324.
  6. "US Gazetteer files 2010". United States Census Bureau. Archived from the original on July 2, 2012. Retrieved July 6, 2012.
  7. "US Census Bureau, Table P16: HOUSEHOLD TYPE". data.census.gov. Retrieved January 2, 2024.
  8. 1 2 3 4 5 "US Census Bureau, Table DP1: PROFILE OF GENERAL POPULATION AND HOUSING CHARACTERISTICS". data.census.gov. Retrieved January 2, 2024.
  9. "Gazetteer Files". Census.gov. United States Census Bureau. Retrieved December 30, 2023.
  10. "US Census Bureau, Table P1: RACE". data.census.gov. Retrieved January 2, 2024.
  11. "US Census Bureau, Table P2: HISPANIC OR LATINO, AND NOT HISPANIC OR LATINO BY RACE". data.census.gov. Retrieved January 2, 2024.
  12. "US Census Bureau, Table S1101: HOUSEHOLDS AND FAMILIES". data.census.gov. Retrieved January 2, 2024.
  13. "US Census Bureau, Table S1501: EDUCATIONAL ATTAINMENT". data.census.gov. Retrieved January 2, 2024.
  14. "US Census Bureau, Table S1903: MEDIAN INCOME IN THE PAST 12 MONTHS (IN 2020 INFLATION-ADJUSTED DOLLARS)". data.census.gov. Retrieved January 2, 2024.
  15. "US Census Bureau, Table S2001: EARNINGS IN THE PAST 12 MONTHS (IN 2020 INFLATION-ADJUSTED DOLLARS)". data.census.gov. Retrieved January 2, 2024.
  16. "US Census Bureau, Table S1701: POVERTY STATUS IN THE PAST 12 MONTHS". data.census.gov. Retrieved January 2, 2024.
  17. "US Census Bureau, Table S1702: POVERTY STATUS IN THE PAST 12 MONTHS OF FAMILIES". data.census.gov. Retrieved January 2, 2024.
  18. "U.S. Census website". United States Census Bureau . Retrieved July 6, 2012.
  19. "MoPac Fall 1964 timetable" (PDF). Retrieved May 14, 2025.

Further reading