The 2015 East Dorset District Council election took place on 7 May 2015 in order to elect members of the East Dorset District Council in Dorset, England. The whole council was up for election after boundary changes reduced the number of seats by seven. [1] The Conservative party stayed in overall control of the council. [2]
East Dorset is a local government district in Dorset, England. Its council is based in Wimborne Minster since 2016.
Non-metropolitan districts, or colloquially "shire districts", are a type of local government district in England. As created, they are sub-divisions of non-metropolitan counties in a two-tier arrangement.
Dorset is a county in South West England on the English Channel coast. The ceremonial county comprises the non-metropolitan county, which is governed by Dorset County Council, and the unitary authority areas of Poole and Bournemouth. Covering an area of 2,653 square kilometres (1,024 sq mi), Dorset borders Devon to the west, Somerset to the north-west, Wiltshire to the north-east, and Hampshire to the east. The county town is Dorchester which is in the south. After the reorganisation of local government in 1974 the county's border was extended eastward to incorporate the Hampshire towns of Bournemouth and Christchurch. Around half of the population lives in the South East Dorset conurbation, while the rest of the county is largely rural with a low population density.
Before the election, the Conservatives controlled the council with 30 councillors, whilst the Liberal Democrats with just six seats were the only other party on the council. [3] However, in December 2014 the former leader of Dorset County Council councillor Spencer Flower was suspended from the Conservative party after being charged by police and both Flower and his wife Toni Coombs stood for re-election as independents at the 2015 election. [4] As they were the only candidates in Verwood West ward they were elected without opposition. [4]
A Councillor is a member of a local government council.
The Liberal Democrats are a liberal political party in the United Kingdom. They presently have 11 Members of Parliament in the House of Commons, 96 members of the House of Lords, and one member of the European Parliament. They also have five Members of the Scottish Parliament and a member each in the Welsh Assembly and London Assembly. The party reached the height of its influence in the early 2010s, forming a junior partner in a coalition government from 2010 to 2015. It is presently led by Vince Cable.
Dorset County Council (DCC) is the county council for the county of Dorset in England. It provides the upper tier of local government, below which are district councils, and town and parish councils. The county council has 46 elected councillors and is based at County Hall in Dorchester. The council is to be abolished on 31 March 2019 as part of structural changes to local government in Dorset.
In three other wards, Crane, Handley Vale and Verwood East, the Conservative candidates were also unopposed. [4] This meant 12 wards had elections in 2015 with a total of 66 candidates contesting them. [4]
Boundary changes since the last election in 2011 reduced the number of councillors from 36 to 29. [1] These changes also reduced the number of wards to 16, with four wards electing three councillors, five electing two and seven electing one. [5]
The Conservatives remained in control of the council with 24 of the 29 seats. [2] The only three contested seats that were not won by the Conservatives, were won by the Liberal Democrats, who won both seats in Wimborne Minster, as well as one seat in Colehill East. [6]
Wimborne Minster is a market town in East Dorset in South West England, and the name of the Church of England church in that town. According to Office for National Statistics data the population of the Wimborne Minster built-up area as of 2014 is estimated as 15,552 inhabitants and is situated at the confluence of the River Stour and River Allen, 5 miles (8 km) north of Poole, on the Dorset Heaths. The town is also recognised as part of the South East Dorset conurbation.
Colehill is a parish, neighbouring Wimborne Minster, in Dorset, England, with a population of 7,000 (2001), reducing slightly to 6,927 at the 2011 census.
Party | Seats | Gains | Losses | Net gain/loss | Seats % | Votes % | Votes | +/− | |
---|---|---|---|---|---|---|---|---|---|
Conservative | 24 | -6 | 82.8 | 55.1 | 44,844 | -5.7% | |||
Liberal Democrat | 3 | -3 | 10.3 | 13.6 | 11,069 | -15.6% | |||
Independent | 2 | +2 | 6.9 | 3.0 | 2,470 | +3.0% | |||
UKIP | 0 | 0 | 0 | 23.6 | 19,240 | +16.3% | |||
Green | 0 | 0 | 0 | 2.4 | 1,985 | +2.4% | |||
Labour | 0 | 0 | 0 | 2.2 | 1,806 | -0.5% |
Party | Candidate | Votes | % | ± | |
---|---|---|---|---|---|
Conservative | Ian Monks | 1,133 | 62.8 | ||
UKIP | Keith Mayo | 338 | 18.7 | ||
Green | Aaron Mudd | 332 | 18.4 | ||
Majority | 795 | 44.1 | |||
Turnout | 1,803 | 71.8 |
Party | Candidate | Votes | % | ± | |
---|---|---|---|---|---|
Conservative | Cathy Lugg | 1,145 | 68.4 | ||
UKIP | Lawrence Wilson | 529 | 31.6 | ||
Majority | 616 | 36.8 | |||
Turnout | 1,674 | 70.0 |
Party | Candidate | Votes | % | ± | |
---|---|---|---|---|---|
Liberal Democrat | Janet Dover | 1,858 | |||
Conservative | K. D. Johnson | 1,333 | |||
Conservative | Graeme Smith | 1,230 | |||
Liberal Democrat | Barry Roberts | 1,080 | |||
UKIP | Brian Lowe | 548 | |||
UKIP | Stefan Morawiec | 415 | |||
Turnout | 6,464 | 73.9 |
Party | Candidate | Votes | % | ± | |
---|---|---|---|---|---|
Conservative | David Packer | 927 | 53.4 | ||
Liberal Democrat | Linda Dickins | 617 | 35.5 | ||
UKIP | Stephen Homer | 193 | 11.1 | ||
Majority | 310 | 17.8 | |||
Turnout | 1,737 | 83.4 |
Party | Candidate | Votes | % | ± | |
---|---|---|---|---|---|
Conservative | Sarah Burns | 2,420 | |||
Conservative | Derek Burt | 2,202 | |||
Conservative | Paul Harrison | 2,018 | |||
Liberal Democrat | Bill Honeyman | 1,924 | |||
Liberal Democrat | Stewart Hearn | 1,791 | |||
Liberal Democrat | Jason Jones | 1,534 | |||
UKIP | Dave Evans | 985 | |||
UKIP | David Mattocks | 940 | |||
UKIP | Josephine Evans | 866 | |||
Labour | David Peden | 452 | |||
Turnout | 15,132 | 71.4 |
Party | Candidate | Votes | % | ± | |
---|---|---|---|---|---|
Conservative | Steve Butler | unopposed |
Party | Candidate | Votes | % | ± | |
---|---|---|---|---|---|
Conservative | Steve Lugg | 2,645 | |||
Conservative | Julie Robinson | 2,351 | |||
Conservative | Peter Oggelsby | 2,315 | |||
UKIP | Geoff Laidlaw | 1,336 | |||
UKIP | Sue Laidlaw | 1,334 | |||
UKIP | Peter Lucas | 1,100 | |||
Labour | David Lee | 744 | |||
Turnout | 11,825 | 68.4 |
Party | Candidate | Votes | % | ± | |
---|---|---|---|---|---|
Conservative | George Russell | 1,374 | 72.9 | ||
UKIP | Lyn Ovens | 511 | 27.1 | ||
Majority | 863 | 45.8 | |||
Turnout | 1,885 | 72.0 |
Party | Candidate | Votes | % | ± | |
---|---|---|---|---|---|
Conservative | Simon Tong | unopposed |
Party | Candidate | Votes | % | ± | |
---|---|---|---|---|---|
Conservative | Barbara Manuel | 1,899 | |||
Conservative | John Wilson | 1,740 | |||
UKIP | Ann Miller | 859 | |||
UKIP | Kenny Pearce | 790 | |||
Independent | Peter Durant | 309 | |||
Green | Nigel Bales | 288 | |||
Green | Martyn Rainer | 246 | |||
Turnout | 6,131 | 74.0 |
Party | Candidate | Votes | % | ± | |
---|---|---|---|---|---|
Conservative | Mike Dyer | 3,386 | |||
Conservative | Ray Bryan | 3,292 | |||
Conservative | Barry Goringe | 3,088 | |||
UKIP | Tony Connor | 1,562 | |||
UKIP | Oliver Kent | 1,413 | |||
UKIP | Alistair Somerville-Ford | 1,203 | |||
Turnout | 13,944 | 74.6 |
Party | Candidate | Votes | % | ± | |
---|---|---|---|---|---|
Conservative | Robin Cook | 944 | 60.8 | ||
Independent | Simon Pritchard | 608 | 39.2 | ||
Majority | 336 | 21.6 | |||
Turnout | 1,552 | 70.4 |
Party | Candidate | Votes | % | ± | |
---|---|---|---|---|---|
Conservative | Simon Gibson | unopposed | |||
Conservative | Boyd Mortimer | unopposed |
Party | Candidate | Votes | % | ± | |
---|---|---|---|---|---|
Independent | Toni Coombs | unopposed | |||
Independent | Spencer Flower | unopposed |
Party | Candidate | Votes | % | ± | |
---|---|---|---|---|---|
Conservative | Alexander Clarke | 2,736 | |||
Conservative | David Shortell | 2,351 | |||
Conservative | Andy Skeats | 2,313 | |||
UKIP | Bob Blake | 1,267 | |||
Independent | Peter Holden | 1,157 | |||
UKIP | Linda Hills | 1,136 | |||
UKIP | Peter Hills | 1,005 | |||
Green | Mike Hawkes | 637 | |||
Labour | Brian Cropper | 610 | |||
Turnout | 13,212 | 73.3 |
Party | Candidate | Votes | % | ± | |
---|---|---|---|---|---|
Liberal Democrat | Shane Bartlett | 1,155 | |||
Liberal Democrat | David Morgan | 1,110 | |||
Conservative | Kelly Webb | 1,096 | |||
Conservative | Sally Elliot | 906 | |||
Green | Susan Durant | 482 | |||
UKIP | Nick Wellstead | 473 | |||
UKIP | Stuart Evans | 437 | |||
Independent | Shirley Mear | 204 | |||
Independent | Edward Beardsley | 192 | |||
Turnout | 6,055 | 68.1 |
Party | Candidate | Votes | % | ± | |
---|---|---|---|---|---|
Conservative | Gina Logan | 384 | 47.5 | ||
Liberal Democrat | David Tooke | 376 | 46.5 | ||
Labour | Christopher Archibold | 49 | 6.1 | ||
Majority | 8 | 1 | |||
Turnout | 809 | 33.3 | |||
Conservative hold | Swing |
Party | Candidate | Votes | % | ± | |
---|---|---|---|---|---|
Conservative | Andrew Parry | 631 | 54.3 | ||
UKIP | Lawrence Wilson | 396 | 34.1 | ||
Liberal Democrat | Jason Jones | 84 | 7.2 | ||
Labour | Brian Cropper | 52 | 4.5 | ||
Majority | 235 | 20.2 | |||
Turnout | 1163 | 24.3 | |||
Conservative hold | Swing |
Party | Candidate | Votes | % | ± | |
---|---|---|---|---|---|
Conservative | Colin Beck | 706 | 75.1 | ||
Labour | Sandra Turner | 234 | 24.9 | ||
Majority | 472 | 50.2 | |||
Turnout | 940 | 20.4 | |||
Conservative hold | Swing |
Guildford Council in Surrey, England is elected every four years.
One-third of Weymouth and Portland District Council in Dorset, England, is elected each year, followed by one year where there is an election to Dorset County Council instead.
The 2004 St Albans City and District Council election took place on 10 June 2004 to elect members of St Albans District Council in Hertfordshire, England. One third of the council was up for election and the council stayed under no overall control.
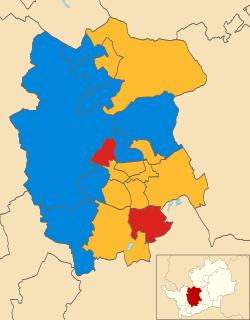
The 2006 St Albans City and District Council election took place on 4 May 2006 to elect members of St Albans District Council in Hertfordshire, England. One third of the council was up for election and the Liberal Democrats gained overall control of the council from no overall control.
The 2014 St Albans City and District Council election took place on 22 May 2014 to elect members of St Albans District Council in Hertfordshire, England. One third of the council was up for election and the council stayed under no overall control.
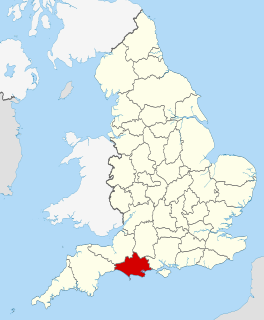
The 2007 East Dorset District Council election took place on 3 May 2007 to elect members of East Dorset District Council in Dorset, England. The whole council was up for election and the Conservative party stayed in overall control of the council.
The 2011 East Dorset District Council election took place on 5 May 2011 to elect members of East Dorset District Council in Dorset, England. The whole council was up for election and the Conservative party stayed in overall control of the council.
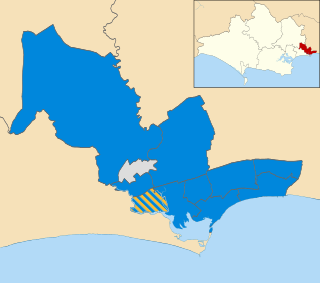
The 2015 North Dorset District Council election took place on the 7th May 2015 to elect members of North Dorset District Council in England. This was on the same day as other local elections. All 33 seats were up for election, in 19 different wards. The Conservative party stayed in overall control of the council.
The 2003 Wychavon District Council election took place on 1 May 2003 to elect members of Wychavon District Council in Worcestershire, England. The whole council was up for election with boundary changes since the last election in 1999 reducing the number of seats by four. The Conservative party stayed in overall control of the council.
The 2015 Harlow District Council election took place on 7 May 2015 to elect members of Harlow District Council in Essex, England. One third of the council was up for election and Labour party councillors increased their control of the council as the governing group, gaining one councillor and suffering no losses.
The 2003 Christchurch Borough Council election took place on 1 May 2003 to elect members of Christchurch Borough Council in Dorset, England. The whole council was up for election after boundary changes reduced the number of seats by one. The Conservative party stayed in overall control of the council.
The 2007 Christchurch Borough Council election took place on 3 May 2007 to elect members of Christchurch Borough Council in Dorset, England. The whole council was up for election and the Conservative party stayed in overall control of the council.
The 2011 Christchurch Borough Council election took place on 5 May 2011 to elect members of Christchurch Borough Council in Dorset, England. The whole council was up for election and the Conservative party stayed in overall control of the council.
The 2015 Christchurch Borough Council election took place on 7 May 2015 to elect members of Christchurch Borough Council in Dorset, England. The whole council was up for election and the Conservative party stayed in overall control of the council.
The 2015 Wychavon District Council election took place on 7 May 2015 to elect members of Wychavon District Council in Worcestershire, England. The whole council was up for election and the Conservative party stayed in overall control of the council.
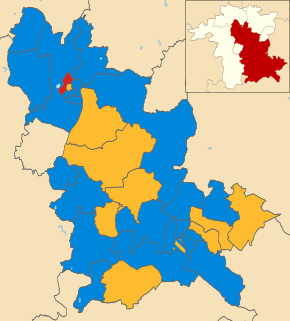
The 2008 West Oxfordshire District Council election took place on 1 May 2008 to elect members of West Oxfordshire District Council in Oxfordshire, England. One third of the council was up for election and the Conservative party stayed in overall control of the council.
The 2011 West Oxfordshire District Council election took place on 5 May 2011 to elect members of West Oxfordshire District Council in Oxfordshire, England. One third of the council was up for election and the Conservative party stayed in overall control of the council.
The 2014 West Oxfordshire District Council election took place on 22 May 2014 to elect members of West Oxfordshire District Council in Oxfordshire, England. One third of the council was up for election and the Conservative party stayed in overall control of the council.
The 2015 West Oxfordshire District Council election took place on 22 May 2015 to elect members of West Oxfordshire District Council in Oxfordshire, England. One third of the council was up for election and the Conservative party stayed in overall control of the council.