List of countries by research and development spending

Last updated

This is a list of countries by research and development (R&D) spending in real terms and as per latest data available. Gross domestic spending on R&D is defined as the total expenditure (current and capital) on R&D carried out by all resident companies, research institutes, university and government laboratories, etc., in a country. It includes R&D funded from abroad, but excludes domestic funds for R&D performed outside the domestic economy. [1]

Contents

List

Only those nations which annually spend more than 50 million dollars have been included. The world's total nominal R&D spending was approximately one trillion dollars in 2010. [2]

Country/RegionExpenditures on R&D
(billions of US$, PPP)
 % of GDP PPPExpenditures on R&D per capita
(US$ PPP)
YearSource
1Flag of the United States.svg  United States 612.7143.11,8662019 [3]
2Flag of the People's Republic of China.svg  China 514.7982.23682019 [3]
3Flag of Japan.svg  Japan 172.6143.21,3752019 [3]
4Flag of India.svg  India 158.6911.31202022 [4]
5Flag of Germany.svg  Germany 131.9323.21,5862019 [3]
6Flag of South Korea.svg  South Korea 100.0554.61,9352019 [3]
7Flag of France.svg  France 63.6582.29442019 [3]
8Flag of the United Kingdom.svg  United Kingdom 51.7021.87622019 [3]
9Flag of the Republic of China.svg  Taiwan 42.9453.51,8222019 [3]
10Flag of Russia.svg  Russia 38.5491.02632019 [3]
11Flag of Brazil.svg  Brazil 38.01.31812017 [5]
12Flag of Italy.svg  Italy 33.8401.45612019 [3]
13Flag of Canada (Pantone).svg  Canada 26.6361.57002019 [3]
14Flag of Australia (converted).svg  Australia 25.581.81,0082019 [6]
15Flag of Turkey.svg  Turkey 24.8271.12972019 [3]
16Flag of Spain.svg  Spain 22.4681.34732019 [3]
17Flag of the Netherlands.svg  Netherlands 20.1672.211542019 [3]
18Flag of Sweden.svg  Sweden 17.7223.41,7072019 [3]
19Flag of Israel.svg  Israel 16.8884.91,8102019 [3]
20Flag of Poland.svg  Poland 16.0861.34202019 [3]
21Flag of Belgium (civil).svg  Belgium 16.0432.91,3952019 [3]
22Flag of Austria.svg  Austria 14.9453.21,6722019 [3]
23Flag of Switzerland.svg   Switzerland 13.13.01,6482012 [7]
24Flag of Thailand.svg  Thailand 12.41.01802017 [8]
25Flag of Indonesia.svg  Indonesia 10.7580.3402021 [9]
26Flag of Malaysia.svg  Malaysia 10.61.33442015 [10]
27Flag of Singapore.svg  Singapore 10.02.21,8322014 [5]
28Flag of Mexico.svg  Mexico 9.00.92382014 [7]
29Flag of Denmark.svg  Denmark 8.23.11,4502014 [5]
30Flag of Finland.svg  Finland 7.22.81,3182018 [5]
31Flag of the Czech Republic.svg  Czech Republic 6.32.06002014 [7]
32Flag of Egypt.svg  Egypt 6.20.7732013 [10]
33Flag of South Africa.svg  South Africa 6.10.81082016 [8]
34Flag of Norway.svg  Norway 5.81.71,1242014 [5]
35Flag of Argentina.svg  Argentina 5.00.51122018 [7] [8] [11] [12]
36Flag of the United Arab Emirates.svg  United Arab Emirates 4.30.74712014 [5]
37Flag of Ireland.svg  Ireland 3.61.57792014 [5]
38Flag of Portugal.svg  Portugal 3.61.33482014 [7]
39Flag of Hungary.svg  Hungary 3.41.43432014 [7]
40Flag of Ukraine.svg  Ukraine 3.00.8742013 [10]
41Flag of Hong Kong.svg  Hong Kong 2.70.73732012 [10]
42Flag of Greece.svg  Greece 2.41.02172014 [7] [13] [11]
43Flag of Pakistan.svg  Pakistan 2.40.3132013 [10]
44Flag of Romania.svg  Romania 2.30.51142016 [8]
45Flag of New Zealand.svg  New Zealand 1.81.24012013 [7]
46Flag of Saudi Arabia.svg  Saudi Arabia 1.80.3602012 [14] [15]
47Flag of Colombia.svg  Colombia 1.60.2312014 [10] [8] [11]
48Flag of Chile.svg  Chile 1.50.4872014 [7] [8] [11]
49Flag of Slovenia.svg  Slovenia 1.52.47132014 [7]
50Flag of Morocco.svg  Morocco 1.50.7482010 [10]
51Flag of Slovakia.svg  Slovakia 1.40.92512014 [7]
52Flag of Qatar.svg  Qatar 1.30.56992012 [10]
53Flag of Belarus.svg  Belarus 1.10.71182013 [10]
54Flag of Vietnam.svg  Vietnam 0.90.2102011 [16]
55Flag of Kuwait.svg  Kuwait 0.80.32142013 [10]
56Flag of Bulgaria.svg  Bulgaria 0.80.71122013 [17]
57Flag of Ecuador.svg  Ecuador 0.80.4502016 [8] [11]
58Flag of Ethiopia.svg  Ethiopia 0.80.692013 [10]
59Flag of Tunisia.svg  Tunisia 0.80.7732012 [10]
60Flag of Lithuania.svg  Lithuania 0.80.92452017 [17]
61Flag of Luxembourg.svg  Luxembourg 0.71.31,2532014 [5]
62Flag of Croatia.svg  Croatia 0.70.81672013 [17]
63Flag of Serbia.svg  Serbia 0.70.7982013 [17]
64Flag of Iran.svg  Iran 0.70.192014 [18]
65Flag of Kazakhstan.svg  Kazakhstan 0.70.2392013 [10]
66Flag of the Philippines.svg  Philippines 0.50.152007 [10]
67Flag of Peru.svg  Peru 0.40.1132015 [13] [8] [11]
68Flag of Estonia.svg  Estonia 0.31.64532019 [19]
69Flag of Azerbaijan.svg  Azerbaijan 0.30.2362013 [10]
70Flag of Latvia.svg  Latvia 0.30.51372017 [17]
71Flag of Uganda.svg  Uganda 0.30.582010 [10]
72Flag of Costa Rica.svg  Costa Rica 0.30.5622011 [10]
73Flag of Iceland.svg  Iceland 0.31.98312014 [5]
74Flag of Mongolia.svg  Mongolia 0.30.2742013 [10]
75Flag of Uruguay.svg  Uruguay 0.20.3702015 [10] [8] [11]
76Flag of Sudan.svg  Sudan 0.20.252007 [13]
77Flag of Algeria.svg  Algeria 0.20.142007 [13]
78Flag of Cyprus.svg  Cyprus 0.10.51512013 [17]
79Flag of North Macedonia.svg  North Macedonia 0.10.4562013 [10]
80Flag of Bosnia and Herzegovina.svg  Bosnia and Herzegovina 0.10.3322013 [10]
81Flag of Malta.svg  Malta 0.10.92712013 [17]
82Bandera de Bolivia (Estado).svg  Bolivia 0.10.272012 [8] [11]
83Flag of Botswana.svg  Botswana 0.10.3372012 [10]
84Flag of Oman.svg  Oman 0.10.2252013 [10]
85Flag of Macau.svg  Macau 0.10.11222014 [5]
86Flag of Moldova.svg  Moldova 0.10.4162013 [10]
87Flag of Bahrain.svg  Bahrain 0.10.1452014 [5]
88Flag of Paraguay.svg  Paraguay 0.10.192015 [8] [11]
89Flag of Georgia.svg  Georgia 0.10.2152014 [10]
90Flag of Montenegro.svg  Montenegro 0.00.4562013 [17]

See also

Related Research Articles

Economy of Ecuador National economy

The economy of Ecuador is the eighth largest in Latin America and the 69th largest in the world by total GDP. Ecuador's economy is based on the export of oil, bananas, shrimp, gold, other primary agricultural products and money transfers from Ecuadorian emigrants employed abroad. In 2017, remittances constituted 2.7% of country's GDP. The total trade amounted to 98% of the Ecuador's GDP in 2017.

Gross domestic product Market value of goods and services produced within a country

Gross domestic product (GDP) is a monetary measure of the market value of all the final goods and services produced in a specific time period by countries. Due to its complex and subjective nature this measure is often revised before being considered a reliable indicator. GDP (nominal) per capita does not, however, reflect differences in the cost of living and the inflation rates of the countries; therefore, using a basis of GDP per capita at purchasing power parity (PPP) may be more useful when comparing living standards between nations, while nominal GDP is more useful comparing national economies on the international market. Total GDP can also be broken down into the contribution of each industry or sector of the economy. The ratio of GDP to the total population of the region is the per capita GDP.

Economy of Sierra Leone National economy

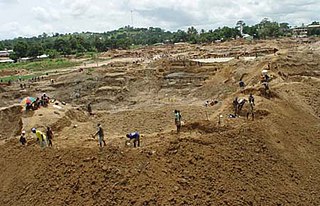
The economy of Sierra Leone is $4.082 billion by gross domestic product as of 2018. Since the end of the Sierra Leone Civil War in 2002, the economy is gradually recovering with a gross domestic product growth rate between 4 and 7%. In 2008 it in PPP ranked between 147th by World Bank, and 153rd by CIA, largest in the world.

Economy of the Gambia National economy

The economy of the Gambia is heavily reliant on agriculture. The Gambia has no significant mineral or other natural resources, and has a limited agricultural base. About 75% of the population depends on crops and livestock for its livelihood. Small-scale manufacturing activity features the processing of peanuts, fish, and animal hides.

The world economy or global economy is the economy of all humans of the world, referring to the global economic system which includes all economic activities which are conducted both within and between nations, including production, consumption, economic management, work in general, exchange of financial values and trade of goods and services. In some contexts, the two terms are distinct "international" or "global economy" being measured separately and distinguished from national economies while the "world economy" is simply an aggregate of the separate countries' measurements. Beyond the minimum standard concerning value in production, use and exchange, the definitions, representations, models and valuations of the world economy vary widely. It is inseparable from the geography and ecology of planet Earth.

Research and development General term for activities in connection with corporate or governmental innovation

Research and development, known in Europe as research and technological development (RTD), is the set of innovative activities undertaken by corporations or governments in developing new services or products, and improving existing ones. Research and development constitutes the first stage of development of a potential new service or the production process.

Government spending Government consumptions, investments, and transfer payments

Government spending or expenditure includes all government consumption, investment, and transfer payments. In national income accounting, the acquisition by governments of goods and services for current use, to directly satisfy the individual or collective needs of the community, is classed as government final consumption expenditure. Government acquisition of goods and services intended to create future benefits, such as infrastructure investment or research spending, is classed as government investment. These two types of government spending, on final consumption and on gross capital formation, together constitute one of the major components of gross domestic product.

Gross national income Total domestic and foreign economic output claimed by residents of a country

The gross national income (GNI), previously known as gross national product (GNP), is the total domestic and foreign output claimed by residents of a country, consisting of gross domestic product (GDP), plus factor incomes earned by foreign residents, minus income earned in the domestic economy by nonresidents. Comparing GNI to GDP shows the degree to which a nation's GDP represents domestic or international activity. GNI has gradually replaced GNP in international statistics. While being conceptually identical, it is calculated differently. GNI is the basis of calculation of the largest part of contributions to the budget of the European Union. In February 2017, Ireland's GDP became so distorted from the base erosion and profit shifting ("BEPS") tax planning tools of U.S. multinationals, that the Central Bank of Ireland replaced Irish GDP with a new metric, Irish Modified GNI. In 2017, Irish GDP was 162% of Irish Modified GNI.

Funding of science

Research funding is a term generally covering any funding for scientific research, in the areas of natural science, technology, and social science. Different methods can be used to disburse funding, but the term often connotes funding obtained through a competitive process, in which potential research projects are evaluated and only the most promising receive funding. It is often measured via Gross domestic expenditure on R&D (GERD).

Income in India Overview of the income in India

Income in India discusses the financial state in India. With rising economic growth and prosperity, India’s income is also rising rapidly. As an overview, India's per capita net national income or NNI was around 135 thousand rupees in 2020. The per-capita income is a crude indicator of the prosperity of a country. In contrast, the gross national income at constant prices stood at over 128 trillion rupees. The same year, GNI growth rate at constant prices was around 6.6 percent. While GNI and NNI are both indicators for a country's economic performance and welfare, the GNI is related to the GDP or the gross domestic product plus the net receipts from abroad, including wages and salaries, property income, net taxes and subsidies receivable from abroad. On the other hand, the NNI of a country is equal to its GNI net of depreciation.

Research and development intensity is generally defined as expenditures by a firm on its research and development (R&D) divided by the firm's sales. There are two types of R&D intensity: direct and indirect. R&D intensity varies, in general, according to a firm's industry sector, product knowledge, manufacturing, and technology, and is a metric that can be used to gauge the level of a company's investment to spur innovation in and through basic and applied research. A further aim of R&D spending, ultimately, is to increase productivity as well as an organization's salable output.

Historical GDP of China Overview of economic growth and decline in the East Asian country

This article includes a list of China's historical gross domestic product (GDP) values, the market value of all final goods and services produced by a nation in a given year. The GDP dollar estimates presented here are either calculated at market or government official exchange rates (nominal), or derived from purchasing power parity (PPP) calculations. This article also includes historical GDP growth.

Expenditure for scientific research and Development in Albania does not exceed 0.18% of GDP, which marks the lowest level in Europe. Economic competitiveness and exports are low, with the economy still heavily skewed towards low technology.

The International Comparison Program is a partnership of various statistical administrations of up to 199 countries guided by the World Bank. The main partners of this program are the World Bank, IMF, UN, ADB, OECD, CISSTAT, Eurostat, AfDB ESCWA, ECLAC, DFID, ABS, IDB, NMoFA who are also all part of the executive board.

This is a list of countries by gross national savings. Gross national saving is derived by deducting final consumption expenditure from Gross national disposable income, and consists of personal saving, plus business saving, plus government saving, but excludes foreign saving. The figures are presented as a percent of GDP. A negative number indicates that the economy as a whole is spending more income than it produces, thus drawing down national wealth.

References

  1. "Research and development (R&D) - Gross domestic spending on R&D - OECD Data". theOECD. Retrieved 2022-08-10.
  2. "- Royal Society" (PDF). royalsociety.org.
  3. 1 2 3 4 5 6 7 8 9 10 11 12 13 14 15 16 17 18 19 "OECD data: Gross domestic spending on R&D".
  4. "Research and development expenditure (% of GDP) - India". worldbank.org.
  5. 1 2 3 4 5 6 7 8 9 10 11 "Research and development expenditure (% of GDP) | Data". data.worldbank.org. Retrieved 2017-02-28.
  6. "Research and Experimental Development, Businesses, Australia, 2019-20 financial year | Australian Bureau of Statistics". www.abs.gov.au. 2021-03-09. Retrieved 2022-05-20.
  7. 1 2 3 4 5 6 7 8 9 10 11 "Research and development (R&D) – Gross domestic spending on R&D – OECD Data". data.oecd.org. Retrieved 2016-02-10.
  8. 1 2 3 4 5 6 7 8 9 10 11 "How Much Does Your Country Invest in R&D?". UNESCO.
  9. "Terbongkar! Ini Alasan Anggaran R&D RI Hanya 0,28% Dari PDB". CNBC Indonesia.
  10. 1 2 3 4 5 6 7 8 9 10 11 12 13 14 15 16 17 18 19 20 21 22 23 24 25 "Research and development expenditure (% of GDP)". World Bank. Retrieved 2016-02-09.
  11. 1 2 3 4 5 6 7 8 9 "Science, technology and innovation". UNESCO.
  12. "Inversión en I+D". Argentina.gob.ar. Retrieved 2020-11-07.
  13. 1 2 3 4 "UNESCO science report, 2010: the current status of science around the world; 2010" (PDF). Retrieved 2018-07-24.
  14. "2012 Global R&D Funding Forecast: R&D Spending Growth Continues While Globalization Accelerates". 16 December 2011.
  15. "Data" (PDF). www.natureasia.com.
  16. vietnamnet.vn. "How much does Vietnam spend on R&D? – News VietNamNet". english.vietnamnet.vn. Retrieved 2016-02-10.
  17. 1 2 3 4 5 6 7 8 "File:Gross domestic expenditure on R&D, 2003–13 (% of GDP) YB15.png – Statistics Explained". ec.europa.eu.
  18. "مصاحبه تفصیلی فارس با قائم‌مقام معاون تحقیقات وزارت بهداشت/۱ رشد علمی کشور پارسال منفی شد/ تحقیقات پزشکی بدون بودجه درجا می‌زند". Farsnews.ir. Retrieved 2018-07-24.
  19. "TD052: Research and development expenditures and their financing from state and local budgets". Eesti Statistkaamet. Retrieved 2018-11-13.