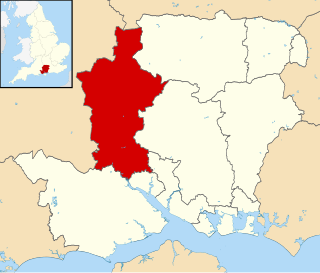
Elections to Test Valley Borough Council were held on 5 May 2011, the same day as the United Kingdom Alternative Vote referendum, 2011. The Conservatives maintained control of the council, with an increased majority. [1]
Test Valley is a local government district and borough in Hampshire, England, named after the valley of the River Test. Its council is based in Andover.
The Conservative Party, officially the Conservative and Unionist Party, is a centre-right political party in the United Kingdom. Presently led by Theresa May, it has been the governing party since 2010. It presently has 314 Members of Parliament in the House of Commons, 249 members of the House of Lords, and 18 members of the European Parliament. It also has 31 Members of the Scottish Parliament, 12 members of the Welsh Assembly, eight members of the London Assembly and 9,008 local councillors. One of the major parties of UK politics, it has formed the government on 45 occasions, more than any other party.
Before the election, the council consisted of 33 Conservatives, 14 Liberal Democrats and 1 Independent. [1]
The Liberal Democrats are a liberal, centrist political party in the United Kingdom. They presently have 11 Members of Parliament in the House of Commons, 96 members of the House of Lords, and one member of the European Parliament. They also have five Members of the Scottish Parliament and a member each in the Welsh Assembly and London Assembly. The party reached the height of its influence in the early 2010s, forming a junior partner in a coalition government from 2010 to 2015. It is presently led by Vince Cable.
Only the Conservatives contested all 48 seats. The Liberal Democrats contested 43 seats, while Labour contested 14, the UK Independence Party 7 and the Greens 2. There were also 3 independent candidates. Two wards, Bourne Valley and Over Wallop, were uncontested, meaning the Conservative candidates were elected by default.
The Labour Party is a centre-left political party in the United Kingdom which has been described as an alliance of social democrats, democratic socialists and trade unionists. The party's platform emphasises greater state intervention, social justice and strengthening workers' rights. Labour is a full member of the Party of European Socialists and Progressive Alliance, and holds observer status in the Socialist International. As of 2017, the party was considered the "largest party in Western Europe" in terms of party membership, with more than half a million members.
The UK Independence Party is a hard Eurosceptic, right-wing political party in the United Kingdom. It currently has one representative in the House of Lords and seven Members of the European Parliament (MEPs). It has four Assembly Members (AMs) in the National Assembly for Wales and one member in the London Assembly. The party reached its greatest level of success in the mid-2010s, when it gained two Members of Parliament and was the largest UK party in the European Parliament.
The Green Party of England and Wales is a green, left-wing political party in England and Wales. Headquartered in London, since September 2018, its Co-Leaders are Siân Berry and Jonathan Bartley. The Green Party has one Member of Parliament in the House of Commons, one representative in the House of Lords, and three Members of the European Parliament. It has various councillors in UK local government and two members of the London Assembly.
Despite all 48 seats being up for election, only three changed hands: The Conservatives gained two seats in Andover, both from the Liberal Democrats, and, in the Abbey Ward of Romsey, defeated Independent Sally Lamb, who had been previously elected as a Liberal Democrat.
Andover is a town in the English county of Hampshire. The town is on the River Anton, a major source of the Test, 18 miles (29 km) west of the town of Basingstoke, both major rail stops. It is 15 miles (24 km) NNW of the city of Winchester, 25 miles (40 km) north of the city of Southampton and 65 miles (105 km) WSW of London. Andover is twinned with the towns of Redon in France, Goch in Germany, and Andover, Massachusetts in the United States.
Romsey is a market town in the county of Hampshire, England.
Party | Seats | Gains | Losses | Net gain/loss | Seats % | Votes % | Votes | +/− | |
---|---|---|---|---|---|---|---|---|---|
Conservative | 36 | 3 | 0 | +3 | 75 | 56.3 | 47,760 | ||
Liberal Democrat | 12 | 0 | 2 | -2 | 25 | 32.8 | 27,774 | ||
Labour | 0 | 0 | 0 | 0 | 0 | 5.4 | 4,564 | ||
UKIP | 0 | 0 | 0 | 0 | 0 | 3.3 | 2,824 | ||
Green | 0 | 0 | 0 | 0 | 0 | 0.8 | 691 | ||
Independent | 0 | 0 | 1 | -1 | 0 | 1.4 | 1,180 | ||
Total | 48 | 84,793 | |||||||
1 seat
Party | Candidate | Votes | % | ± | |
---|---|---|---|---|---|
Conservative | Martin Hatley | 806 | 70.8 | -9.2 | |
Liberal Democrat | Clive Anderson | 198 | 17.4 | +1.9 | |
Labour | David Stevens | 125 | 11.0 | +7.1 | |
Majority | 608 | ||||
Rejected ballots | 10 | 0.8 | {{{change}}} | ||
Turnout | 1,139 | 61.7% | |||
Conservative hold | Swing | ||||
1 seat
Party | Candidate | Votes | % | ± | |
---|---|---|---|---|---|
Conservative | Ben Few Brown | 699 | 72.3 | N/A | |
Liberal Democrat | Dominic Mills | 219 | 22.6 | N/A | |
Majority | 480 | ||||
Rejected ballots | 49 | 5.1 | {{{change}}} | ||
Turnout | 968 | 52.3% | |||
Conservative hold | Swing | N/A | |||
3 seats
Party | Candidate | Votes | % | ± | |
---|---|---|---|---|---|
Conservative | Phil North | 1086 | 50.3 | ||
Conservative | Janet Whiteley | 993 | 46.0 | ||
Conservative | Alex Brook | 963 | 44.6 | ||
Liberal Democrat | Len Gates | 840 | 38.9 | ||
Liberal Democrat | Kevin Hughes | 796 | 36.9 | ||
Liberal Democrat | Robin Hughes | 739 | 34.2 | ||
Labour | Martin Bell | 370 | 17.1 | ||
Rejected ballots | 15 | 0.7 | {{{change}}} | ||
Turnout | 2158 | 34.3% | |||
Conservative hold | Swing | ||||
Conservative gain from Liberal Democrat | Swing | ||||
3 seats
Party | Candidate | Votes | % | ± | |
---|---|---|---|---|---|
Conservative | Brian Page | 1,206 | |||
Conservative | Karen Hamilton | 1,193 | |||
Conservative | Carl Borg-Neal | 1,142 | |||
Labour | Jonathan Ridge | 487 | |||
UKIP | Tim Rolt | 429 | |||
Liberal Democrat | Ryan Hughes | 373 | |||
Liberal Democrat | Josie Msonthi | 329 | |||
Liberal Democrat | Andrew Whiteley | 314 | |||
Rejected ballots | 23 | {{{change}}} | |||
Turnout | 2,367 | 39.9% | |||
Conservative hold | Swing | ||||
3 seats
Party | Candidate | Votes | % | ± | |
---|---|---|---|---|---|
Conservative | Zilliah Brooks | 1,486 | |||
Conservative | Sandra Hawke | 1,321 | |||
Conservative | Ian Robin | 1,247 | |||
Liberal Democrat | Ross Fifield | 446 | |||
Liberal Democrat | Barbara Carpenter | 432 | |||
Labour | John Newland | 386 | |||
UKIP | Laurie Manifold | 348 | |||
Liberal Democrat | Margaret Henstock | 311 | |||
Rejected ballots | 10 | {{{change}}} | |||
Turnout | 2,365 | 40.5% | |||
Conservative hold | Swing | ||||
3 seats
Party | Candidate | Votes | % | ± | |
---|---|---|---|---|---|
Conservative | Iris Andersen | 750 | |||
Liberal Democrat | Katherine Bird | 700 | |||
Liberal Democrat | Nigel Long | 682 | |||
Conservative | Katie Brooks | 644 | |||
Conservative | David Denny | 640 | |||
Liberal Democrat | Vincent McGarry | 540 | |||
Labour | Andy Fitchet | 457 | |||
UKIP | Anthony McCabe | 366 | |||
Independent | Donald MacDonald | 257 | |||
Independent | Peter Mather | 250 | |||
Rejected ballots | 11 | {{{change}}} | |||
Turnout | 2,086 | 34.6% | |||
Conservative gain from Liberal Democrat | Swing | ||||
Liberal Democrat hold | Swing | ||||
3 seats
Party | Candidate | Votes | % | ± | |
---|---|---|---|---|---|
Conservative | Chris Lynn | 1,307 | |||
Conservative | Jan Budzynski | 1,020 | |||
Conservative | Jan Lovell | 1,004 | |||
Liberal Democrat | Dave Campbell | 669 | |||
UKIP | Peter Sumner | 614 | |||
Liberal Democrat | Sid Dajani | 547 | |||
Liberal Democrat | Peter Wilson | 547 | |||
UKIP | Bill McCabe | 537 | |||
Labour | Adam Jones | 438 | |||
Rejected ballots | 24 | {{{change}}} | |||
Turnout | 2,668 | 43.0% | |||
Conservative hold | Swing | ||||
2 seats
Party | Candidate | Votes | % | ± | |
---|---|---|---|---|---|
Conservative | Maureen Flood | 1,341 | |||
Conservative | Graham Stallard | 1,071 | |||
Liberal Democrat | Ben Harrington-Ellsmore | 394 | |||
UKIP | Stan Oram | 372 | |||
Rejected ballots | 28 | {{{change}}} | |||
Turnout | 1,947 | 52.3% | |||
Conservative hold | Swing | ||||
2 seats
Party | Candidate | Votes | % | ± | |
---|---|---|---|---|---|
Conservative | Tony Gentle | 1,495 | |||
Conservative | Gordon Bailey | 1,435 | |||
Liberal Democrat | Philip Green | 492 | |||
Liberal Democrat | Mike Curtis | 361 | |||
Labour | Albert Astbury | 166 | |||
Rejected ballots | 16 | {{{change}}} | |||
Turnout | 2,176 | 52,4% | |||
Conservative hold | Swing | ||||
1 seat
Party | Candidate | Votes | % | ± | |
---|---|---|---|---|---|
Conservative | Peter Giddings | Uncontested | N/A | N/A | |
Majority | N/A | ||||
Rejected ballots | N/A | {{{change}}} | |||
Turnout | N/A | ||||
Conservative hold | Swing | ||||
2 seats
Party | Candidate | Votes | % | ± | |
---|---|---|---|---|---|
Conservative | Peter Boulton | 1,489 | |||
Conservative | Daniel Busk | 1,343 | |||
Liberal Democrat | Jennifer Warren | 495 | |||
Liberal Democrat | Ed Treadwell | 425 | |||
Labour | Paul Doran | 218 | |||
Rejected ballots | 18 | {{{change}}} | |||
Turnout | 2,181 | 56.3% | |||
Conservative hold | Swing | ||||
1 seat
Party | Candidate | Votes | % | ± | |
---|---|---|---|---|---|
Conservative | Ian Carr | 489 | 55.9 | -11.1 | |
Liberal Democrat | Michael McGarry | 223 | 25.5 | -7.5 | |
UKIP | Norman Woods | 158 | 18.0 | +18.0 | |
Majority | 266 | ||||
Rejected ballots | 6 | 0.6 | {{{change}}} | ||
Turnout | 876 | 54.2% | |||
Conservative hold | Swing | ||||
3 seats
Party | Candidate | Votes | % | ± | |
---|---|---|---|---|---|
Conservative | Philip Bundy | 1,643 | |||
Conservative | Nigel Anderdon | 1,639 | |||
Conservative | Alison Finlay | 1,509 | |||
Liberal Democrat | Jessica Cosier | 528 | |||
Liberal Democrat | Judith Houghton | 448 | |||
Labour | Joan Morrell | 444 | |||
Liberal Democrat | Paul Thompson | 429 | |||
Rejected ballots | 27 | {{{change}}} | |||
Turnout | 2,571 | 48.6% | |||
Conservative hold | Swing | ||||
1 seat
Party | Candidate | Votes | % | ± | |
---|---|---|---|---|---|
Conservative | Neville Whiteley | 604 | 66.2 | -4.1 | |
Liberal Democrat | Jane Waller | 294 | 32.2 | +3.4 | |
Majority | 310 | ||||
Rejected ballots | 14 | 1.6 | {{{change}}} | ||
Turnout | 912 | 53.2% | |||
Conservative hold | Swing | ||||
1 seat
Party | Candidate | Votes | % | ± | |
---|---|---|---|---|---|
Conservative | Jim Neal | 670 | 66.3 | N/A | |
Liberal Democrat | Richard Rowles | 328 | 32.5 | N/A | |
Majority | 324 | ||||
Rejected ballots | 11 | 1.1 | {{{change}}} | ||
Turnout | 1,010 | 55.1% | |||
Conservative hold | Swing | ||||
1 seat
Party | Candidate | Votes | % | ± | |
---|---|---|---|---|---|
Conservative | Tony Ward | 793 | 69.8 | ||
Liberal Democrat | Julian Gee | 320 | 28.2 | ||
Majority | 473 | ||||
Rejected ballots | 18 | 1.6 | {{{change}}} | ||
Turnout | 1,136 | 55.5% | |||
Conservative hold | Swing | ||||
3 seats
Party | Candidate | Votes | % | ± | |
---|---|---|---|---|---|
Liberal Democrat | Steve Cosier | 1,526 | |||
Liberal Democrat | Celia Dowden | 1,319 | |||
Liberal Democrat | Ann Tupper | 1,309 | |||
Conservative | Richard Eagan | 852 | |||
Conservative | Ron Brayshaw | 810 | |||
Conservative | Trevor Coles | 753 | |||
Labour | Chris Devrell | 412 | |||
Rejected ballots | 32 | {{{change}}} | |||
Turnout | 2,722 | 49.2% | |||
Liberal Democrat hold | Swing | ||||
1 seat
Party | Candidate | Votes | % | ± | |
---|---|---|---|---|---|
Conservative | Tony Hope | Uncontested | |||
Majority | N/A | ||||
Rejected ballots | N/A | {{{change}}} | |||
Turnout | N/A | ||||
Conservative hold | Swing | N/A | |||
2 seats
Party | Candidate | Votes | % | ± | |
---|---|---|---|---|---|
Conservative | Ellie Charnley | 1,272 | 70.2 | ||
Conservative | Phil Lashbrook | 1,265 | 69.8 | ||
Green | Lance Mitchell | 403 | 22.2 | ||
Green | Owain Clarke | 288 | 15.9 | ||
Rejected ballots | 26 | 1.4 | {{{change}}} | ||
Turnout | 1,812 | 49.3% | |||
Conservative hold | Swing | ||||
2 seats
Party | Candidate | Votes | % | ± | |
---|---|---|---|---|---|
Conservative | Ian Richards | 1,042 | |||
Conservative | Clive Collier | 950 | |||
Independent | Sally Lamb | 673 | |||
Liberal Democrat | Mike Wenman | 399 | |||
Labour | Christine Watkins | 360 | |||
Liberal Democrat | Sandra Cosier | 357 | |||
Rejected ballots | 17 | {{{change}}} | |||
Turnout | 2,089 | 54.4% | |||
Conservative gain from Liberal Democrat | Swing | ||||
Conservative hold | Swing | ||||
2 seats
Party | Candidate | Votes | % | ± | |
---|---|---|---|---|---|
Liberal Democrat | Dorothy Baverstock | 1,034 | |||
Liberal Democrat | Karen Dunleavey | 992 | |||
Conservative | John Ray | 891 | |||
Conservative | Craig Buckingham | 747 | |||
Labour | Joss MacDonald | 289 | |||
Rejected ballots | 26 | {{{change}}} | |||
Turnout | 2,144 | 53.3% | |||
Liberal Democrat hold | Swing | ||||
2 seats
Party | Candidate | Votes | % | ± | |
---|---|---|---|---|---|
Liberal Democrat | Mark Cooper | 1,277 | |||
Liberal Democrat | Peter Hurst | 1,014 | |||
Conservative | Nick Michell | 895 | |||
Conservative | Jill Gethin | 893 | |||
Labour | Carolyn Nixson | 262 | |||
Rejected ballots | 16 | {{{change}}} | |||
Turnout | 2,347 | 56.7% | |||
Liberal Democrat hold | Swing | ||||
2 seats
Party | Candidate | Votes | % | ± | |
---|---|---|---|---|---|
Conservative | Ian Hibberd | 767 | |||
Conservative | Alison Johnston | 757 | |||
Liberal Democrat | John Parker | 481 | |||
Liberal Democrat | Priya Banerjee | 352 | |||
Labour | Amanda Ford | 150 | |||
Rejected ballots | 20 | {{{change}}} | |||
Turnout | 1,365 | 53.9% | |||
Conservative hold | Swing | ||||
3 seats
Party | Candidate | Votes | % | ± | |
---|---|---|---|---|---|
Liberal Democrat | Alan Dowden | 1,590 | |||
Liberal Democrat | Andrew Beesley | 1,368 | |||
Liberal Democrat | Kath Tilling | 1,337 | |||
Conservative | John Barton | 1,010 | |||
Conservative | Jane Johnson | 916 | |||
Conservative | Roger Curtis | 912 | |||
Rejected ballots | 36 | {{{change}}} | |||
Turnout | 2,859 | 49.5% | |||
Liberal Democrat hold | Swing | ||||
Chilworth is a village in Hampshire, UK, very close to the city of Southampton. Good travel connections and restricted development have led to the village becoming particularly affluent. The village was referred to as Celeworda in the Domesday book, and is now in two parts: modern Chilworth lying along the straight 'new' stretch of the Southampton to Romsey road, and old Chilworth built around the 'old' road.
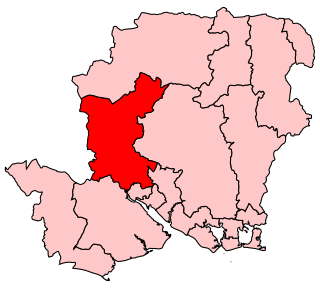
Romsey was a seat of the House of Commons of the UK Parliament 1983-2010 which accordingly elected one Member of Parliament (MP) by the first past the post system of election. It is virtually tantamount to its replacement Romsey and Southampton North which takes in two typical-size local government wards of the United Kingdom named after and approximate to the Bassett and Swaythling parts of Southampton.
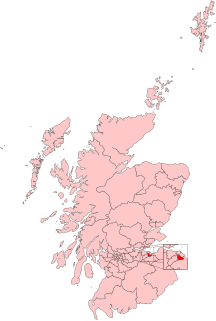
Edinburgh South is a constituency of the House of Commons of the UK Parliament created in 1885. The constituency has been represented by the Labour Party's Ian Murray since 2010. Murray was the only Labour MP in Scotland to retain his seat at the 2015 general election, and did so with an increased majority, where he result rendered it the 23rd-most marginal Labour seat by percentage of majority nationwide.
Winchester is a constituency represented in the House of Commons of the UK Parliament since 2010 by Steve Brine, a Conservative.
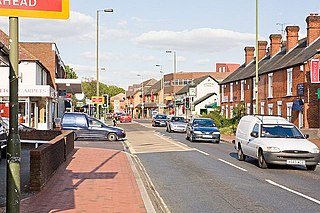
Chandler's Ford (originally The Ford and historically Chandlersford is a largely residential area and civil parish in the Borough of Eastleigh in Hampshire, England, with a population of 21,436 in the 2011 UK Census.
Guildford Council in Surrey, England is elected every four years.
Cornwall Council is the unitary authority for the county of Cornwall in the United Kingdom, not including the Isles of Scilly, which has its own council. The council, and its predecessor Cornwall County Council, has a tradition of large groups of independent councillors, having been controlled by independents in the 1970s and 1980s. Since the 2013 elections, it is run by an Independent-Liberal Democrat coalition.
Romsey and Southampton North is a constituency represented in the House of Commons of the UK Parliament since its 2010 creation by Caroline Nokes, a Conservative. For the purposes of election expenses and type of returning officer it is a county constituency.
Meon Valley is a constituency in Hampshire represented in the House of Commons of the UK Parliament since its 2010 creation by George Hollingbery, a Conservative.
The 2006 Barnet Council election took place on 4 May 2006 to elect members of Barnet London Borough Council in London, England. The whole council was up for election and the Conservative party stayed in overall control of the council.
Hertfordshire County Council in England is elected every four years. Since the last boundary changes, that took effect for the 2001 election, 77 councillors are elected for single member districts.
The 2007 council elections in Guildford saw the Conservatives retain control over Guildford Borough Council. Full results for each ward can be found at Guildford Council election, full results, 2007.
Elections for Redbridge London Borough Council were held on 6 May 2010. The 2010 General Election and other local elections took place on the same day.
The 2003 elections for Guildford Borough Council were the first, and as of 2011 the only, full election for Guildford Borough Council conducted by an all postal ballot. The result saw the Conservatives win a majority of seats on Guildford Borough Council for the first time since losing their majority in the 1991 election.
Elections for Cambridge City Council were held on Thursday 3 May 2012. One third of the council was up for election and the Liberal Democrats lost overall control of the council, to No Overall Control.
Romsey Extra is a civil parish in the Borough of Test Valley and the English county of Hampshire. At the 2011 census, it had a population of 3,276, although due to the ongoing 800 home Abbotswood development that begun after the census was taken, it is likely to have risen significantly by the next Census and by 50% between 2012 and 2018. This could be increased further by the possibility of a new 1300 home development at Whitenap.
The 2011 Huntingdonshire District Council election took place on 5 May 2011 to elect members of Huntingdonshire District Council in Cambridgeshire, England. One third of the council was up for election and the Conservative party stayed in overall control of the council.
The 2012 Huntingdonshire District Council election took place on 3 May 2012 to elect members of Huntingdonshire District Council in Cambridgeshire, England. One third of the council was up for election and the Conservative party stayed in overall control of the council.
The 2014 Huntingdonshire District Council election took place on 22 May 2014 to elect members of Huntingdonshire District Council in Cambridgeshire, England. One third of the council was up for election and the Conservative party stayed in overall control of the council.
The 2017 Highland Council election was held on 4 May 2017 to elect members of Highland Council. The election used the 21 wards created under the Local Governance (Scotland) Act 2004; each ward elected three or four councillors using the single transferable vote system. A total of 74 councillors were elected, six less than in 2012.