The 2007 Wealden District Council election took place on 3 May 2007 to elect members of Wealden District Council in East Sussex, England. The whole council was up for election and the Conservative party stayed in overall control of the council. [1]
Wealden is a local government district in East Sussex, England: its name comes from the Weald, the remnant forest which was once unbroken and occupies much of the centre and north of this area. The term is cognate with Wald, forest or wood in German.
Non-metropolitan districts, or colloquially "shire districts", are a type of local government district in England. As created, they are sub-divisions of non-metropolitan counties in a two-tier arrangement.
East Sussex is a county in South East England. It is bordered by the counties of Kent to the north and east, Surrey to the north west and West Sussex to the west, and to the south by the English Channel.
At the 2003 election the Conservatives held control of the council with 34 seats, compared to 15 for the Liberal Democrats and 6 independents. [2] However, in September 2006 Liberal Democrat councillor Stephen Shing was expelled from the Liberal Democrats and continued on the council as an independent. [3]
The Liberal Democrats are a liberal political party in the United Kingdom. It is currently led by Vince Cable. They have 11 Members of Parliament in the House of Commons, 96 members of the House of Lords, one member of the European Parliament, five Members of the Scottish Parliament and one member in the Welsh Assembly and London Assembly. At the height of its influence, the party formed a coalition government with the Conservative Party from 2010 to 2015 with its leader Nick Clegg serving as Deputy Prime Minister.
A Councillor is a member of a local government council.
The Conservatives took 4 seats without any opposition and were also guaranteed seats in other wards where there were not enough candidates from other parties for the number of seats being contested. [4] The returning officer for Wealden, Charlie Lant, formed a band called The Council Tax Band with other council officers and performed a song called Vote! in an effort to boost turnout at the election. [5] [6]
In various parliamentary systems, a returning officer is responsible for overseeing elections in one or more constituencies.
Voter turnout is the percentage of eligible voters who cast a ballot in an election. Eligibility varies by country, and the voting-eligible population should not be confused with the total adult population. Age and citizenship status are often among the criteria used to determine eligibility, but some countries further restrict eligibility based on sex, race, or religion.
An important issue at the election was a legal loophole, which was allowing developers to build increased numbers of houses in the area. [4]
A loophole is an ambiguity or inadequacy in a system, such as a law or security, which can be used to circumvent or otherwise avoid the purpose, implied or explicitly stated, of the system.
Real estate development, or property development, is a business process, encompassing activities that range from the renovation and re-lease of existing buildings to the purchase of raw land and the sale of developed land or parcels to others. Real estate developers are the people and companies who coordinate all of these activities, converting ideas from paper to real property. Real estate development is different from construction, although many developers also manage the construction process.
The Conservatives held control of the council staying on 34 seats, but both the Conservative leader of the council Nigel Coltman and the Liberal Democrat group leader Laura Murphy were defeated. [7] The Liberal Democrats lost 2 seats, dropping to 12 councillors, while independents remained on 7 seats and the Green party won its first councillors on the council after gaining 2 seats. [8] [9] [10] Overall turnout at the election was 38.51%, [11] up from 35% in 2003. [12]
The Green Party of England and Wales is a green, left-wing political party in England and Wales. Headquartered in London, since September 2018, its co-leaders are Siân Berry and Jonathan Bartley. The Green Party has one representative in the House of Commons, one in the House of Lords, and three in the European Parliament. In addition, it has various councillors in UK local government and two members of the London Assembly.
The Conservative leader Nigel Coltman was defeated by Liberal Democrat Brian Cook in Hailsham East by a 55-vote majority, with the Conservatives also losing 2 seats to the Greens in Forest Row. [7] However the Conservatives did not suffer a net loss of seats as they also made gains including defeating the Liberal Democrat group leader Laura Murphy in Hailsham Central and North. [7] The Liberal Democrats did gain a seat in Polegate South from an independent by 1 vote, but Stephen Shing was re-elected as an independent in Willingdon, while Shing's son Daniel also gained a seat in the same ward and Shing's wife Oi Lin gained one in Polegate North. [7]
Hailsham is a civil parish and the largest of the five towns in the Wealden district of East Sussex, England. It is mentioned in the Domesday Book, where it is called Hamelesham. The town of Hailsham has a history of industry and agriculture.
Forest Row is a village and relatively large civil parish in the Wealden District of East Sussex, England. The village is located three miles (5 km) south-east of East Grinstead.
Polegate is a town and civil parish in the Wealden District of East Sussex, England, United Kingdom. It is located five miles (8 km) north of the seaside resort of Eastbourne and is part of the greater area of that town. Although once a railway settlement, its importance as such has now waned by route closures. The civil parish of Polegate had a population of 8,586 on the 2011 census, 41.2% aged 65 and over.
Party | Seats | Gains | Losses | Net gain/loss | Seats % | Votes % | Votes | +/− | |
---|---|---|---|---|---|---|---|---|---|
Conservative | 34 | 3 | 3 | 0 | 61.8 | 54.6 | 36,928 | +5.2% | |
Liberal Democrat | 12 | 3 | 5 | -2 | 21.8 | 23.4 | 15,820 | -11.6% | |
Independent | 7 | 2 | 2 | 0 | 12.7 | 15.0 | 10,153 | +5.5% | |
Green | 2 | 2 | 0 | +2 | 3.6 | 6.0 | 4,082 | +4.1% | |
Labour | 0 | 0 | 0 | 0 | 0 | 0.6 | 424 | -3.3% | |
English Democrat | 0 | 0 | 0 | 0 | 0 | 0.3 | 190 | +0.3% | |
UKIP | 0 | 0 | 0 | 0 | 0 | 0.1 | 57 | -0.1% |
Party | Candidate | Votes | % | ± | |
---|---|---|---|---|---|
Conservative | Keith Whitehead | 707 | 71.8 | +4.5 | |
Liberal Democrat | Christine Page | 277 | 28.2 | -4.5 | |
Majority | 430 | 43.7 | +9.1 | ||
Turnout | 984 | 48.5 | -1.0 | ||
Conservative hold | Swing |
Party | Candidate | Votes | % | ± | |
---|---|---|---|---|---|
Conservative | Norman Buck | 1,203 | |||
Conservative | Ken Ogden | 1,115 | |||
Liberal Democrat | Michael Cooper | 394 | |||
Turnout | 2,712 | 39.0 | +2.8 | ||
Conservative hold | Swing | ||||
Conservative hold | Swing |
Party | Candidate | Votes | % | ± | |
---|---|---|---|---|---|
Conservative | Barby Dashwood-Hall | 628 | 66.2 | ||
Liberal Democrat | Barbara Holbrook | 321 | 33.8 | ||
Majority | 307 | 32.3 | |||
Turnout | 949 | 42.3 | |||
Conservative hold | Swing |
Party | Candidate | Votes | % | ± | |
---|---|---|---|---|---|
Conservative | Jonica Fox | unopposed | |||
Conservative hold | Swing |
Party | Candidate | Votes | % | ± | |
---|---|---|---|---|---|
Conservative | Sylvia Tidy | 581 | |||
Liberal Democrat | Jane Clark | 579 | |||
Conservative | Pat Kennedy | 565 | |||
Liberal Democrat | Ian Mein | 510 | |||
Green | Sarah Hale | 185 | |||
Green | Scott Mason | 133 | |||
Turnout | 2,553 | 33.5 | +6.0 | ||
Conservative gain from Liberal Democrat | Swing | ||||
Liberal Democrat hold | Swing |
Party | Candidate | Votes | % | ± | |
---|---|---|---|---|---|
Liberal Democrat | Martin Prestage | 222 | 45.0 | +6.2 | |
Conservative | John Stevens | 215 | 43.6 | +21.5 | |
Green | Colin Stocks | 56 | 11.4 | +11.4 | |
Majority | 7 | 1.4 | |||
Turnout | 493 | 25.3 | -3.5 | ||
Liberal Democrat gain from Independent | Swing | ||||
Party | Candidate | Votes | % | ± | |
---|---|---|---|---|---|
Independent | Chantal Wilson | 1,108 | |||
Conservative | David Larkin | 739 | |||
Liberal Democrat | Adrian Morris | 530 | |||
Turnout | 2,377 | 37.9 | +2.1 | ||
Independent hold | Swing | ||||
Conservative hold | Swing |
Party | Candidate | Votes | % | ± | |
---|---|---|---|---|---|
Conservative | Jim Hollins | 469 | 59.4 | -15.9 | |
English Democrat | Paul Adams | 190 | 24.1 | +24.1 | |
Labour | Jean McCarthy | 47 | 6.0 | -1.7 | |
Liberal Democrat | Valerie Banks | 43 | 5.4 | -11.5 | |
Green | Gabrielle Symonds | 40 | 5.1 | +5.1 | |
Majority | 279 | 35.4 | -23.0 | ||
Turnout | 789 | 40.4 | +8.4 | ||
Conservative hold | Swing |
Party | Candidate | Votes | % | ± | |
---|---|---|---|---|---|
Conservative | Diane Phillips | 992 | |||
Conservative | Antony Quin | 954 | |||
Liberal Democrat | Edward Willis | 336 | |||
Labour | Brendan Clegg | 192 | |||
Turnout | 2,474 | 34.9 | +2.7 | ||
Conservative hold | Swing | ||||
Conservative hold | Swing |
Party | Candidate | Votes | % | ± | |
---|---|---|---|---|---|
Conservative | Roy Galley | unopposed | |||
Conservative | Sylvia Martin | unopposed | |||
Conservative hold | Swing | ||||
Conservative hold | Swing |
Party | Candidate | Votes | % | ± | |
---|---|---|---|---|---|
Conservative | Charles Peck | 793 | 81.6 | +13.8 | |
Liberal Democrat | Howard Coote | 179 | 18.4 | -13.8 | |
Majority | 614 | 63.2 | +27.5 | ||
Turnout | 972 | 50.8 | +3.9 | ||
Conservative hold | Swing |
Party | Candidate | Votes | % | ± | |
---|---|---|---|---|---|
Green | David Jonas | 938 | |||
Green | Vania Phitidis | 877 | |||
Conservative | Rowena Moore | 839 | |||
Conservative | Peter Davey | 826 | |||
Turnout | 3,480 | 46.9 | +13.4 | ||
Green gain from Conservative | Swing | ||||
Party | Candidate | Votes | % | ± | |
---|---|---|---|---|---|
Conservative | Ann Newton | 704 | 72.6 | +7.7 | |
Liberal Democrat | Steve Hey | 209 | 21.5 | +2.1 | |
UKIP | Keith Riddle | 57 | 5.9 | -9.9 | |
Majority | 495 | 51.0 | +5.5 | ||
Turnout | 970 | 45.3 | +3.1 | ||
Conservative hold | Swing |
Party | Candidate | Votes | % | ± | |
---|---|---|---|---|---|
Conservative | Johanna Howell | 1,072 | |||
Conservative | John Padfield | 955 | |||
Green | Keith Obbard | 566 | |||
Turnout | 2,593 | 39.5 | +0.9 | ||
Conservative hold | Swing | ||||
Conservative hold | Swing |
Party | Candidate | Votes | % | ± | |
---|---|---|---|---|---|
Liberal Democrat | Paul Holbrook | 687 | |||
Conservative | Jo Bentley | 644 | |||
Liberal Democrat | Laura Murphy | 641 | |||
Conservative | Angela Geall | 577 | |||
Independent | John Glover | 291 | |||
Independent | Robin Kempe | 242 | |||
Turnout | 3,082 | 36.1 | +4.0 | ||
Liberal Democrat hold | Swing | ||||
Conservative gain from Liberal Democrat | Swing | ||||
Party | Candidate | Votes | % | ± | |
---|---|---|---|---|---|
Liberal Democrat | Brian Cock | 323 | 54.7 | +29.4 | |
Conservative | Nigel Coltman | 268 | 45.3 | +11.6 | |
Majority | 55 | 9.3 | |||
Turnout | 591 | 30.2 | +3.6 | ||
Liberal Democrat gain from Conservative | Swing | ||||
Party | Candidate | Votes | % | ± | |
---|---|---|---|---|---|
Independent | Nick Ellwood | 742 | |||
Independent | Ian Haffenden | 690 | |||
Independent | Geoff Rowe | 675 | |||
Conservative | Lynn Bowman | 628 | |||
Liberal Democrat | Anne Blake-Coggins | 606 | |||
Liberal Democrat | Ann Murrey | 599 | |||
Conservative | Arthur Kay | 508 | |||
Conservative | Ginny Heard | 497 | |||
Turnout | 4,945 | 29.1 | +0.4 | ||
Independent hold | Swing | ||||
Independent hold | Swing |
Party | Candidate | Votes | % | ± | |
---|---|---|---|---|---|
Conservative | Michael Hoy | 661 | 60.6 | ||
Liberal Democrat | Mike Burbridge | 294 | 27.0 | ||
Green | Heidi Ruse | 135 | 12.4 | ||
Majority | 367 | 33.7 | |||
Turnout | 1,090 | 52.5 | |||
Conservative hold | Swing |
Party | Candidate | Votes | % | ± | |
---|---|---|---|---|---|
Conservative | Jan Dunk | unopposed | |||
Conservative hold | Swing |
Party | Candidate | Votes | % | ± | |
---|---|---|---|---|---|
Conservative | Dick Angel | 1,423 | |||
Conservative | Margaret Kirkpatrick | 1,337 | |||
Conservative | Niki Oakes | 1,303 | |||
Liberal Democrat | Jim Benson | 561 | |||
Turnout | 4,624 | 33.2 | +5.0 | ||
Conservative hold | Swing | ||||
Conservative hold | Swing |
Party | Candidate | Votes | % | ± | |
---|---|---|---|---|---|
Liberal Democrat | John Blake | 943 | |||
Liberal Democrat | David White | 929 | |||
Conservative | Keith Byatt | 727 | |||
Conservative | James Kennedy | 653 | |||
Turnout | 3,252 | 39.7 | +2.8 | ||
Liberal Democrat hold | Swing | ||||
Liberal Democrat hold | Swing |
Party | Candidate | Votes | % | ± | |
---|---|---|---|---|---|
Conservative | Andy Long | 559 | 69.0 | +5.9 | |
Independent | Laurence Keeley | 251 | 31.0 | +31.0 | |
Majority | 308 | 38.0 | +11.8 | ||
Turnout | 810 | 37.6 | +1.1 | ||
Conservative hold | Swing |
Party | Candidate | Votes | % | ± | |
---|---|---|---|---|---|
Conservative | Susan Stedman | 570 | 75.1 | +18.2 | |
Liberal Democrat | Lois Norton | 189 | 24.9 | -18.2 | |
Majority | 381 | 50.2 | +36.5 | ||
Turnout | 759 | 36.6 | +3.4 | ||
Conservative hold | Swing |
Party | Candidate | Votes | % | ± | |
---|---|---|---|---|---|
Conservative | Brian Redman | 647 | 72.3 | +18.0 | |
Liberal Democrat | Sharon Cottingham | 124 | 13.9 | -31.8 | |
Green | Derek Forman | 124 | 13.9 | +13.9 | |
Majority | 523 | 58.4 | +49.9 | ||
Turnout | 895 | 43.7 | +2.0 | ||
Conservative hold | Swing |
Party | Candidate | Votes | % | ± | |
---|---|---|---|---|---|
Conservative | Pam Doodes | 633 | 83.1 | ||
Liberal Democrat | Edward Thompson | 129 | 16.9 | ||
Majority | 504 | 66.1 | |||
Turnout | 762 | 39.2 | |||
Conservative hold | Swing |
Party | Candidate | Votes | % | ± | |
---|---|---|---|---|---|
Conservative | Kevin Balsdon | 1,439 | |||
Conservative | Dianne Dear | 1,417 | |||
Conservative | Lin McKeever | 1,312 | |||
Liberal Democrat | Christine Thomas | 893 | |||
Turnout | 5,061 | 31.7 | +2.0 | ||
Conservative hold | Swing | ||||
Conservative hold | Swing |
Party | Candidate | Votes | % | ± | |
---|---|---|---|---|---|
Independent | Oi Shing | 764 | |||
Liberal Democrat | Roy Martin | 683 | |||
Liberal Democrat | Chris Berry | 554 | |||
Independent | John Harmer | 394 | |||
Independent | Gerald Carter | 333 | |||
Conservative | Derrick Wilkins | 271 | |||
Green | Peter Wright | 108 | |||
Turnout | 3,107 | 42.8 | +5.1 | ||
Independent gain from Liberal Democrat | Swing | ||||
Liberal Democrat hold | Swing |
Party | Candidate | Votes | % | ± | |
---|---|---|---|---|---|
Liberal Democrat | Don Broadbent | 302 | 36.9 | +5.3 | |
Independent | Ivy Scarborough | 301 | 36.8 | -8.9 | |
Conservative | Anne McIlvenny | 216 | 26.4 | +3.7 | |
Majority | 1 | 0.1 | |||
Turnout | 819 | 41.7 | +3.0 | ||
Liberal Democrat gain from Independent | Swing | ||||
Party | Candidate | Votes | % | ± | |
---|---|---|---|---|---|
Conservative | Huw Merriman | 620 | 77.7 | +30.3 | |
Liberal Democrat | Graham Morgan | 178 | 22.3 | -23.4 | |
Majority | 442 | 55.4 | +53.6 | ||
Turnout | 798 | 42.7 | +1.0 | ||
Conservative hold | Swing |
Party | Candidate | Votes | % | ± | |
---|---|---|---|---|---|
Conservative | Claire Dowling | 542 | 58.0 | +5.3 | |
Liberal Democrat | Dorothy Sparks | 392 | 42.0 | +3.8 | |
Majority | 150 | 16.1 | +1.6 | ||
Turnout | 934 | 40.3 | +5.2 | ||
Conservative hold | Swing |
Party | Candidate | Votes | % | ± | |
---|---|---|---|---|---|
Liberal Democrat | Julia Hey | 410 | 63.4 | +9.2 | |
Conservative | Terence Clark | 237 | 36.6 | +13.8 | |
Majority | 173 | 26.7 | -4.5 | ||
Turnout | 647 | 31.4 | +0.4 | ||
Liberal Democrat hold | Swing |
Party | Candidate | Votes | % | ± | |
---|---|---|---|---|---|
Liberal Democrat | Paul Sparks | 693 | |||
Liberal Democrat | Alan Whittaker | 532 | |||
Conservative | Michael Lunn | 453 | |||
Conservative | Anne Sabine | 373 | |||
Green | Sam Bryant | 250 | |||
Turnout | 2,301 | 30.0 | +2.2 | ||
Liberal Democrat hold | Swing | ||||
Liberal Democrat hold | Swing |
Party | Candidate | Votes | % | ± | |
---|---|---|---|---|---|
Liberal Democrat | Robert Sweetland | 469 | 51.6 | -5.6 | |
Conservative | Kim Clark | 440 | 48.4 | +11.7 | |
Majority | 29 | 3.2 | -17.3 | ||
Turnout | 909 | 40.9 | +1.8 | ||
Liberal Democrat hold | Swing |
Party | Candidate | Votes | % | ± | |
---|---|---|---|---|---|
Conservative | Bob Standley | 1,069 | |||
Conservative | Graham Wells | 1,052 | |||
Green | Beth Martin | 390 | |||
Labour | Bruce Meredeen | 185 | |||
Turnout | 2,696 | 38.4 | +6.4 | ||
Conservative hold | Swing | ||||
Conservative hold | Swing |
Party | Candidate | Votes | % | ± | |
---|---|---|---|---|---|
Independent | Stephen Shing | 2,275 | |||
Independent | Daniel Shing | 2,087 | |||
Conservative | Ron Cussons | 890 | |||
Conservative | Dick Broady | 812 | |||
Conservative | Douglas Murray | 793 | |||
Liberal Democrat | Andy Watkins | 614 | |||
Liberal Democrat | Kay Dewick | 475 | |||
Green | Izzy Riach | 280 | |||
Turnout | 8,226 | 57.1 | +8.4 | ||
Independent hold | Swing | ||||
Independent gain from Liberal Democrat | Swing | ||||
Conservative gain from Liberal Democrat | Swing | ||||
A by-election was held in Uckfield New Town on 17 July 2008 after Liberal Democrat councillor Julia Hey resigned from the council. [15]
Party | Candidate | Votes | % | ± | |
---|---|---|---|---|---|
Liberal Democrat | Carol Sweetland | 311 | 47.4 | -16.0 | |
Conservative | John Carvey | 289 | 44.1 | +7.5 | |
UKIP | Michael Pursglove | 56 | 8.5 | +8.5 | |
Majority | 22 | 3.3 | -23.4 | ||
Turnout | 656 | 31.8 | +0.4 | ||
Liberal Democrat hold | Swing |
A by-election was held in Alfriston on 25 September 2008 after Conservative Keith Whitehead stood down from the council. [17] The seat was gained from the Conservatives by Liberal Democrat Andy Watkins with a 30-vote majority, defeating the former Conservative leader of Wealden council, Nigel Coltman who had been trying to return to the council. [17]
Party | Candidate | Votes | % | ± | |
---|---|---|---|---|---|
Liberal Democrat | Andrew Watkins | 495 | 51.6 | +23.4 | |
Conservative | Nigel Coltman | 465 | 48.4 | -23.4 | |
Majority | 30 | 3.2 | |||
Turnout | 960 | 48.0 | -0.5 | ||
Liberal Democrat gain from Conservative | Swing | ||||
A by-election was held in Heathfield North and Central on 23 September 2010 after the death of Conservative councillor Niki Oakes in June 2010. [18]
Party | Candidate | Votes | % | ± | |
---|---|---|---|---|---|
Conservative | Peter Newnham | 802 | 69.2 | -2.5 | |
Liberal Democrat | Jim Benson | 357 | 30.8 | +2.5 | |
Majority | 445 | 38.4 | |||
Turnout | 1,159 | 19.4 | -13.8 | ||
Conservative hold | Swing |
Long Man is a civil parish in the Wealden District of East Sussex, England which includes the villages of Wilmington, Milton Street and Folkington. The parish is named after the Long Man of Wilmington, a 69.2-metre (227 ft) chalk figure in the parish.
Eastbourne is a constituency for the House of Commons of the UK Parliament. It was created as one of nine in Sussex in 1885, since when the seat has reduced in geographic size reflecting the growth of its main settlement, Eastbourne.
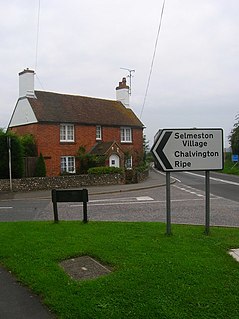
Selmeston is a village and civil parish in the Wealden District of East Sussex, England. It is located eight miles (13 km) east of Lewes, to the north of the A27 road between there and Polegate.
The 2008 Harlow District Council election took place on 1 May 2008 to elect members of Harlow District Council in Essex, England. One third of the council was up for election and the Conservative party gained overall control of the council from no overall control.
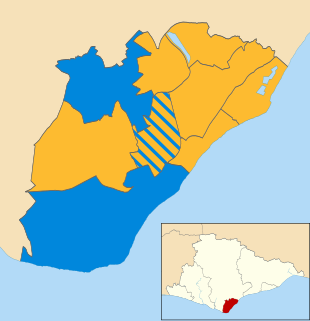
The 2007 Eastbourne Borough Council election took place on 3 May 2007 to elect members of Eastbourne Borough Council in East Sussex, England. The whole council was up for election and the Liberal Democrats gained overall control of the council from the Conservative party.
The 2011 Eastbourne Borough Council election took place on 5 May 2011 to elect members of Eastbourne Borough Council in East Sussex, England. The whole council was up for election and the Liberal Democrats stayed in overall control of the council.
The 1999 Wealden District Council election took place on 6 May 1999 to elect members of Wealden District Council in East Sussex, England. The whole council was up for election and the Conservative party stayed in overall control of the council.
The 2003 Wealden District Council election took place on 1 May 2003 to elect members of Wealden District Council in East Sussex, England. The whole council was up for election with boundary changes since the last election in 1999 reducing the number of seats by 3. The Conservative party stayed in overall control of the council.
The 2011 Wealden District Council election took place on 5 May 2011 to elect members of Wealden District Council in East Sussex, England. The whole council was up for election and the Conservative party stayed in overall control of the council.
The 2011 Tandridge District Council election took place on 5 May 2011 to elect members of Tandridge District Council in Surrey, England. One third of the council was up for election and the Conservative party stayed in overall control of the council.
The 2000 Crawley Borough Council election took place on 4 May 2000 to elect members of Crawley Borough Council in West Sussex, England. One third of the council was up for election and the Labour party stayed in overall control of the council.
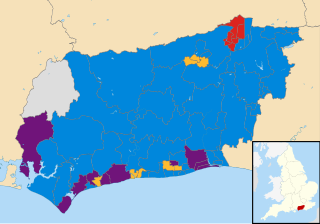
The 2002 Crawley Borough Council election took place on 2 May 2002 to elect members of Crawley Borough Council in West Sussex, England. One third of the council was up for election and the Labour party stayed in overall control of the council.
The West Sussex County Council election, 2013 took place on 2 May 2013, as part of the United Kingdom local elections, 2013. All 71 electoral divisions were up for election, which returned one county councillor each by first-past-the-post voting for a four-year term of office. At this election, the Conservative Party was seeking to retain overall control of the council, and the Liberal Democrats to maintain their position as the main opposition party.
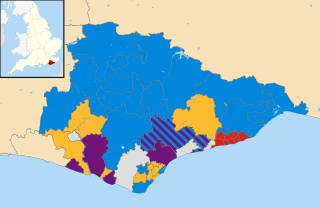
The East Sussex County Council election, 2013 took place on 2 May 2013 as part of the United Kingdom local elections, 2013. All 49 councillors of East Sussex County Council were elected from 44 electoral divisions, which return either one or two councillors each by first-past-the-post voting for a four-year term of office. The electoral divisions were the same as those used at the previous election in 2009. No elections were held in Brighton and Hove, which is a unitary authority outside the area covered by the County Council.
The 2007 Rother District Council election took place on 3 May 2007 to elect members of Rother District Council in East Sussex, England. The whole council was up for election and the Conservative party stayed in overall control of the council.
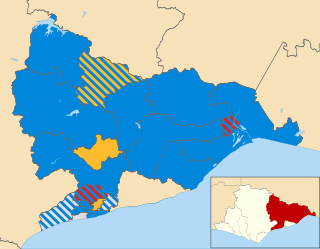
The 2011 Rother District Council election took place on 5 May 2011 to elect members of Rother District Council in East Sussex, England. The whole council was up for election and the Conservative party stayed in overall control of the council.
The 2014 Craven District Council election took place on 22 May 2014 to elect members of Craven District Council in North Yorkshire, England. One third of the council was up for election and the Conservative party stayed in overall control of the council.