Elections to Wigan Council were held on 3 May 2007 with one third of the seats up for election. [1] [2] [3] [4]
The Metropolitan Borough of Wigan is a metropolitan borough of Greater Manchester, in North West England. It is named after its largest component town and former county borough, Wigan and includes the towns and villages of Leigh, part of Ashton-in-Makerfield, Ince-in-Makerfield, Hindley, Orrell, Standish, Atherton, Tyldesley, Golborne, Lowton, Billinge, Astley, Haigh and Aspull. The borough was formed in 1974 and is an amalgamation of several former local government districts and parishes. The borough has three civil parishes and lies directly to the west of the City of Salford and southwest of the Metropolitan Borough of Bolton. The local authority is Wigan Metropolitan Borough Council.
Party | Seats | Gains | Losses | Net gain/loss | Seats % | Votes % | Votes | +/− | |
---|---|---|---|---|---|---|---|---|---|
Labour | 16 | 4 | 1 | +3 | 64.0 | 43.2 | 30,854 | +0.4% | |
Conservative | 4 | 1 | 0 | +1 | 16.0 | 21.0 | 15,023 | -0.7% | |
Community Action | 3 | 1 | 2 | -1 | 12.0 | 15.8 | 11,265 | -1.0% | |
Liberal Democrat | 1 | 0 | 2 | -2 | 4.0 | 10.1 | 7,211 | -1.7% | |
Independent | 1 | 0 | 0 | 0 | 4.0 | 3.2 | 2,267 | +2.0% | |
BNP | 0 | 0 | 0 | 0 | 0 | 3.6 | 2,572 | +0.8% | |
Community Performance First | 0 | 0 | 1 | -1 | 0 | 1.2 | 837 | +1.2% | |
Green | 0 | 0 | 0 | 0 | 0 | 1.2 | 835 | +0.3% | |
UKIP | 0 | 0 | 0 | 0 | 0 | 0.5 | 337 | -1.1% | |
This result had the following consequences for the total number of seats on the Council after the elections: [5]
Party | Previous council | New council | |||
---|---|---|---|---|---|
Labour | 43 | 46 | |||
Community Action | 12 | 11 | |||
Conservative | 9 | 10 | |||
Liberal Democrat | 8 | 6 | |||
Independent | 2 | 2 | |||
BNP | 0 | 0 | |||
Green | 0 | 0 | |||
Community Performance First | 1 | 0 | |||
UKIP | 0 | 0 | |||
Total | 75 | 75 | |||
Working majority | 11 | 17 |
Party | Candidate | Votes | % | ± | |
---|---|---|---|---|---|
Labour | Eunice Smethurst | 1,403 | 55.0 | +2.9 | |
Community Action | John Shale | 587 | 22.2 | +1.0 | |
BNP | Dennis Shambley | 309 | 12.1 | -4.4 | |
Conservative | Marion Green | 264 | 10.4 | +0.8 | |
Rejected ballots | 6 | 0.2 | -0.3 | ||
Majority | 836 | 32.8 | +1.9 | ||
Turnout | 2,549 | 24.8 | -0.2 | ||
Labour hold | Swing | +0.9 | |||
Party | Candidate | Votes | % | ± | |
---|---|---|---|---|---|
Community Action | Walter Carney | 1,423 | 45.4 | +2.2 | |
Labour | Ann Rampling | 1,258 | 40.1 | -5.2 | |
Conservative | Marie Winstanley | 256 | 8.2 | -3.3 | |
BNP | Violet Haslam | 195 | 6.2 | +6.2 | |
Rejected ballots | 5 | 0.2 | +0.2 | ||
Majority | 165 | 5.3 | +3.1 | ||
Turnout | 3,137 | 34.4 | +4.1 | ||
Community Action hold | Swing | +3.7 | |||
Party | Candidate | Votes | % | ± | |
---|---|---|---|---|---|
Labour | Chris Ready | 1,888 | 53.1 | +12.8 | |
Liberal Democrat | Alan Robinson | 1,017 | 28.6 | -15.2 | |
Conservative | Jim Waterworth | 463 | 13.0 | -2.8 | |
Green | Norma Stout | 174 | 4.9 | +4.9 | |
Rejected ballots | 13 | 0.4 | +0.4 | ||
Majority | 871 | 24.5 | +21.0 | ||
Turnout | 3,555 | 35.6 | +3.7 | ||
Labour hold | Swing | +14.0 | |||
Party | Candidate | Votes | % | ± | |
---|---|---|---|---|---|
Labour | Brendan Bowen | 1,048 | 37.9 | +9.2 | |
Conservative | Sean Ell | 821 | 29.7 | +7.3 | |
Liberal Democrat | Peter Bowdler | 665 | 24.0 | -24.8 | |
Green | Ian Davies | 218 | 7.9 | +7.9 | |
Rejected ballots | 14 | 0.5 | +0.5 | ||
Majority | 227 | 8.2 | -12.0 | ||
Turnout | 2,766 | 28.6 | -2.5 | ||
Labour gain from Liberal Democrat | Swing | +0.9 | |||
Party | Candidate | Votes | % | ± | |
---|---|---|---|---|---|
Labour | Mark Aldred | 1,104 | 52.1 | +6.1 | |
Liberal Democrat | Kevin Jones | 640 | 30.2 | -4.1 | |
Conservative | Dorothy Angell | 366 | 17.3 | -2.4 | |
Rejected ballots | 10 | 0.5 | +0.5 | ||
Majority | 464 | 21.9 | +10.2 | ||
Turnout | 2,120 | 26.8 | +0.9 | ||
Labour hold | Swing | +5.1 | |||
Party | Candidate | Votes | % | ± | |
---|---|---|---|---|---|
Labour | Norman Bradbury | 1,456 | 45.3 | -4.4 | |
Liberal Democrat | David Higginbottom | 1,211 | 37.7 | +6.0 | |
Conservative | Lee Kendrick-Walker | 352 | 11.0 | +0.0 | |
Green | Nicolas Redmond | 183 | 5.7 | -2.0 | |
Rejected ballots | 10 | 0.3 | +0.3 | ||
Majority | 245 | 7.6 | -10.4 | ||
Turnout | 3,212 | 29.5 | +1.9 | ||
Labour gain from Liberal Democrat | Swing | -5.2 | |||
Party | Candidate | Votes | % | ± | |
---|---|---|---|---|---|
Independent | Gary Wilkes | 1,657 | 52.3 | +52.3 | |
Labour | George Harrison | 1,030 | 32.3 | -0.9 | |
BNP | Kenneth Haslam | 307 | 9.6 | -4.8 | |
Conservative | Jonathan Cartwright | 179 | 5.6 | +0.2 | |
Rejected ballots | 7 | 0.2 | +0.0 | ||
Majority | 637 | 20.0 | +8.0 | ||
Turnout | 3,190 | 34.3 | +0.6 | ||
Independent hold | Swing | +26.6 | |||
Party | Candidate | Votes | % | ± | |
---|---|---|---|---|---|
Labour | Mike Dewhurst | 1,338 | 58.0 | -1.1 | |
Community Action | James Carmichael-Prince | 586 | 25.4 | -14.9 | |
Conservative | Jean Peet | 374 | 16.2 | +16.2 | |
Rejected ballots | 10 | 0.4 | -0.2 | ||
Majority | 752 | 32.6 | +13.8 | ||
Turnout | 2,308 | 24.4 | -0.4 | ||
Labour hold | Swing | +6.9 | |||
Party | Candidate | Votes | % | ± | |
---|---|---|---|---|---|
Labour | Mark Klieve | 1,520 | 56.4 | +4.4 | |
Community Action | Kevin Williams | 777 | 28.8 | -6.3 | |
Conservative | James Grundy | 388 | 14.4 | +1.6 | |
Rejected ballots | 11 | 0.4 | +0.4 | ||
Majority | 743 | 27.6 | +10.7 | ||
Turnout | 2,696 | 30.3 | -0.4 | ||
Labour gain from Community Action | Swing | +5.3 | |||
Party | Candidate | Votes | % | ± | |
---|---|---|---|---|---|
Labour | James Ecclles-Churton | 1,191 | 45.3 | -3.1 | |
Community Action | Jim Ellis | 1,142 | 43.4 | +7.1 | |
Conservative | William Winstanley | 289 | 11.0 | -4.4 | |
Rejected ballots | 9 | 0.3 | +0.3 | ||
Majority | 49 | 1.9 | -10.2 | ||
Turnout | 2,631 | 26.6 | +1.1 | ||
Labour gain from Community Action | Swing | -5.1 | |||
Party | Candidate | Votes | % | ± | |
---|---|---|---|---|---|
Community Action | Louise Fagan | 741 | 31.4 | -16.0 | |
Labour | Martin Long | 710 | 30.1 | -5.8 | |
Community Performance First | Robert Brierley | 654 | 27.7 | +27.7 | |
Conservative | Margaret Winstanley | 245 | 10.4 | -6.3 | |
Rejected ballots | 8 | 0.3 | +0.3 | ||
Majority | 31 | 1.3 | -10.3 | ||
Turnout | 2,358 | 26.4 | +0.6 | ||
Community Action gain from Community Performance First | Swing | -5.1 | |||
Party | Candidate | Votes | % | ± | |
---|---|---|---|---|---|
Labour | Joan Hurst | 1,348 | 66.5 | +5.7 | |
Community Action | Yvonne Maddison | 458 | 22.6 | -7.8 | |
Conservative | Anthony Hinds | 210 | 10.4 | +2.1 | |
Rejected ballots | 12 | 0.6 | -0.1 | ||
Majority | 890 | 43.9 | +13.5 | ||
Turnout | 2,028 | 23.6 | -1.0 | ||
Labour hold | Swing | +6.7 | |||
Party | Candidate | Votes | % | ± | |
---|---|---|---|---|---|
Labour | Christine Cottam | 1,204 | 48.1 | +2.1 | |
Liberal Democrat | Gordon Jackson | 778 | 31.1 | -6.4 | |
Conservative | Andrew Oxley | 501 | 20.0 | +3.6 | |
Rejected ballots | 18 | 0.7 | +0.7 | ||
Majority | 426 | 17.0 | +8.5 | ||
Turnout | 2,501 | 27.0 | +0.2 | ||
Labour hold | Swing | +4.2 | |||
Party | Candidate | Votes | % | ± | |
---|---|---|---|---|---|
Labour | John O'Brien | 1,408 | 43.3 | +3.5 | |
Community Action | Ian Franzen | 774 | 23.8 | +4.4 | |
Conservative | Rosina Oxley | 762 | 23.4 | -0.4 | |
BNP | Richard Close | 293 | 9.0 | -5.0 | |
Rejected ballots | 15 | 0.5 | +0.5 | ||
Majority | 634 | 19.5 | +3.5 | ||
Turnout | 3,252 | 31.1 | +0.5 | ||
Labour hold | Swing | -0.4 | |||
Party | Candidate | Votes | % | ± | |
---|---|---|---|---|---|
Labour | Myra Whiteside | 1,380 | 53.9 | -1.0 | |
Independent | Mandy Cooper | 600 | 23.5 | +23.5 | |
Conservative | Denise Young | 289 | 11.3 | -5.0 | |
Community Action | Stephen Ellison | 280 | 10.9 | +10.9 | |
Rejected ballots | 9 | 0.4 | +0.4 | ||
Majority | 780 | 30.5 | +4.3 | ||
Turnout | 2,558 | 23.8 | +0.4 | ||
Labour hold | Swing | -12.2 | |||
Party | Candidate | Votes | % | ± | |
---|---|---|---|---|---|
Community Action | Jonathan Miller | 1,418 | 43.0 | +8.9 | |
Labour | Susan Greensmith | 1,085 | 32.9 | +0.1 | |
Conservative | Jeanette Leigh | 782 | 23.7 | -9.3 | |
Rejected ballots | 13 | 0.4 | +0.4 | ||
Majority | 636 | 10.1 | +9.0 | ||
Turnout | 3,298 | 33.6 | +1.4 | ||
Community Action hold | Swing | +4.4 | |||
Party | Candidate | Votes | % | ± | |
---|---|---|---|---|---|
Conservative | Michael Winstanley | 1,686 | 45.2 | +6.8 | |
Labour | Michael Barnes | 1,328 | 35.6 | -1.6 | |
BNP | Charles Mather | 534 | 14.3 | -3.9 | |
Community Action | Peter Solinas | 165 | 4.4 | +4.4 | |
Rejected ballots | 13 | 0.3 | +0.3 | ||
Majority | 358 | 9.6 | +8.4 | ||
Turnout | 3,726 | 40.3 | +3.2 | ||
Conservative hold | Swing | +4.2 | |||
Party | Candidate | Votes | % | ± | |
---|---|---|---|---|---|
Labour | Barbara Bourne | 1,421 | 57.6 | -7.1 | |
Community Action | Michael Leyland | 409 | 16.6 | +2.3 | |
BNP | Chris Hilton | 333 | 13.5 | +13.5 | |
Conservative | Stuart Foy | 295 | 12.0 | +12.0 | |
Rejected ballots | 8 | 0.3 | +0.3 | ||
Majority | 1,012 | 41.0 | -9.5 | ||
Turnout | 2,466 | 24.9 | +2.2 | ||
Labour hold | Swing | -4.7 | |||
Party | Candidate | Votes | % | ± | |
---|---|---|---|---|---|
Conservative | Debbie Fairhurst | 1,377 | 41.9 | -15.5 | |
Labour | Dave Brown | 1,248 | 38.0 | -3.2 | |
UKIP | John Atherton | 337 | 10.3 | +10.3 | |
Liberal Democrat | Darren Atherton | 311 | 9.5 | +9.5 | |
Rejected ballots | 11 | 0.3 | -1.1 | ||
Majority | 129 | 3.9 | -12.3 | ||
Turnout | 3,284 | 34.9 | +1.1 | ||
Conservative gain from Labour | Swing | -6.1 | |||
Party | Candidate | Votes | % | ± | |
---|---|---|---|---|---|
Conservative | George Fairhurst | 2,016 | 57.9 | +3.1 | |
Labour | Mike Crosby | 996 | 28.6 | -1.6 | |
Liberal Democrat | June Garner | 451 | 12.9 | +12.9 | |
Rejected ballots | 20 | 0.6 | +0.1 | ||
Majority | 1,020 | 29.3 | +4.7 | ||
Turnout | 3,483 | 36.4 | +0.4 | ||
Conservative hold | Swing | +2.3 | |||
Party | Candidate | Votes | % | ± | |
---|---|---|---|---|---|
Liberal Democrat | Keith McManus | 1,838 | 63.0 | +4.3 | |
Labour | Pamela Stewart | 447 | 15.3 | -4.0 | |
Conservative | Hilary Hayden | 370 | 12.7 | +3.6 | |
Green | Craig Cohen | 260 | 8.9 | -4.0 | |
Rejected ballots | 3 | 0.1 | +0.1 | ||
Majority | 1,391 | 47.7 | +8.3 | ||
Turnout | 2,918 | 28.6 | -0.3 | ||
Liberal Democrat hold | Swing | +4.2 | |||
Party | Candidate | Votes | % | ± | |
---|---|---|---|---|---|
Conservative | Jim Davies | 1,406 | 44.2 | -15.8 | |
Labour | John Ball | 1,050 | 33.0 | -7.0 | |
Liberal Democrat | Martin Sutton | 300 | 9.4 | +9.4 | |
Community Action | Ronnie Barnes | 218 | 6.9 | +6.9 | |
BNP | Gary Chadwick | 199 | 6.3 | +6.3 | |
Rejected ballots | 9 | 0.3 | +0.3 | ||
Majority | 356 | 11.2 | -8.8 | ||
Turnout | 3,182 | 34.6 | +0.1 | ||
Conservative hold | Swing | -4.4 | |||
Party | Candidate | Votes | % | ± | |
---|---|---|---|---|---|
Labour | Mike Baines | 1,388 | 47.5 | -1.5 | |
Conservative | Keith Jones | 563 | 19.3 | -2.9 | |
Community Action | Philip Parkes | 560 | 19.2 | +19.2 | |
BNP | Susan Mather | 402 | 13.7 | +13.7 | |
Rejected ballots | 11 | 0.4 | -0.2 | ||
Majority | 825 | 28.2 | +7.6 | ||
Turnout | 2,924 | 28.6 | +1.7 | ||
Labour hold | Swing | +0.7 | |||
Party | Candidate | Votes | % | ± | |
---|---|---|---|---|---|
Labour | Rona Winkworth | 1,224 | 43.3 | +9.4 | |
Community Action | Leanne Brotherton | 1,109 | 39.2 | -4.2 | |
Conservative | David Bowker | 482 | 17.1 | +2.7 | |
Rejected ballots | 11 | 0.4 | +0.1 | ||
Majority | 115 | 4.1 | -5.5 | ||
Turnout | 2,826 | 32.0 | +1.9 | ||
Labour hold | Swing | +6.8 | |||
Party | Candidate | Votes | % | ± | |
---|---|---|---|---|---|
Labour | William Rotherham | 1,381 | 55.3 | -0.1 | |
Community Action | William Barnes | 638 | 25.5 | -5.5 | |
Conservative | Thomas Sutton | 287 | 11.5 | -1.4 | |
Community Performance First | Anthony Unsworth | 183 | 7.3 | +7.3 | |
Rejected ballots | 9 | 0.4 | -0.3 | ||
Majority | 743 | 29.7 | +5.4 | ||
Turnout | 2,498 | 27.6 | +1.6 | ||
Labour hold | Swing | +2.7 | |||
Party | Candidate | Votes | % | ± | |
---|---|---|---|---|---|
Liberal Democrat | Robert Bleakley | 784 | 40.2 | -22.8 | |
Labour | Barry Taylor | 619 | 31.7 | +16.4 | |
Independent | Craig Cohen | 377 | 19.3 | +19.3 | |
Conservative | Sean Ell | 170 | 8.7 | -4.0 | |
Majority | 165 | 8.5 | -39.2 | ||
Turnout | 1,950 | 19.2 | -9.4 | ||
Liberal Democrat hold | Swing | -19.6 | |||
Party | Candidate | Votes | % | ± | |
---|---|---|---|---|---|
Labour | Phyll Cullen | 837 | 43.7 | -3.8 | |
Liberal Democrat | Trevor Beswick | 464 | 24.2 | +24.2 | |
BNP | Susan Mather | 264 | 13.8 | +0.1 | |
Community Action | Jim Carmichael-Prince | 219 | 11.4 | -7.8 | |
Independent | Syd Hall | 72 | 3.8 | +3.8 | |
Green | Norma Stout | 60 | 3.1 | +3.1 | |
Majority | 373 | 19.5 | -8.7 | ||
Turnout | 1,916 | 18.7 | -9.9 | ||
Labour hold | Swing | -14.0 | |||
Party | Candidate | Votes | % | ± | |
---|---|---|---|---|---|
Conservative | Jean Peet | 1,013 | 48.2 | +4.0 | |
Labour | Mike Barnes | 827 | 39.3 | +6.3 | |
Community Action | John Shale | 262 | 12.5 | +5.6 | |
Majority | 186 | 8.9 | -2.3 | ||
Turnout | 2,102 | 22.8 | -11.8 | ||
Conservative hold | Swing | -1.1 | |||
Dacorum Borough Council in Hertfordshire, England is elected every four years. Since the last boundary changes in 2007, 51 councillors have been elected from 25 wards.
Cornwall Council is the unitary authority for the county of Cornwall in the United Kingdom, not including the Isles of Scilly, which has its own council. The council, and its predecessor Cornwall County Council, has a tradition of large groups of independent councillors, having been controlled by independents in the 1970s and 1980s. Since the 2013 elections, it is run by an Independent-Liberal Democrat coalition.
One third of Wigan Metropolitan Borough Council in Greater Manchester, England is elected each year, followed by one year without election. Since the last boundary changes in 2004, 75 councillors have been elected from 25 wards.
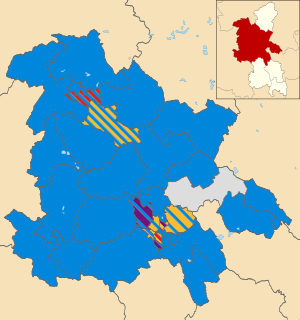
Aylesbury Vale District Council in Buckinghamshire, England is elected every four years. Since the last boundary changes in 2015, 59 councillors have been elected from 33 wards.
Braintree District Council in Essex, England is elected every four years. Since the last boundary changes in 2015, 49 councillors have been elected from 26 wards.
Elections to Wigan Council were held on 4 May 2000. One-third of the council was up for election, as well as an extra vacancy in Norley - both of which were uncontested. Since the election, there had been a by-election in which the Liberal Democrats gained the seat being fought in Hindsford from Labour.
Elections to Wigan Council were held on 2 May 2002, with one-third of the council to be re-elected. There had been a number of by-elections in the gap year, with a Labour gain from the Liberal Democrats in Hindsford, effectively cancelling out an earlier loss to them in Atherton. A Labour hold in Hope Carr in-between left both parties unchanged going into the election.
Elections to Wigan Council were held on 1 May 2003 with one-third of the council was up for election. Prior to the election, there had been two vacancies in Leigh Central, with Labour winning a by-election in June and the seat being fought in this election filled unopposed by Barbara Jarvis.
South Oxfordshire District Council in Oxfordshire, England is elected every four years. Since the last boundary changes in 2003, 48 councillors have been elected from 29 wards.
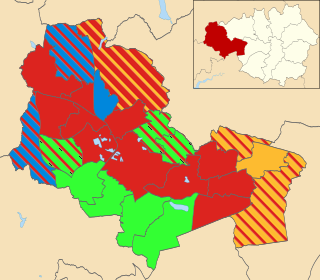
Elections to Wigan Council were held on 10 June 2004. The whole council was up for election with boundary changes since the last election in 2003 increasing the number of councillors by three. The Labour party kept overall control of the council.
Elections to Wigan Council were held on 4 May 2006. One-third of the council was up for election and the Labour party kept overall control of the council. Overall turnout was 29.2%.
Hertfordshire County Council in England is elected every four years. Since the last boundary changes, that took effect for the 2001 election, 77 councillors are elected for single member districts.
Brooklands is an area and electoral ward of Manchester, England. It is represented in Westminster by Mike Kane MP for Wythenshawe and Sale East. The 2011 Census recorded a population of 14,362.
One third of Runnymede Borough Council in Surrey, England is elected each year, followed by one year where there is an election to Surrey County Council instead. The council is divided up into 14 wards, electing 42 councillors, since the last boundary changes in 2000.
Elections to Wigan Council were held on 1 May 2008. One-third of the council was up for election.
The Broxbourne Council election, 2012 was held on 3 May 2012 to elect council members of the Broxbourne Borough Council, the local government authority of the borough of Broxbourne, Hertfordshire, England.
Elections to Wigan Council were held on 6 May 2010. One-third of the council was up for election.
Elections to Wigan Council were held in May 2011. One-third of the council was up for election. These elections were held as part of the United Kingdom local elections, 2011.
Elections to Argyll and Bute Council were held on 3 May 2012 on the same day as the 31 other local authorities in Scotland. The election used the eleven wards created under the Local Governance (Scotland) Act 2004, with 36 councillors being elected. Each ward elected either 3 or 4 members, using the STV electoral system.